Participation, Job Search and Mobility, Australia

This is not the latest release View the latest release

Labour participation potential, underemployment and job attachment, job search experience, labour mobility, hours worked, industry and occupation.

Reference period
February 2021
Released
7/07/2021

Key statistics

In Feb 2021 (as published 7 July 2021)

  • 2.2 million people who were not working wanted to work.
  • 1.7 million people not working were available to start work immediately.
  • 1.6 million people wanted to work more than their usual hours.
  • Over half a million employed people worked fewer than their usual hours for economic reasons.
  • 975,000 people changed jobs in the last year.

What's new this issue?

New table formats

The results from the February 2022 Participation, Job Search and Mobility survey will be released on 24 May 2022.

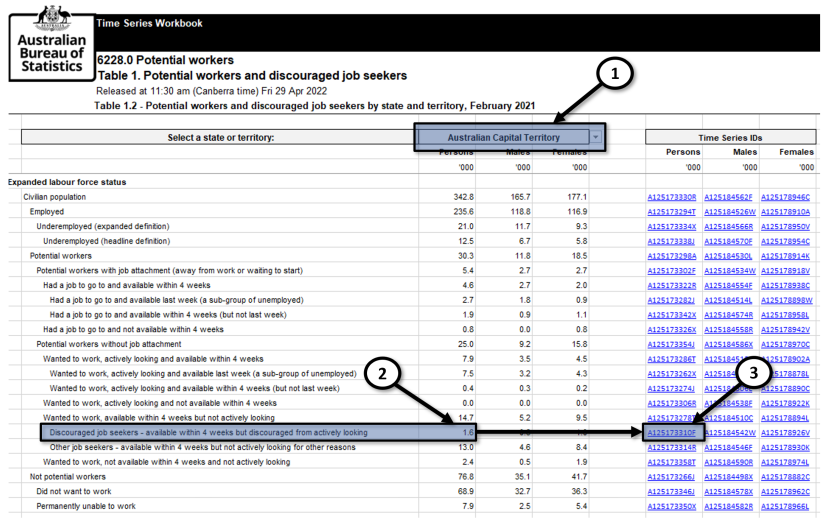
Ahead of this release, the results from the February 2021 survey, originally published on 7 July 2021, are republished below using new table formats. These new table formats incorporate two changes:

  • State and territory data now available in all tables
  • Tables are renumbered by topic

Some tables also incorporate additional age group data.

State and territory, age group, and other data breakdowns are available in TableBuilder (as originally published on 7 July 2021).

These new table formats will be used for the February 2022 release on 24 May 2022. 

Release schedule for Feb 2022 release

There are a number of planned changes to the Feb 2022 release of Participation, Job Search and Mobility (PJSM). 

The release of PJSM data into TableBuilder has been delayed until later in the year in order to prepare for the release of 2021 Census data in TableBuilder. PJSM microdata will instead be published in ABS DataLab as a supplementary file for the Longitudinal Labour Force microdata.

On 6 May 2022:

On 24 May 2022:

  • Potential workers for Feb 2022 will be released.
  • Job mobility for Feb 2022 will be released.
  • This page will be updated with tables containing February 2022 data for all three topics, including the Underemployed workers tables.

On 27 May 2022:

On 24 Jun 2022:

  • Underemployed workers is predominately based on underemployment data from the Labour Force survey and will be updated with the latest data from the May 2022 Labour Force survey. It will also be supplemented with February 2022 PJSM data on underemployed part-time workers (published on this page from 24 May 2022). 

Data downloads

How to use tables

  1. Select a state or territory
  2. The estimates shown in the table are for the most recent time period (February 2021)
  3. The corresponding Time Series ID links to series of annual estimates for earlier time periods (2015 to 2020)
Screenshot of a Table showing how to use the layout to find the latest estimates plus links to Time series data for previous estimates

Potential workers

Data files
Data files

Underemployed workers

Data files

Microdata and TableBuilder: Participation, Job Search and Mobility

Data files

What's new in 2021?

Topic based releases

From February 2021, statistics from the Participation, Job Search and Mobility survey are now published in three topic-based releases. See:

Data from the Participation, Job Search and Mobility survey for 2015 to 2021 will continue to be available in TableBuilder.

Potential workers and marginal attachment to the labour force

This release of statistics from the PJSM survey includes a simpler approach for presenting statistics on unused labour supply. The new Potential workers release of PJSM data presents statistics all people who are not employed (i.e. regardless of their classification in the monthly Labour Force Survey as employed or not in the labour force), and the extent to which they may be regarded as "Potential workers" based on their circumstances and activities.

Historically, PJSM content has been presented using the marginal attachment framework and the characteristics of people "not participating in the labour force", based on the criteria used to derive unemployment (i.e. activity and/or availability). 

While the new approach to presenting statistics for potential workers differs slightly from the traditional marginal attachment framework, and presents some population groups that do not entirely overlap with some of the marginally attached groups, there is still a strong alignment between them. Also statistics within the traditional marginal attachment framework are still available.

Revisions for people who had a job to go to

In 2018, a new category was introduced to the marginal attachment framework – “Had a job to go to.” – to reflect people who reported having a job but were not classified as employed (for example, as they had not yet started a new job already obtained, or had been away from work without pay for more than four weeks.

A review of the methods used to identify people who “had a job to go to” identified that some of the relatively small group of people who were not available to start work within four weeks were inadvertently excluded from this group. As a result, estimates have been revised for the period 2015 to 2021. New sub-categories have also been included to separate this group into those who were available to start last week, those who could start within 1-4 weeks, and those who were available in over 4 weeks.

New timeseries spreadsheets

The PJSM data downloads (Excel spreadsheets) have been redesigned to adopt the timeseries format used in publishing the monthly Labour Force statistics. Previously, most PJSM data downloads contained only one year of data, with revised historical data provided in a zip file of separate yearly tables.

The new timeseries format simplifies and consolidates the PJSM data downloads into a single set of 22 spreadsheets. Each spreadsheet contains timeseries data for 2015 to 2021. The timeseries format also facilitates automatic downloads and “data scraping,” with each timeseries provided a unique series ID. To assist with the transition to the timeseries format, two extra tabs have been provided in the spreadsheets. The first tab presents the data for February 2021 in the old table format. The second tab arranges the links to each timeseries in the same table format, using the unique timeseries IDs.

Estimates that exceed relative standard errors of 25% and 50% and should be used with caution will continue to be highlighted in the timeseries spreadsheets (cells with red triangles), however the relative standard error values will now be provided in separate zip file containing 22 “shadows tables”.

Improvements to TableBuilder

Many improvements have been made to the PJSM tablebuilder file to simplify the way data items are presented, increase the range of data items and generally enhance the usability of the product. These changes include:

  • Previously, two separate data items measuring the same concept across different sub-populations (for example, availability to start work last week for people not in the labour force, and for people who were underemployed) were presented as two different output variables (specific to each sub-population). These have been combined into single output variables that can be applied across all populations.
  • The way that data items are arranged in TableBuilder has also been changed to better reflect different conceptual groupings (rather than populations and data items) to assist with understanding the data and using the dataset. Data items are now listed under one of 17 conceptual groups.
  • Each data item now has a descriptive label to describe which populations are not included under the main categories. For example, in the data item “Main difficulty in finding work,” the “Not applicable” category has been relabelled “Did not look for work”
  • Hours worked data items have been aligned so they all provide data to the same level of detail. There is now consistency in the lowest available level (usually single hours or single weeks), and the way that these items are aggregated into higher level groupings. Hours worked data items are now included as parametric items, to allow for more medians and means to be calculated.
  • Occupation data is now provided to the unit group level (4 digit), although TableBuilder may suppress this level of detail if a requested table is too finely detailed. Occupation data can be aggregated to minor, sub-major and major group levels (3, 2 and 1 digit) to avoid a table suppression
  • Some data item labels have been revised or shortened to improve interpretability (note that the concepts remain the same)

See Microdata: Participation, Job Search and Mobility, Australia release for further information of the changes.

Rebenchmarking and seasonal factor adjustments

Since 2018, the PJSM data have been rebenchmarked every year to reflect the most recently available release of Estimated Resident Population (ERP) data and Labour Force Survey population benchmarks. The data for 2015 to 2021 have been revised to incorporate the population benchmarks that were used to produce estimates published in the April 2021 Labour Force, Australia.

To reduce the impact of seasonal effects on total employment, underemployment and unemployment, the benchmarks have been adjusted by factors based on seasonally adjusted Labour Force Survey estimates (as published in April 2021). For example, February estimates have a typical seasonal pattern of higher unemployment. The factors applied reduce the number of unemployed, to align with seasonally adjusted LFS estimates.

Trend series factors would usually be used in PJSM benchmarks but are currently not available, during the COVID period. Seasonally adjusted factors will be used until trend series are reinstated in Labour Force statistics.

Post release changes

3 June 2022:

  • Updates to Job Mobility Table 3 - fixing position error for "Whether promoted or transferred with current employer in last 12 months" data. 

29 April 2022:

  • New table formats, including state and territory data
  • New information regarding release schedule for the upcoming Feb 2022 issue

6 September 2021:

  • Updates to Table 21 - revisions to Population 5: Part-time workers who would prefer full-time hours.
  • Updates to Table 10 - revisions to table format to separate "left or lost job for other reasons" from the "Voluntary reasons (left job)" category. No revisions to data.

Previous catalogue number

This release previously used catalogue number 6226.0 (and 6226.0.55.001 in 2014).

Prior to 2014, statistics were published in:

Back to top of the page