General forms design principles: Question type

Latest release
ABS Forms Design Standards
Reference period
2023
Released
11/08/2023
Next release Unknown
First release

Introduction

The type of question you are asking has important implications for many aspects of the survey cycle beyond the data collection phase (e.g. data processing and data analysis).

Consider the following guidelines to inform decisions made when developing new questions or updating old ones:

  • determine the type of data to be collected
  • determine the answer format required
  • determine the type of measurement to be used.

Refer to the additional resources for further information about the types of questions used in surveys.

Use this chapter in conjunction with the 'Question structure' chapter which provides guidelines on asking, arranging, and presenting questions.  

Determine the type of data to be collected

Factual

Use 'factual' questions to gather facts or concrete, quantifiable information, and observable phenomena.

Responses to 'factual' questions can usually be verified through:

  • asking another similar question
  • conducting a post-enumeration study (an activity completed following a survey to evaluate the accuracy of the data collected) 
  • other independent sources of information (e.g. records and documents, another observer of the event).

Respondents can answer 'factual' questions through checking their records (Diagram 1), recall (Diagram 2) or the use of classifications (Diagram 3). 

Funding for operational costs from federal, state and/or local government

Diagram 1

Respondents are asked to recall the level of supervision patients need for mobility outside the hospital

Diagram 2

The Field of research classification is used to categorise research and development projects.

Diagram 3

Survey questions can also be used to test factual knowledge (e.g. Who is the Prime Minister?).

Non-factual

Use 'non-factual' questions to gather information on subjective phenomena including attitudes, beliefs, awareness, knowledge, and preferences.

Responses to 'non-factual' questions cannot usually be verified (e.g. what motivates a business and the impact of caring on a relationship shown in Diagram 4 and Diagram 5 respectively).

Note that responses to 'non-factual' questions can be influenced by:

  • attitudes that are not fully developed
  • limited in-depth thinking around the issue
  • changes to question wording
  • context effects, including the presence of other people.
Did any of the following factors motivate this business to implement improvements to environmental management? (Tick one box per line). Responses: Compliance with government regulations was a main motivator; Compliance with government regulations was a minor motivator; Compliance with government regulations was not a motivator.

Diagram 4

Response options measure the impact caring has on a relationship. For example, No effect, It has brought us closer together, We lack time alone together, It has placed a strain on our relationship.

Diagram 5

It should be noted that the distinction between non-factual and factual questions is more of a continuum than a dichotomy. Some questions are not factual or non-factual, but rather 'somewhere in between.' For example, the following question does not fall clearly in the factual or non-factual category: 'Do you expect to be working for this (employer/business) in 12 months' time?'

Avoid the use of proxy reporting for non-factual questions (e.g. attitudinal questions) because the respondent answering questions on behalf of other household members generally could not know what another person would report.

Behavioural and hypothetical

Use behavioural questions to gather information about respondents' activities based on factual circumstances (Diagram 6).

Question asks: Last week, did you do any work at all in a job, business or farm?

Diagram 6

Make it easier for respondents to answer behavioural questions by:  

  • setting a reasonable and specific time frame (e.g. Last week...)
  • covering topics that respondents can remember easily
  • encouraging record checking, where possible. 

Also see 'Be aware of memory bias' in the 'Question structure' chapter.

Questions about behaviour can also be hypothetical (e.g. 'What would you do if...?') but these types of questions are best avoided because responses tend to be unreliable. 

Hypothetical questions are best used when respondents are familiar with the situation (e.g. asking a respondent responsible for the payroll, 'If an employee went on holidays at the end of January and was paid in advance for all of February, would you include them in the number of employees reported for the pay period ending on or before 21 February?').

Demographic

Include demographic questions so that the main groups of respondents can be identified (e.g. by age, industry etc.). This can help explain the survey findings.

Place demographic questions at the end of the survey where possible because:

  • they are not 'simple' starter questions (topics such as sex and age can be sensitive and complicated for some respondents)
  • the added context of the survey content encourages respondents to answer honestly
  • it helps ensure details for the right respondent are captured if more than one person is completing the questionnaire.

They can be placed at the start of the survey in some circumstances, but this section should be kept as brief as possible.

Place demographic questions throughout the survey as filter or sequencing questions when necessary.

Determine the answer format required

There are three types of questions: open-ended, closed and partially-closed.

The answer format determines the degree of freedom respondents have when answering a question.

Consider the following factors when determining which question type to use

  • The level of detail that data users require (e.g. for 'total income' respondents can either select from an income range or write in an exact dollar amount)
  • What information is potentially available from the respondent (e.g. do respondents have enough detailed information to report an exact dollar amount?)
  • The position of the questions in the form
  • Whether the survey is a one-off or a continuing request
  • Whether it is a sensitive question (also see 'Carefully consider where sensitive questions are placed' in the 'Question structure' chapter)
  • How the data will be processed (e.g. captured electronically or manually coded)
  • Availability of your organisation's resources (e.g. time, money, staff)

Test the question to determine whether the correct type has been selected. 

Open-ended questions

Open-ended questions allow respondents to freely enter their answer, rather than having to select from options (Diagram 7).

Free text field asking respondents to provide any comments on 'this job'.

Diagram 7

Ensure the size of the answer box is appropriate for the expected responses, with a larger box for longer responses (Diagram 8), and a smaller one for shorter responses (Diagram 9).

Large free text field has at 4 or more lines for people to write in their response

Diagram 8

Free text field has 3 lines to record their answer

Diagram 9

Provide examples or directions on how to answer an open-ended question (Diagram 10).

Question with examples: Please describe the activity from which this business derives its main income (e.g., road freight transport, footwear retailing, house building, real estate property management)?

Diagram 10

Advantages of open-ended questions are that they: 

  • allow many possible answers
  • obtain the exact value from a wide range of possible values
  • add richness to responses that is difficult, or impossible, to achieve through closed questions
  • determine the range of possible answers and the availability of the data being sought during initial testing
  • can speed up an interview because there are no response options for the interviewer to read aloud.

Disadvantages of open-ended questions are that they:  

  • are time consuming to answer. Respondents must write out or verbally formulate an answer compared to selecting a response in a close-ended question
  • are more resource intensive to process manually where a coding frame is used to interpret responses. This is because responses will often differ in detail and accuracy making them difficult to categorise (Diagrams 11a and 11b) 
  • can be difficult when electronic scanners can not accurately recognise poor handwriting, especially numbers, when using paper forms that rely on Optical Character Recognition (OCR)

  • can be difficult for interviewers to code or write verbatim responses depending on the level of detail respondents provide.

What is your occupation? Response: 'Clerk'

Diagram 11a

What is your occupation? Response: 'Trainee sales clerk in a life insurance company.'

Diagram 11b

Closed questions

Closed questions require respondents to select an answer from a list of response options (Diagram 12).

'How many people does this business employ? (Tick one box)'. Response options: None; 1 to 4; 5 to 10; Over 10.

Diagram 12

Include instructions that tell respondents how they should complete closed questions. These instructions can be placed in the 'Please read this first' box (Diagram 13), included in caption headings (Diagram 14) and mentioned in instructions specific to the question (Diagram 15).

'Please read this first' is centred, followed by 3 dot points: Please complete a separate form for each person in this dwelling, including children aged less than 15; For children aged less than 15, answer Part 1 - General information, Questions 1 to 7 only; Answer questions by ticking the appropriate box, or where required, by writing in an answer.

Diagram 13

Caption heading placed above answer boxes: 'Please tick all that apply'.

Diagram 14

Question specific instruction: 'Is the person an Australian citizen? (Mark one box, like this (answer field is marked with a black line).

Diagram 15

Use terminology that makes sense for the survey mode when providing instructions for completing closed questions such as 'tick' in paper forms (Diagram 14) and 'select' in web forms (Diagram 16).

Web form uses: 'Select one per row' rather than 'Tick all that apply'.

Diagram 16

Do not instruct respondents to circle the appropriate option or cross out incorrect options.

Response options for closed questions must adhere to the following principles:

  • Cover all possible response options, ensuring the list is exhaustive with no possible answers left out or implied.  
  • Include options that cater for a zero, 'not applicable', 'don't know' or 'prefer not to answer' response if it makes sense for a particular question.
  • Ensure that the response options provided reflect the respondents' characteristics or experience.
  • Keep the list of response options to a manageable length.
  • Ensure response options are self-explanatory.
  • Use words and terms in the response options that are familiar to respondents. Test the question to ensure respondents understand the words as intended.
  • Ensure that all response options for a particular question are mutually exclusive. Do not overlap your response categories.

For example:

Do say

  • Under 1 year
  • 1 year and under 5 years
  • 5 years and under 10 years
  • 10 years or more

Don't say 

  • 1 to 5 years
  • 5 to 10 years
  • Over 10 years

Consider the advantages of closed questions which include:

  • comparatively less effort for respondents to answer as an exact value is not needed
  • less time taken to complete the survey because respondents can generally select their answer from a list of response options
  • the ease and cost effectiveness of processing data because nearly all the responses can be anticipated
  • making a question less sensitive (e.g. asking respondents to select from a personal income range is less sensitive than asking for an exact dollar value).

Consider the disadvantages of closed questions which include:

  • the effort required to develop well-crafted questions that avoids the need for respondents to qualify their answers
  • difficulty in developing comprehensive lists of response options
  • slower administration during interviews if a running prompt needs to be used, where each response option is read out and respondents must indicate whether it applies to them or not 
  • repetition when rating scales are used (e.g. satisfied/dissatisfied) in a personal interview because the scale must be verbally presented to the respondent each time it is used.

Partially-closed questions

A partially-closed question is a mixture of an open-ended and closed question. Respondents can select an answer from a list of response options but also have the option of writing-in a response that is not on the list (Diagram 17).

Present partially closed questions by placing the list of pre-determined response options first and ending the list with an 'Other (please specify)' option followed by an appropriately sized answer box.

Partially closed question: 1. Nurseries, cut flowers or cultivated Turf; 2. Grapevines; 3. Other crops (please specify).

Diagram 17

Consider the advantages of partially-closed questions which include:

  • the ease and cost effectiveness of processing data compared to open questions 
  • being able to still use a closed question format even when there is uncertainty around whether the list of response options is comprehensive
  • having a format that is ideal for dress rehearsals or a pilot test instrument to help develop a more comprehensive list of response options for the final instrument.

Consider the disadvantages of partially-closed questions which include:

  • instances where respondents restrict their responses to the choices that are explicitly offered and not use the 'Other (please specify)' option
  • greater demand on office processing if the response options are not comprehensive and the 'Other (please specify)' option is used extensively.

Determine the type of measurement to be used

Types of measurement include nominal categories, ranking questions, rating scales and numeric quantities.

Select the type of measurement to be used for data collection carefully because it impacts subsequent statistical procedures that can be used for data analysis.

Nominal categories

Nominal categories have no inherent order or structure.

Examples include:

  • No/Yes (or Yes/No) options (Diagram 18)
Is this a not for profit organisation? Responses: No; Yes

Diagram 18

  • Selecting one response from a list of options (Diagram 19)
What main method of heating is used in this house? (Tick one box); Responses: None; Electricity; Gas; Other.

Diagram 19

  • Selecting one or more responses from a list of options (Diagram 20)

What forms of heating are used in this house? (Tick all that apply); Responses: None; Electricity; Gas; Other

Diagram 20

Nominal categories are typically used to group other data together and help provide an explanation for other findings (e.g. household expenditure can be compared between those who use electric heating versus those who use gas heating).

Descriptive statistics such as frequencies are commonly used to analyse nominal variables (e.g. 43 per cent of households use electric heating). 

Avoid ranking questions

Ranking questions ask respondents to place nominal response options in some sort of order. For example, in Diagram 21 respondents are asked to number the different response options in order of importance.

Please rank in order of importance the following benefits of ordering goods and services via the internet. Response options: Lower production costs; Lower transaction costs; Time saving; Access to a wider range of suppliers; Ability to track orders.

Diagram 21

Avoid using ranking questions because:

  • the required task is complex and difficult to explain to respondents.
  • respondents often have difficulty completing them correctly even if they understand the task, as they may not be able to make judgements that 'fit' (e.g. respondents may want to rank two response options as having equal importance, but they are not allowed to do so).
  • it can be difficult to interpret the results when respondents rank some items but leave others blank.

Ask respondents to rate each item individually instead by using a labelled rating scale. This allows them to imply a ranking order where there was one, rate items the same where there is no difference, and indicate where items are not applicable (Diagram 22). 

What were your reasons for making these changes and how important where they? (Tick one box per line). Responses: Increased productivity was not a reason, Increased productivity was low importance; Increased productivity was medium importance; Increased productivity was high importance; Increased land value was not a reason; Increased land value was low importance; Increased land value was medium importance; Increased land value was high importance.

Diagram 22

Rating scales

Rating scales allow respondents to rate things such as the existence of an attitude, the favourability of an item, the frequency of a behaviour, the intensity of feeling or degree of involvement (Diagram 23).

Please indicate how the ability to receive orders for goods or services via the internet or web has affected quality of customer service: Decreased; No change; Increased.

Diagram 23

Rating scales provide ordinal data as the response options have an inherent order (e.g. agree-disagree scale shown in Diagram 25) but the interval between each scale point is not meaningful. (Also see 'Be aware of order effects' in the 'Question structure' chapter).

Like nominal categories, ordinal data can be analysed using descriptive statistics (e.g. number of cases), but a wider range of statistical analysis techniques can also be used (e.g. ordinal regression).

Label all points on a verbal rating scale with words. This clarifies the meaning of the scale points, which improves reliability and validity (Diagram 24).

Rating overall health 5 point scale: Excellent, Very good, Good, Fair, Poor

Diagram 24

Present rating questions in a similar format to other closed questions, where the list is presented vertically down the page (Diagram 26), except when the scale is being used as a heading in a matrix (Diagram 25).

How strongly do you agree or disagree with the following statements? Statements are presented vertically down the page. Rating scale is presented horizontally across the page: Strongly agree; Somewhat agree; Neither agree nor disagree; Somewhat disagree; Strongly disagree.

Diagram 25

Use an equal number of positive and negative words for scales that reflect two opposite alternatives (i.e. bipolar scales) (Diagram 26). This indicates that all options are equally valid which helps to avoid bias.

To what extent do you agree or disagree that it is a good thing for a society to be made up of people from different cultures. Scale presented vertically down the page: Strongly agree; Agree; Neither agree nor disagree; Disagree; Strongly disagree.

Diagram 26

For bipolar scales, avoid scale labels that contain more options for one side (usually positive) because it biases the responses towards that side for the following reasons:

  • The lack of sufficient negative options leads the respondent to believe a negative response is discouraged (i.e. social desirability).
  • Respondents might incorrectly assume that the scale points represent the true distribution of the population and try to agree with the majority.

Include an appropriate neutral option to give respondents a formal way to indicate when (they think) a question does not apply to them. (See 'Include explicit 'Don't know', 'Not applicable' or 'Refusal' response options where valid' in the 'Question structure' chapter).

Avoid forcing respondents to produce an opinion on the spot as this often results in answers that are neither accurate nor stable.

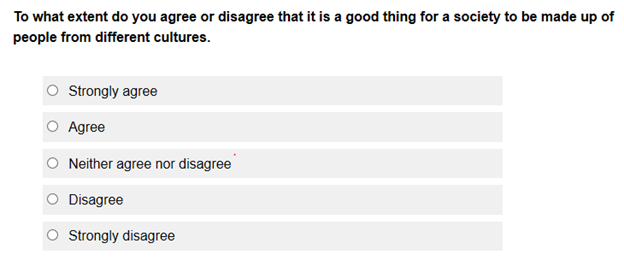
A neutral option can be placed in the middle of a bipolar scale (e.g. Neither agree or disagree in Diagram 26).

Consider the following guidelines for presenting neutral options in a self-administered mode: 

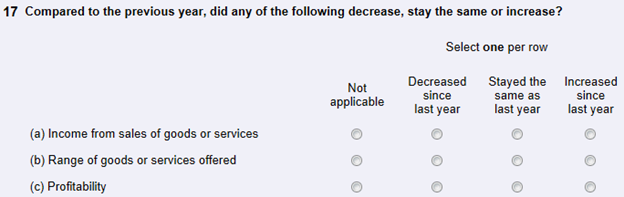
  • Place the 'Don't know' and 'Not applicable' options at the end of the scale to ensure that respondents consider all the preceding response options first.
  • Avoid placing the 'Don't know' and 'Not applicable' options in the middle of the scale. There is a tendency for respondents to select a response from the mid-point (i.e. central tendency) regardless of the label which creates bias.

Neutral options can be presented in the following ways when using an interviewer-administered mode:

  • The 'don't know', 'not applicable' or 'refusal' options are not read out but used when respondents genuinely cannot answer the question. 
  • The 'don't know', 'not applicable' or 'refusal' options can be read aloud in some cases. For example, under a proxy reporting arrangement, it might be common for the selected person to genuinely not know information about, or attitudes of, another person in the household.

Consider the following factors when determining the number of scale points to be used

  • The labels chosen
  • The topic being measured
  • The extent or level of intensity required
  • Whether a middle or neutral option is to be included (e.g. neither satisfied nor dissatisfied)
  • If a 'Don't know' or 'Not applicable' option is necessary

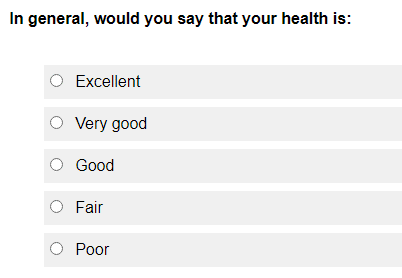
Use a five-point rating scale for non-factual questions when a survey is visually presented to respondents (e.g. web form and paper form).

Avoid using scales that have more than five points in telephone surveys. Respondents must listen and remember all the information about the question, including the rating scale, without visual aids during a telephone survey. Consequently, complex scales can contribute to cognitive burden for respondents.

Ensure that a five-point bipolar scale consists of the following:

  • One high intensity option for each direction (e.g. 'very dissatisfied' and 'very satisfied)
  • One mid-range intensity option for each direction (e.g. 'dissatisfied' and 'satisfied')
  • One neutral option (e.g. 'neither satisfied nor dissatisfied')

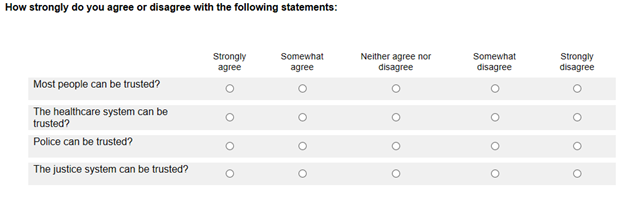
Multiple-item scales use more than one question to measure the same topic of interest (e.g. attitudes) in a more reliable and valid way. They are preferred for non-factual questions over a single question because:

  • the respondent's answer cannot be verified as there are usually no 'right' or 'wrong' answers
  • non-factual topics (e.g. attitudes) can be quite complex and it is unlikely that a single question will reflect them adequately            
  • they improve consistency of a measure such that the same results are obtained when the measure is used repeatedly (i.e. reliability)
  • they reduce instability related to the actual question form and wording, context, and mood at a particular point in time.

Use suitable existing validated scales known for obtaining reliable data where possible for non-factual questions.

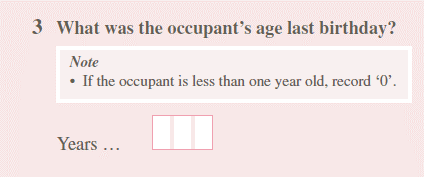
For less important non-factual topics, a single question can be used, however it will be less reliable and more likely to be subjected to bias.

Numeric quantities

Respondents can be asked to provide an answer that is a numeric quantity (e.g. age in Diagram 27 and income in Diagram 28), which can be described as a ratio variable.

What was the occupant's age last birthday? Note: if the occupant is less than one year old, record '0'.

Diagram 27

Total taxable gross earnings. Excluding: Amounts salary sacrificed.

Diagram 28

Ratio variables have a clear zero point. Ordering and distance measurement is also possible with ratio variables. For example, it can be said that someone who is 50 years old is twice as old as someone who is 25 years old. It is also meaningful to talk about the 'average' age of a population group.

A wider range of statistical techniques can be applied to ratio variables (e.g. t-tests, regression) compared to ordinal variables.

Be aware that some respondents may not be able or willing to provide a precise number. 

Additional resources

Bryman, A. (2012). Social research methods. Oxford University Press.

Walliman, N. (2011). Research methods: The basics. Routledge Taylor & Francis Group.

Back to top of the page