Significant Urban Areas
Significant Urban Areas (SUAs) represent Urban Centres, or groups of Urban Centres, that contain population of 10,000 persons or more. They are based on Urban Centres and Localities (UCLs) and built from Statistical Areas Level 2 (SA2). This enables a wider variety of statistical data to be available on this geography including non-Census data such as Estimated Resident Population (ERP).
SUA design criteria
Significant Urban Areas are designed by combining one or more adjacent SA2s based on the following criteria:
- SA2s containing an Urban Centre of 10,000 persons or more are considered to be Significant Urban Areas. Other SA2s containing Urban Centres within a 5 kilometre distance via sealed road of large Urban Centres can be aggregated into the same Significant Urban Area.
- SA2s containing Urban Centres of 7,000 persons or more can be considered for classification as a Significant Urban Area if there are other Urban Centres within a 5 kilometre distance via sealed road and the combined population of the Urban Centres is over 10,000.
- SA2s that are included in an SUA should all be within the same Labour Market as defined by the Greater Capital City Statistical Area (GCCSA) classification. The Statistical Areas Level 4 (SA4) of Newcastle, Lake Macquarie and Hunter (exc Newcastle) are considered the same Labour Market.
- SUAs can cross state and territory borders.
- SA2s that are not classed as being in an SUA are combined to form a Not in any Significant Urban Area region for each state and territory. Combined they cover all of the country without gaps or overlaps.
SUA name criteria
The key criteria for Significant Urban Area names are that they be:
- meaningful
- maximum of 50 characters
- unique within Australia
Significant Urban Areas that contain a single Urban Centre will be named after that Urban Centre, for example:
- Alice Springs
- Albany
- Mount Gambier
Significant Urban Areas that represent a combination of two or more Urban Centres will reflect the names of the Urban Centre(s) that contribute the greater population, for example:
- Newcastle – Maitland
- Victor Harbour – Goolwa
Where a Significant Urban Area crosses a state or territory border it is named after the largest Urban Centre on each side, for example:
- Gold Coast – Tweed Heads
- Canberra – Queanbeyan
Where a Significant Urban Area represents an identifiable region which contains multiple Urban Centres, it is named for that region, for example:
- Central Coast
- Sunshine Coast
SUA coding structure
Significant Urban Areas are identifiable by a unique 4-digit non-hierarchical code, with the first digit identifying the State or Territory. Significant Urban Areas which cross state boundaries are identified by the state or territory which contains the Urban Centre with the largest population in that Significant Urban Area. The regions representing those parts of a state or territory Not in a Significant Urban Area have codes ending in 000.
The remaining three digits of Significant Urban Area codes are assigned alphabetically within each state and territory starting from 001. As a result, the codes used for Edition 3 Significant Urban Areas may not match those used previously as some names have change since Edition 2 (2016).
| S/T | SUA | SUA name |
|---|---|---|
| 5 | 009 | Perth |
| 3 | 007 | Gold Coast - Tweed Heads |
| 8 | 000 | Not in a Significant Urban Area (ACT) |
SUA changes
Large urban areas and their populations are dynamic. They can grow, absorb nearby centres or decline. Consequently, Significant Urban Areas (SUAs) change between editions so that they continue to provide an effective statistical representation of these urban areas. Some examples of the way Significant Urban Areas can change are described below.
Boundary changes
Changes to Significant Urban Area boundaries occur primarily because of population growth reflected in Urban Centre and Localities and/or changes to Statistical Area Level 2 (SA2) boundaries. In many cases, population growth and associated Urban Centre and Locality changes are contained within SA2 boundaries. This is because SA2s are deliberately designed to include potential growth on the edges of urban areas. As a result, both SA2s and Significant Urban Areas can experience some population growth without any boundary changes.
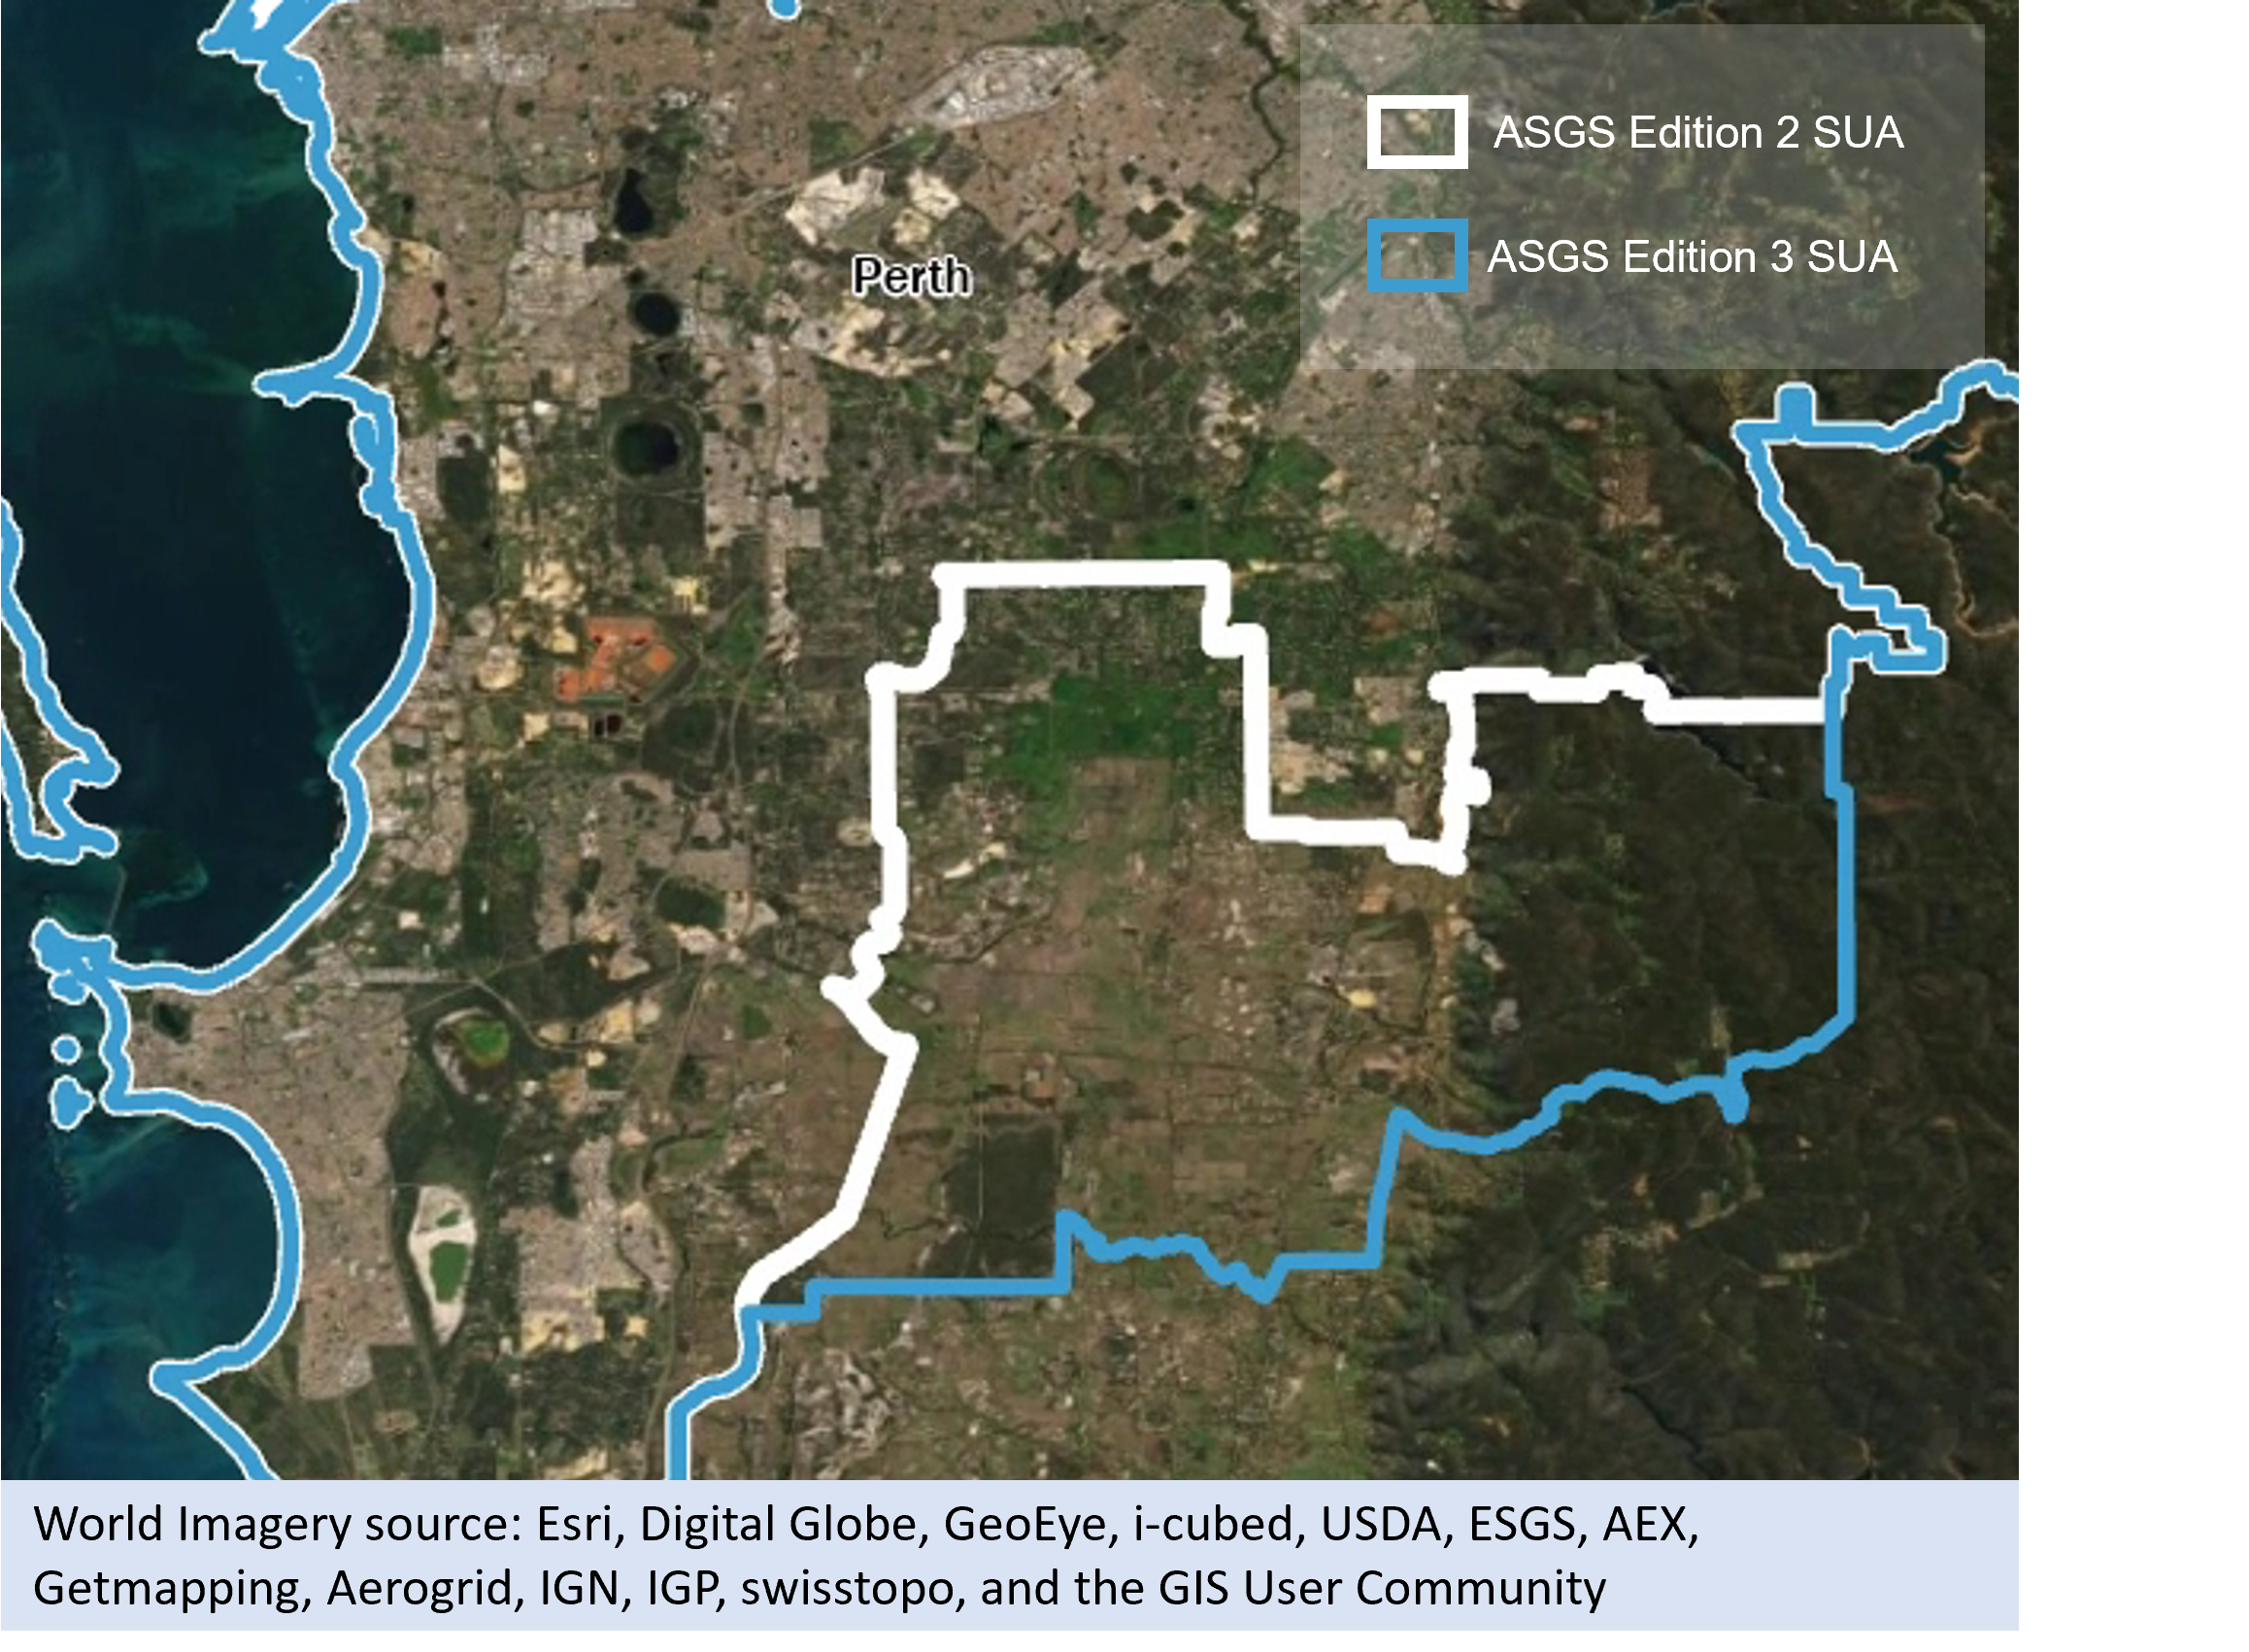
Where population growth or change occurs that cannot be defined by previous boundaries, Significant Urban Area boundaries can change in several ways. Most commonly, when small Urban Centres just outside a Significant Urban Area grow to within 5 kilometres of the Urban Centres within the Significant Urban Area, the adjacent SA2 may be added in. For example, the Perth Significant Urban Area has grown to include the Mundijong SA2 as shown below.
Growth of Perth SUA boundary over time
Image
Description
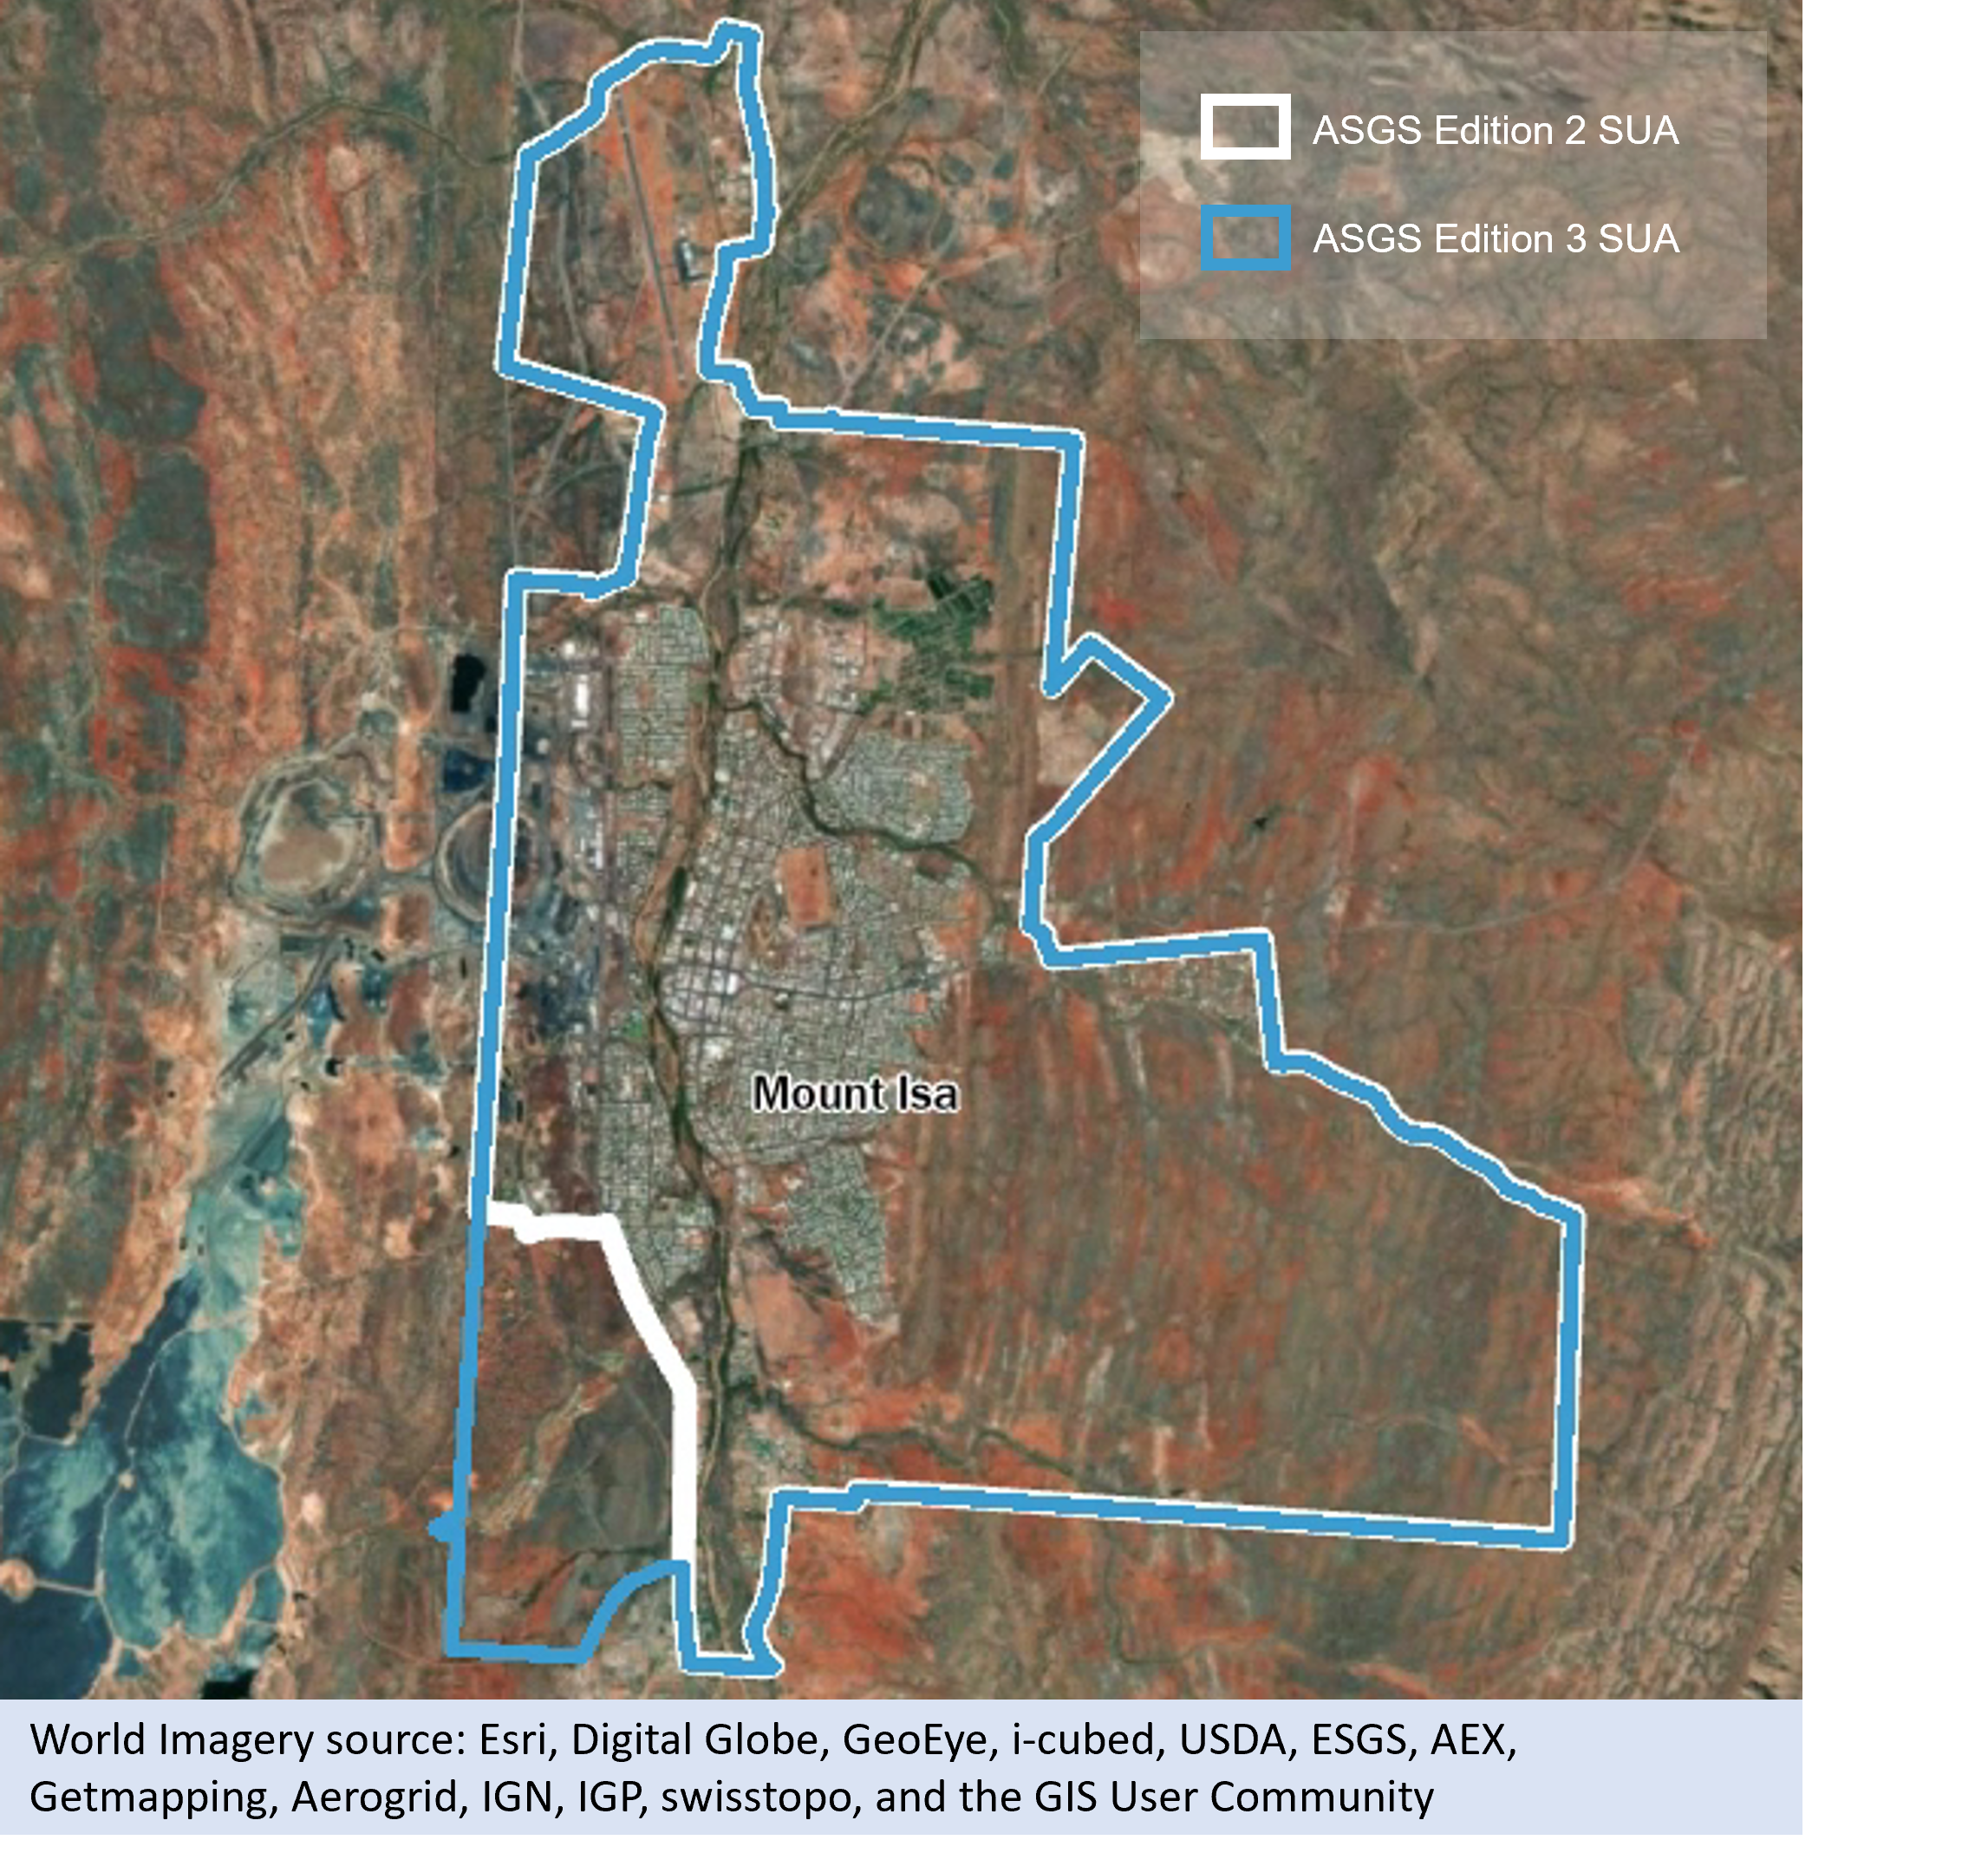
Alternatively, Significant Urban Areas change to reflect alterations to SA2 design. For example, the boundary of the Mount Isa SA2 was altered in Edition 3, so the Significant Urban Area boundary has also changed as shown in the image below.
Mount Isa SUA change due to SA2 design
Image
Description
Amalgamations
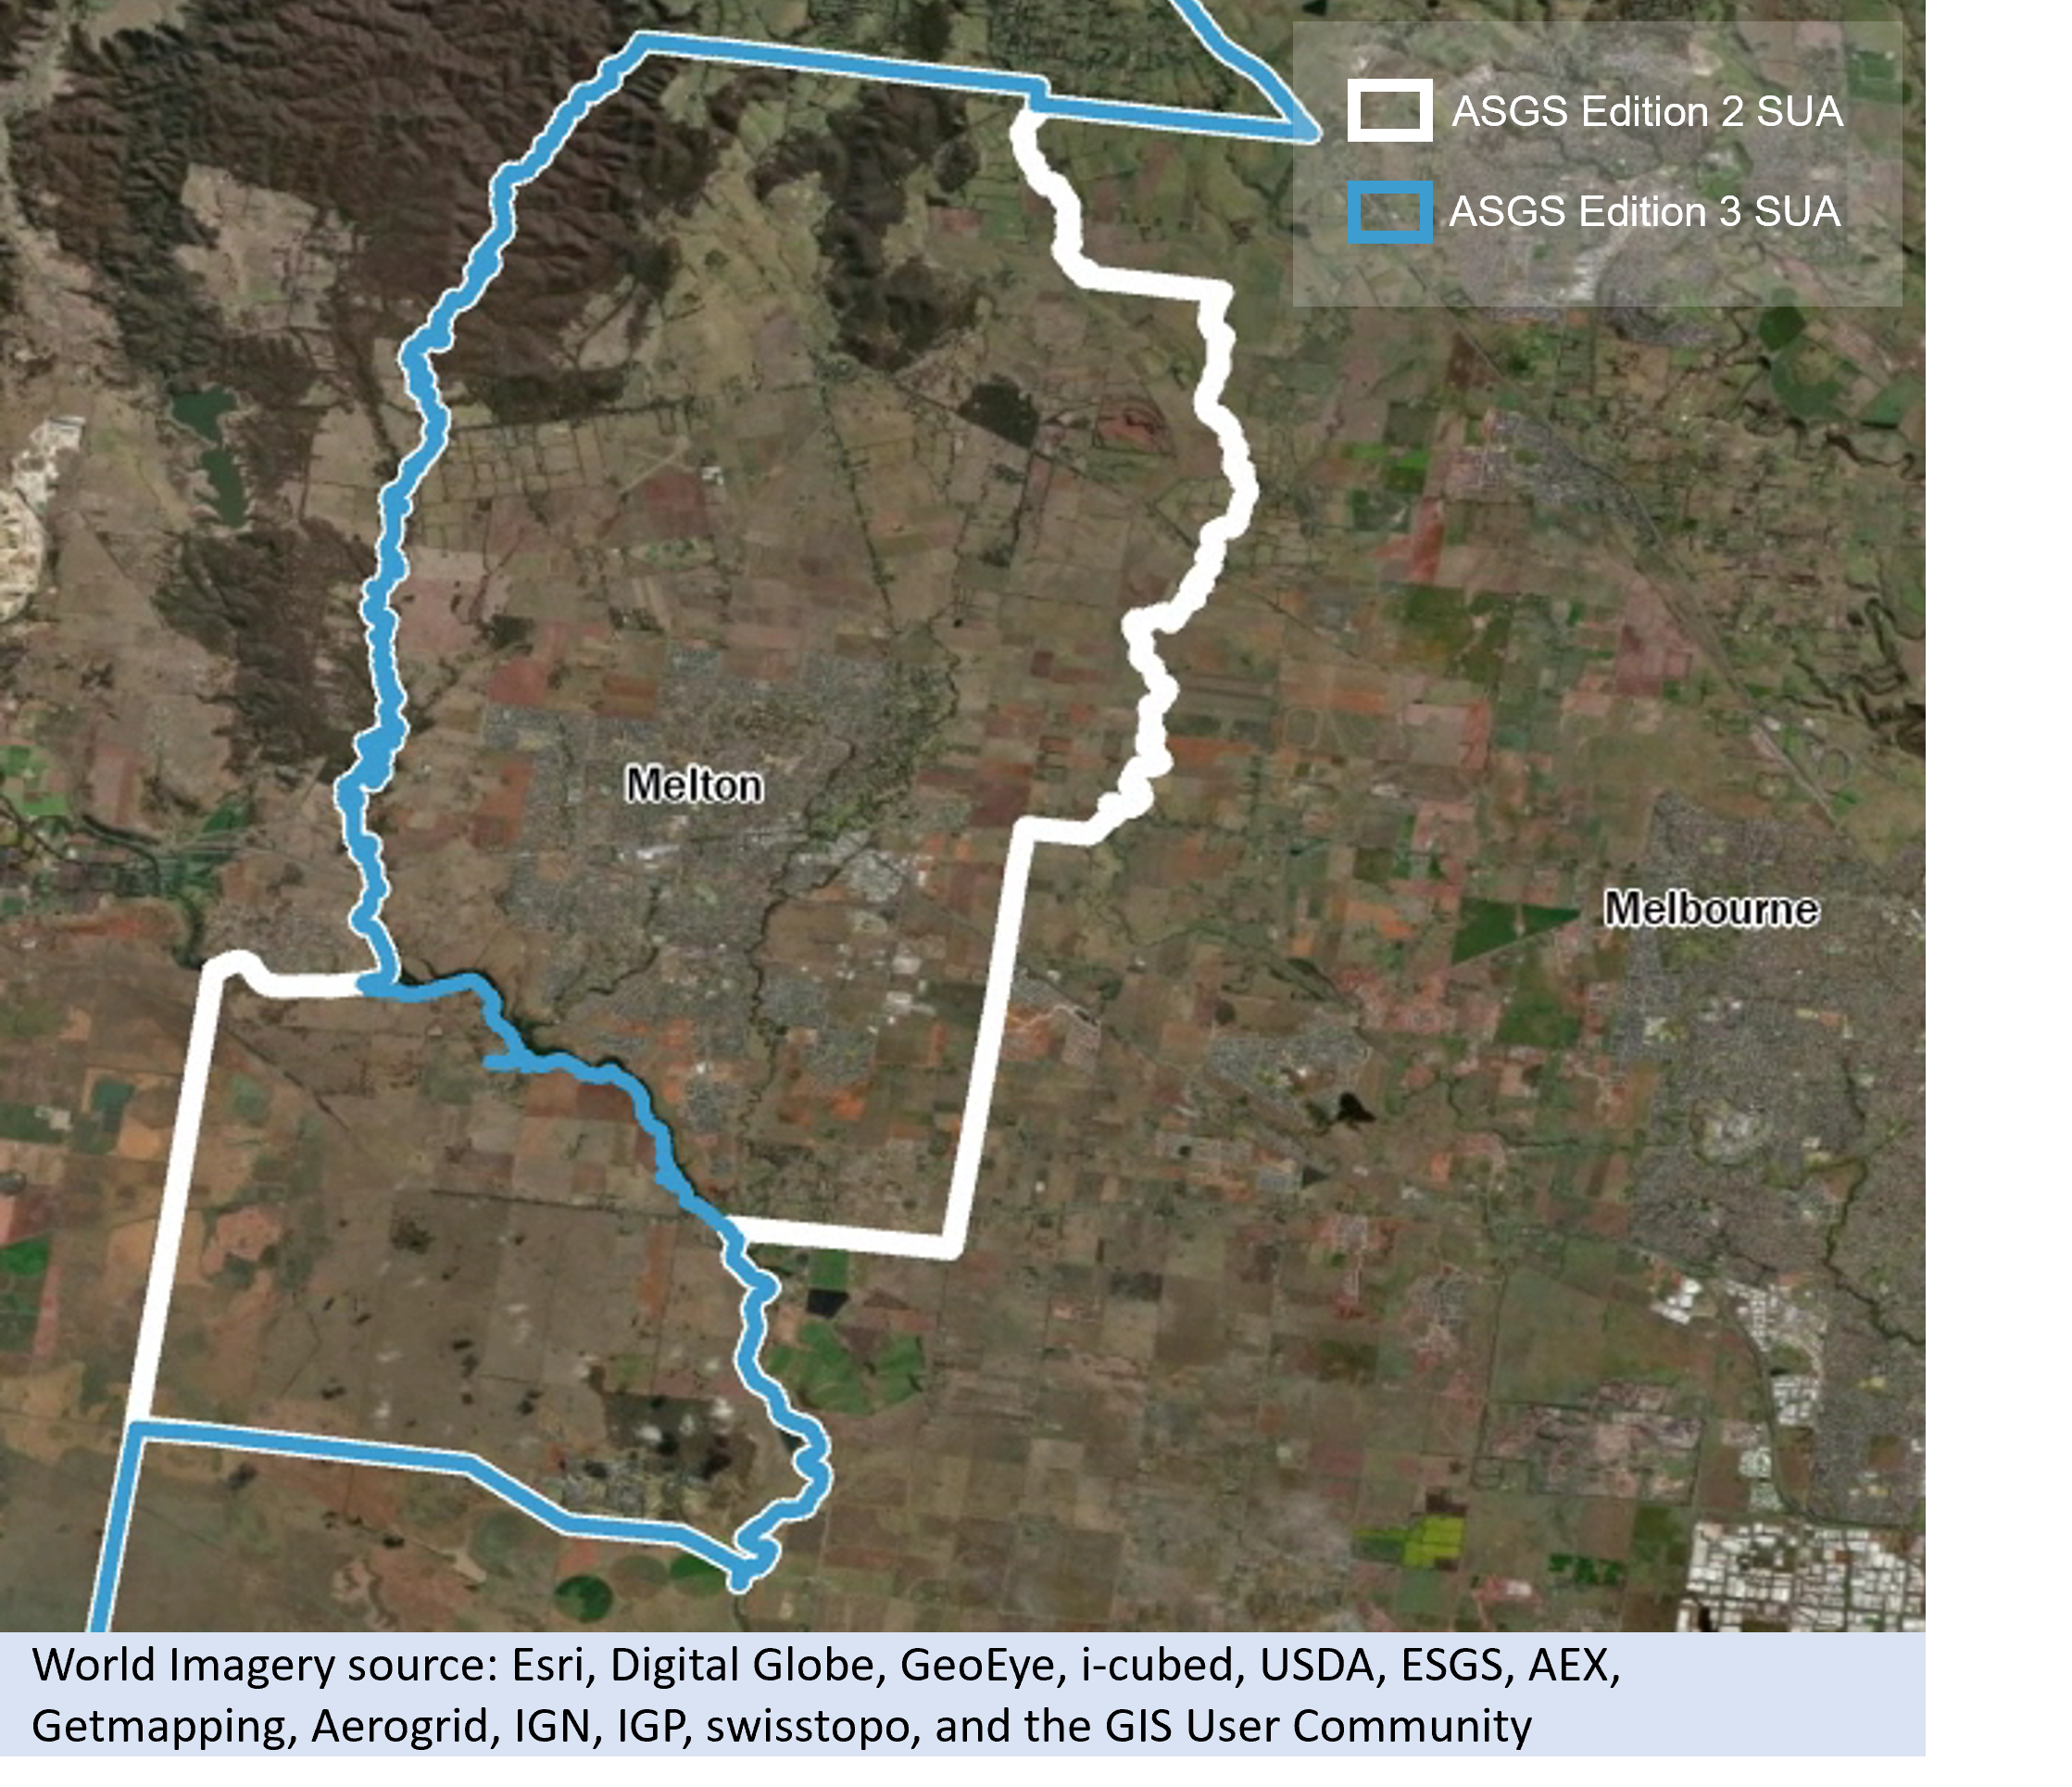
Amalgamations of two existing Significant Urban Areas occur when growth and change takes place in two large, neighbouring Urban Centres. This typically occurs when larger regional centres become connected to capital cities or other regional centres along growth corridors. The amalgamation of the Melton and Melbourne Significant Urban Areas in Edition 3 is an example of this, shown in the image below.
Amalgamation of Melbourne and Melton SUAs
Image
Description
New Significant Urban Areas
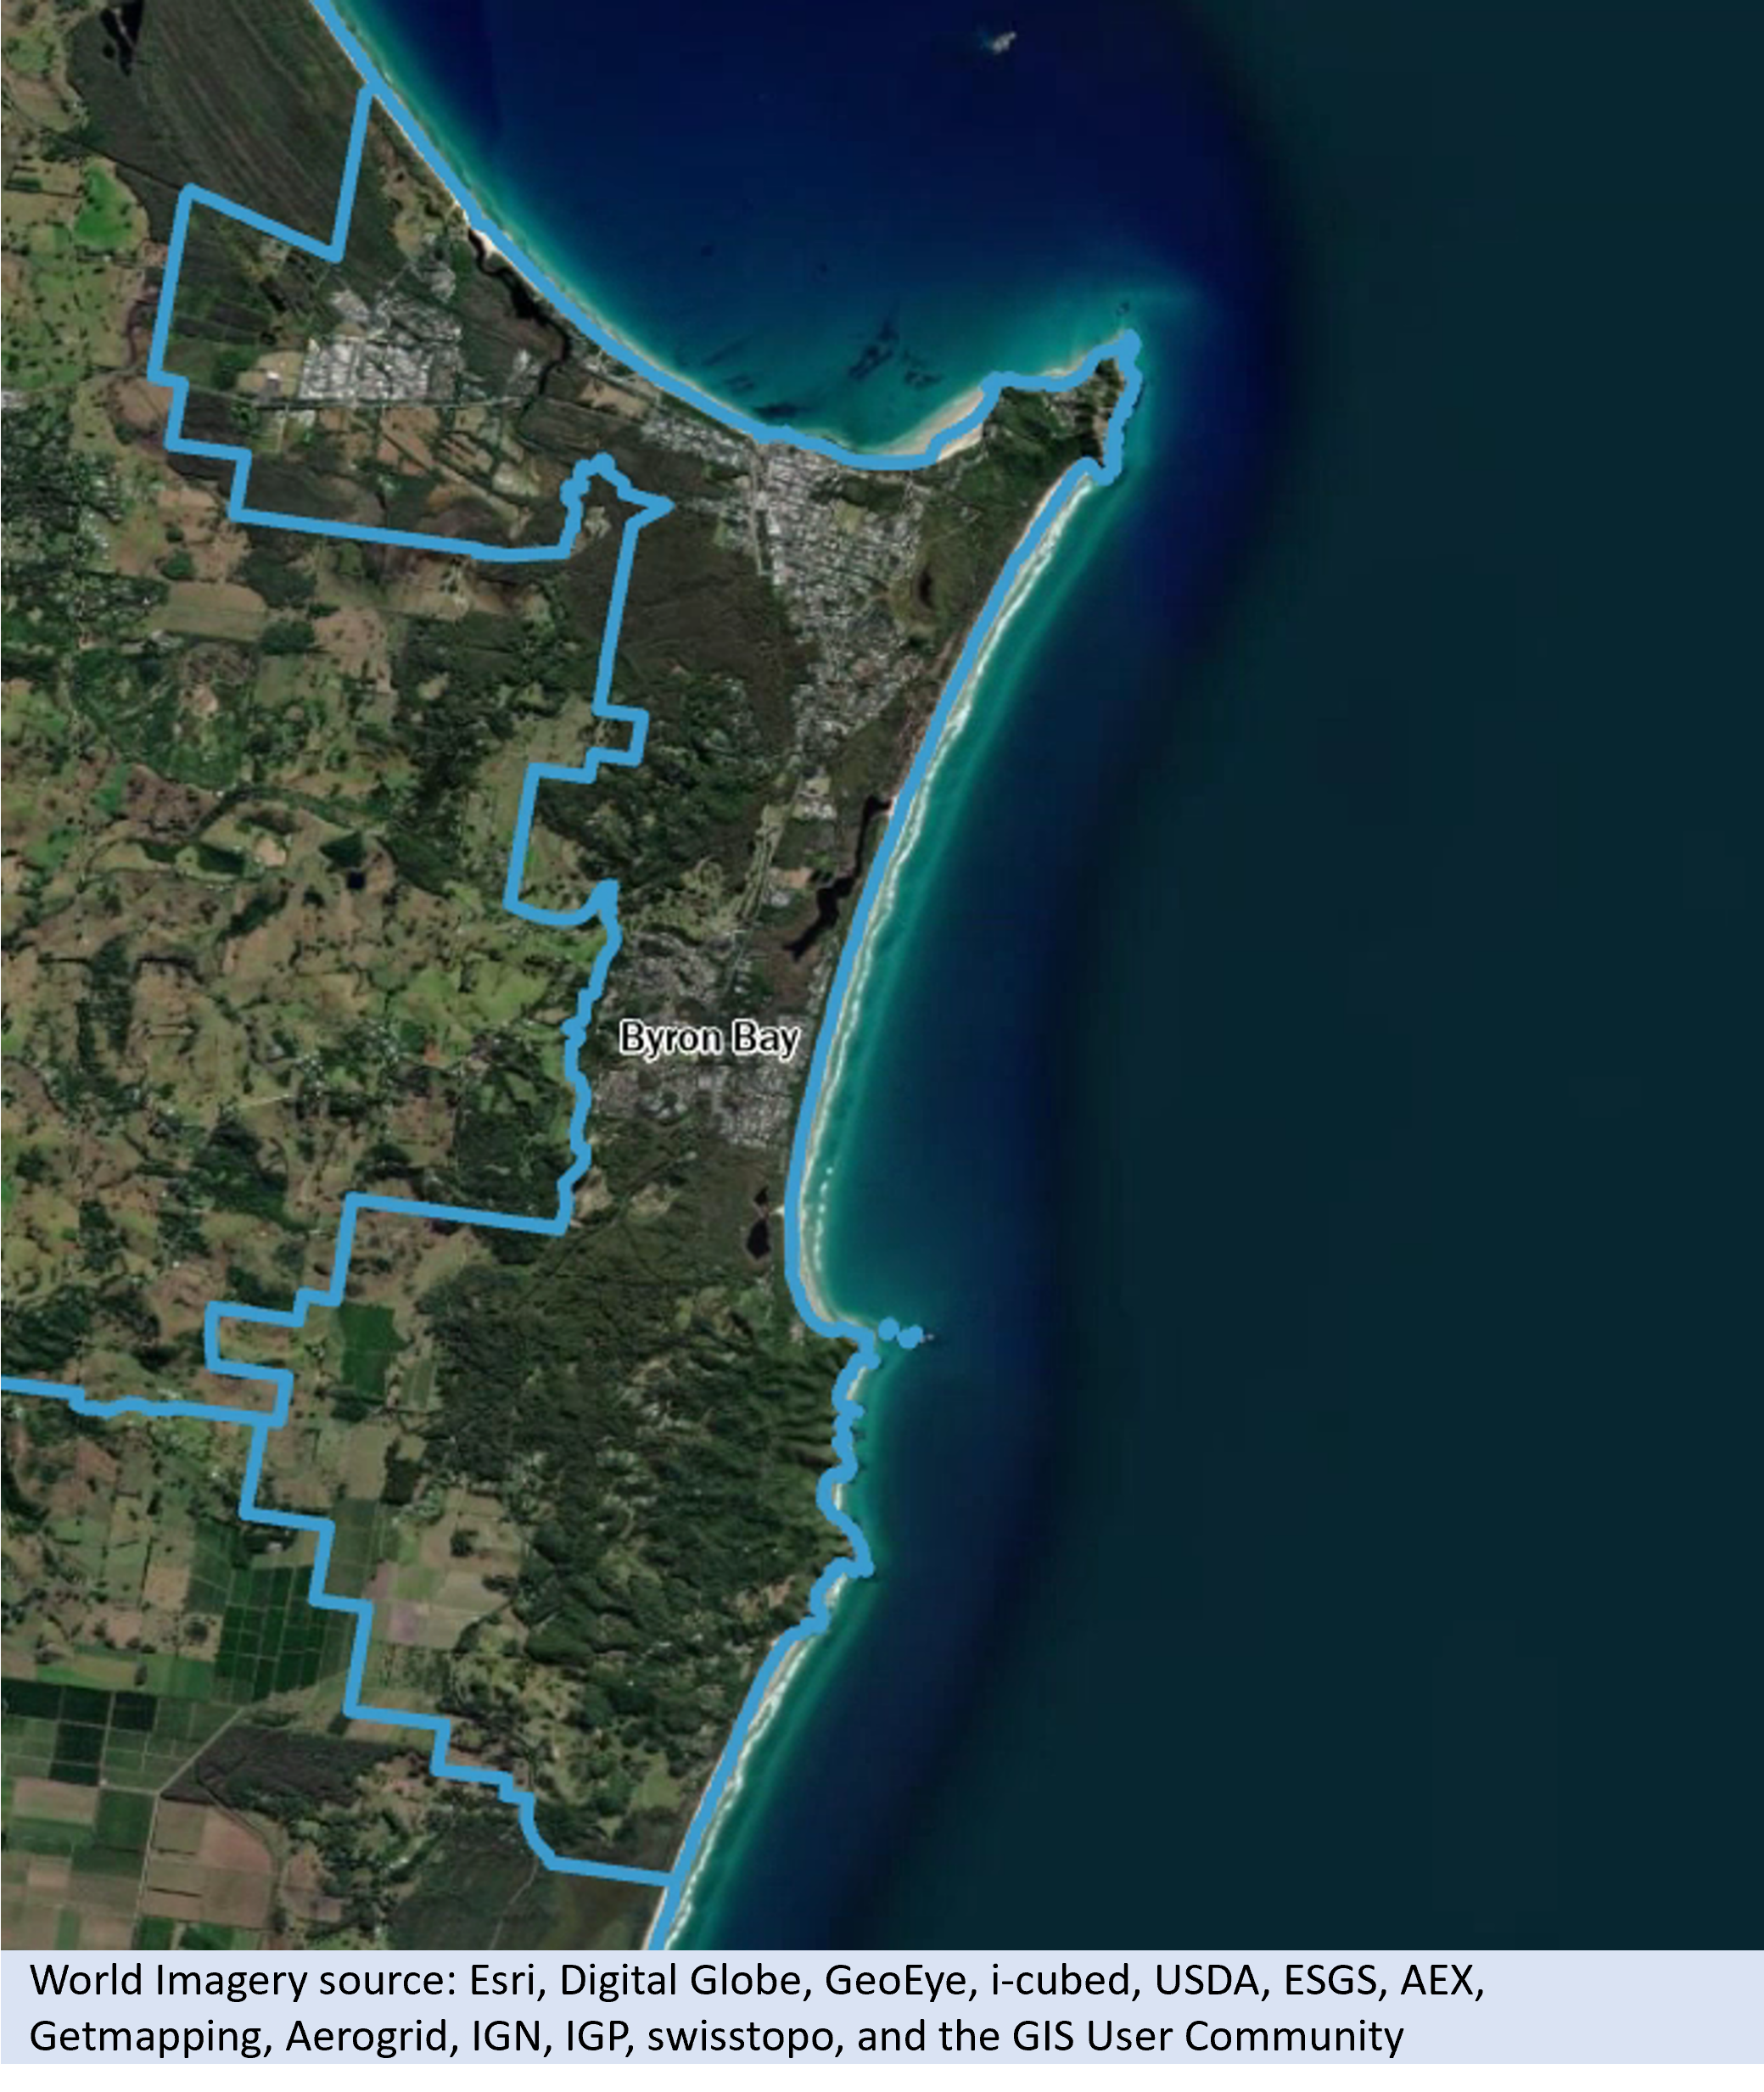
As the populations of Urban Centres grow to be 10,000 people or more, new Significant Urban Areas are created. This is one of the most common types of change in the SUA classification. In Edition 3 (2021), Byron Bay, pictured below, is an example of a new Significant Urban Area.
Byron Bay SUA in Edition 3 (2021)
Image
Description
Removed Significant Urban Areas
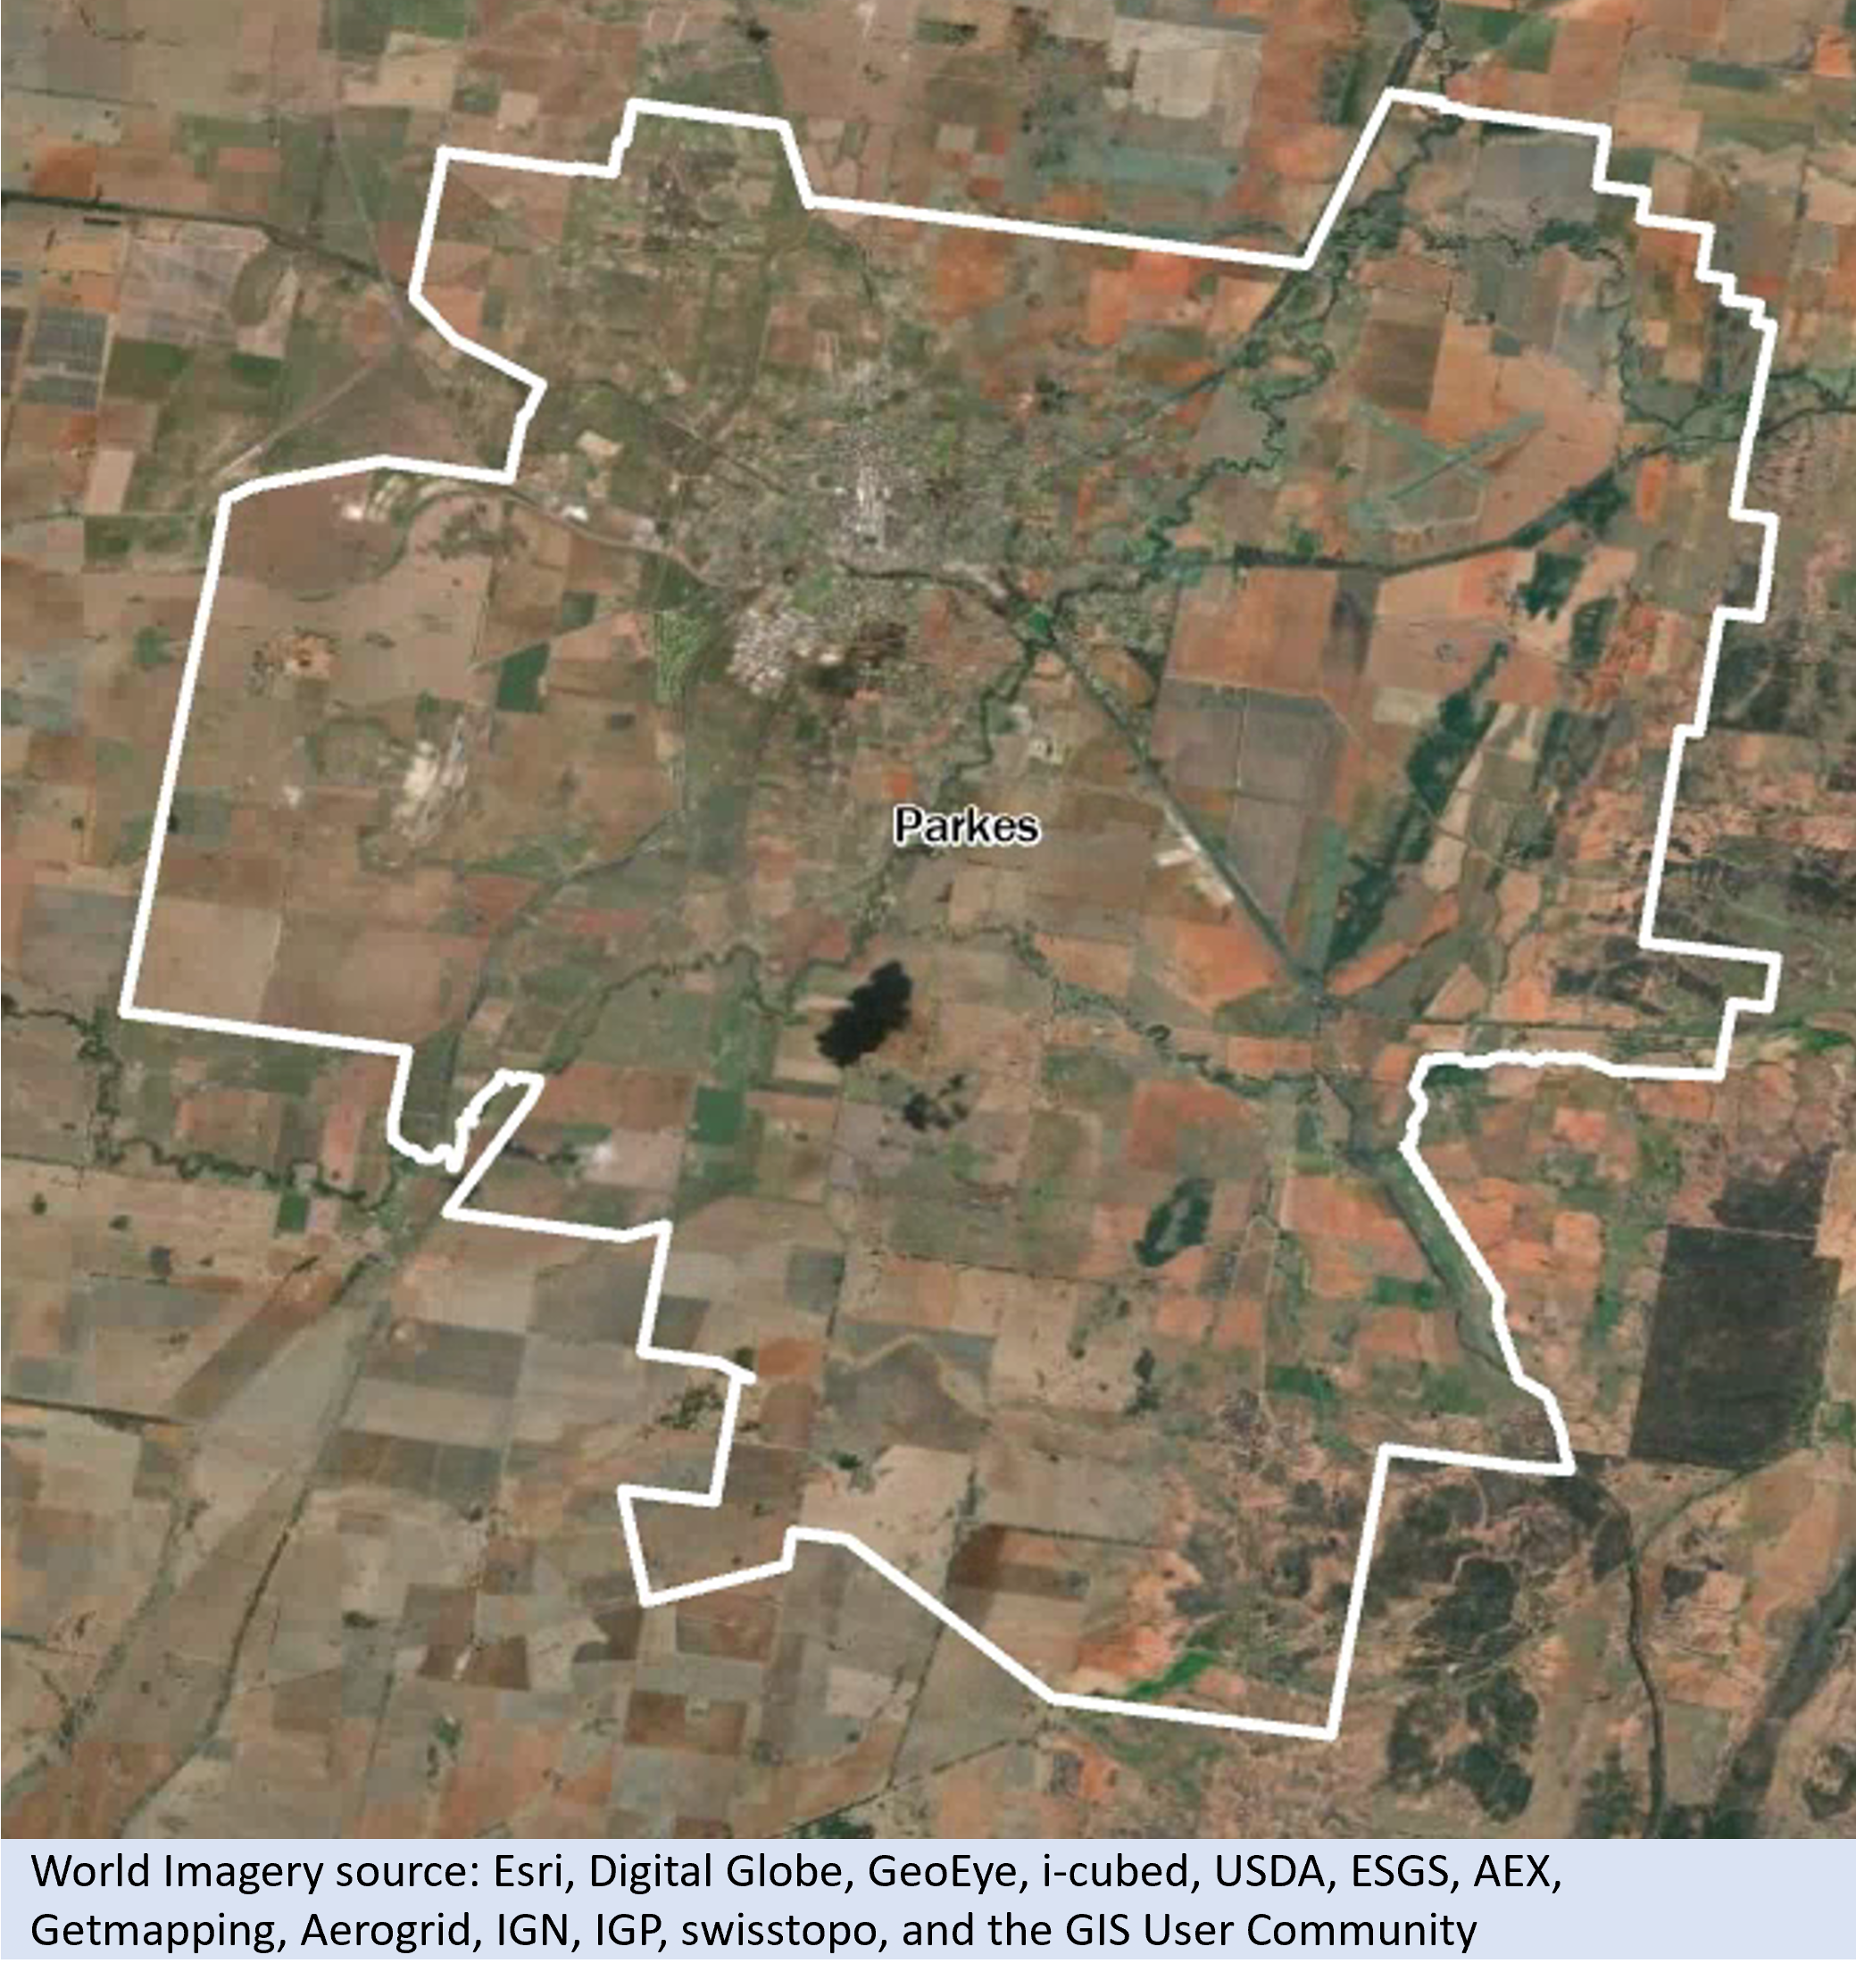
Occasionally, population decline and/or SA2 design change will result in Significant Urban Areas no longer meeting the criteria for inclusion. In these cases, the SA2s making up that Significant Urban Area are reclassified as Not in a Significant Urban Area. An example of this is shown below for Parkes in NSW.
Parkes SUA in Edition 2 (2016)
Image
Description
Understanding changes
This publication includes the SUA Edition 2 (2016) to Edition 3 (2021) association file which is available for download on the allocation files page. This helps users understand changes between ASGS Editions and facilitates statistical comparisons over multiple Censuses.
This table includes information on the area of the SUAs as well as the following types of changes:
- Amalgamated – When SUAs have been merged to form one SUA.
- Name Change – When an SUA has changed name.
- New – When an SUA is new for Edition 3.
- Removed – When an SUA no longer meets the criteria and is removed from the classification.
ABS Maps is an online mapping tool that allows users to visualise and understand differences between Australian Statistical Geography Standard (ASGS) boundaries, for example Edition 2 (2016) and Edition 3 (2021) SUAs. This can be used in conjunction with the association file to understand SUA boundaries and any changes that have occurred.