Participation, Job Search and Mobility, Australia

This is not the latest release View the latest release

Labour participation potential, underemployment and marginal attachment, job search experience, labour mobility, hours worked, industry and occupation

Reference period
February 2019
Released
8/07/2019

Key findings

Seeking more hours

12.7 million people were employed in February 2019, which is almost two-thirds of the civilian population aged 15 and over (20.1 million). Of these, around 1.1 million people (9% of employed) were underemployed, almost all of whom usually work part time (1.0 million). Underemployment has been reasonably stable in the past few years (1.0 million people in February 2015), but has grown over the past decade (from 0.5 million people in February 2008).

45.9% of underemployed part-time workers in February 2019 had been underemployed a year or more. If a suitable job was offered, 16.8% would be prepared to move interstate, and 22.6% would be prepared to move intrastate.

Just under half (49.6%) of underemployed part-time workers took active steps to look for additional hours.

More information about underemployment and preference for more hours for 2015 to 2019 can be found in Tables 2-7 in the Data downloads section.

Job mobility

8.5% (1.1 million) of employed persons changed employers or businesses in the twelve months up to February 2019. This continues a trend of increasing job churn compared with the past few years, with 7.9% (0.9 million) changing employers or businesses in the year to February 2015. The recent increase is driven largely by an increase in mobility for professionals. Overall levels of job churn are still relatively low compared to a decade ago (over 1.2 million persons changed job in the 12 months ending February 2008).

More information about labour mobility for 2015 to 2019 can be found in Tables 17-20 in the Data downloads section.

Seeking a job

Of the 677,000 unemployed persons in February 2019, 87.8% reported having difficulty finding work.

Reasons for difficulty finding work have changed somewhat in recent years, with an increase since February 2015 in personal factors such as “Insufficient work experience” and “Own ill health or disability”, and a decrease in job related factors such as “Too many applicants” and “No vacancies at all”.

More information about job search experience of unemployed persons for 2015 to 2019 can be found in Tables 12-16 in the Data downloads section.

Potential to join the labour force

Of the 6.7 million persons not in the labour force (NILF) at February 2019, 1.1 million (15.7%) were marginally attached, as they wanted to work, and were either available to start work, or had actively looked for work. Persons marginally attached have decreased from 17.1% of NILF at February 2015, following a similar downward trend as unemployed persons in the same period.

The top level is the civilian population aged 15+ years at 20,118,000. This divides into employed persons with 12,740,000; and not employed persons with 7,377,000. Not employed persons divides into two: wanted to work, including people who ‘might want to work’ with 1,980,000; and people who did not want to work, including people who are permanently unable to work and those who ‘did not know’ with 5,397,000. Wanted to work divides into three: had a job to go to, referring to people who had a job to go to,
The top level is the civilian population aged 15+ years at 20,118,000. This divides into employed persons with 12,740,000; and not employed persons with 7,377,000. Not employed persons divides into two: wanted to work, including people who ‘might want to work’ with 1,980,000; and people who did not want to work, including people who are permanently unable to work and those who ‘did not know’ with 5,397,000. Wanted to work divides into three: had a job to go to, referring to people who had a job to go to, but were not available to start in the reference week with 120,000; actively looked for work with 752,000; and did not actively look for work with 1,108,000. Actively looked for work divides into three: unemployed persons, including people who had a job to go to and could have started in the reference week – ‘Future starters’, with 677,000; available to start within four weeks, referring to people who were not available to start in the reference week, with 58,000; and not available to start within four weeks with 17,000. Did not actively look for work divides into two: available to start within four weeks with 860,000; and not available to start within four weeks with 248,000. Available to start within four weeks divides into two: discouraged job seeker with 90,000 and other reasons with 770,000. The total of employed persons at 12,740,000 and unemployed persons, including people who had a job to go to and could have started in the reference week – ‘Future starters’, at 677,000 is the labour force at 13,417,000. The total of had a job to go to, referring to people who had a job to go to, but were not available to start in the reference week at 120,000, available to start within four weeks, referring to people who were not available to start in the reference week, at 58,000, not available to start within four weeks with 17,000, discouraged job seeker with 90,000, and other reasons with 770,000 is people marginally attached to the labour force at 1,055,000. The total of not available to start within four weeks at 248,000, and people who did not want to work, including people who are permanently unable to work and those who ‘did not know’ at 5,397,000, is people without marginal attachment to the labour force at 5,645,000.
  1. Includes people who 'Might want to work'
  2. Includes people who had a job to go to and could have started in the reference week - 'Future starters'.
  3. Refers to people who had a job to go to, but were not available to start in the reference week.
  4. Refers to people who were not available to start in the reference week.
  5. Includes people who are permanently unable to work and those who 'Did not know'.
     

Another 5.6 million persons are not in the labour force and not marginally attached. They either:

  • did not want to work (4.8 million or 72.2% of NILF),
  • permanently unable to work (560,000 or 8.4%), or
  • wanted to work but were neither actively looking nor available to start within four weeks (250,000 or 3.7%).


The increase of those who did not want to work, up from 4.5 million (69.6% of NILF) in February 2015, is almost entirely driven by retirees.

More information about participation potential and marginal attachment for 2015 to 2019 can be found in Table 1 and Tables 8-11 in the Data downloads section.

Further information

For more information on these on any other labour statistics, contact the ABS Labour Statistics branch via labour.statistics@abs.gov.au.
Understanding labour supply

Understanding potential labour supply

The Participation, Job Search and Mobility Survey (PJSM) is a yearly supplement to the monthly Labour Force Survey (LFS). It asks additional questions from respondents regarding their participation in the labour market, and looks into the factors behind why people were counted as employed, underemployed, and unemployed or not participating in the labour force.

The survey focusses on people who are classified as unemployed and underemployed, or those who were close to being classified in those groups, as these people make up the available labour market supply to meet the labour market demand of businesses looking for workers.

In the broadest sense, the total supply of workers in Australia are those who were at least 15 years old. This article explores the different groups of potential labour supply, to provide different insights into spare capacity within the labour market.

Working and not working

Casting the net as wide as possible, the total potential supply of workers in Australia are those who were at least 15 years old and did not have a job. 7.09 million people were not working in February 2019, which is 35.3% of the population.

Of those who indicated that they had a job, 126,000 people did not work in a paid job but were instead occupied in unpaid activities as volunteers or trainees. A further 158,000 were attached to a job, but they had either just accepted a job offer and had not yet started working, or they were on leave from their jobs without pay and would return at a later date in the future. These people are not classified as employed but are part of the available supply and could have been working in an alternative paid job during February. This brings the total supply of people “not working in a paid job” to 7.38 million, or 36.7% of the population.

Of those who were in paid work, 4.18 million usually work part-time hours, or 20.8% of the population. These people are also potentially part of the available supply if working less than full-time hours was assumed to indicate that someone is not fully utilised.

This brings the total hypothetical pool of people with potential labour supply to 11.36 million people, or 56.5% of the population. Of course, not everyone over 15 wants to work full-time each and every week. This brings us to the first condition to be classified as part of the labour supply – only including those who want to work.

Working

Total working in a paid job – 12.74 million (63.3%)

  • Usually works full-time – 8.56 million (42.5%)
  • Worked full-time but usually works part-time – 197,000 (1.0%)
  • Worked and usually works part-time (more than 1 hour) – 3.97 million (19.8%)
  • Worked and usually works 1 hour or less – 11,000 (0.1%)
     

Not working

Total not working in a paid job – 7.38 million (36.7%)

  • About to start work, or away from work without pay – 158,000 (0.8%)
  • Unpaid volunteers and trainees – 126,000 (0.6%)
  • Not working – 7.09 million (35.3%)
     

Wanting to work or wanting more hours

In February 2019, 1.98 million (9.8% of the population) wanted to work and were not currently working in a paid job. Of the remaining people who were not working, 56,000 were unable to work, but most simply did not want to work (4.84 million, or 24.0% of the population).

The main reason people did not want to work is because they were retired. 54.2% of those who did not want to work were retirees (2.62 million). Other people did not have time to work, such as students who were attending an educational institution (12.0%), those who were busy caring for children (4.2%) and those who had other duties around the home (12.1%). 7.0% had ill health or a disability that meant they were not seeking work. None of these people are included in the potential labour supply.

Based solely on people’s desire to work, 13.4% of the labour market were seeking employment (1.98 million wanting work as a proportion of the 14.72 million workers and potential workers).

Further to this, of those who usually work part-time hours, 1.14 million wanted to work more hours. These people were fairly evenly split between 54% wanting to work full-time and 46% just wanting more part-time hours. There are even some full-time workers who wanted to work more. 560,000 who usually worked full-time wanted to work even more hours.

The total number of workers who wanted more hours in February 2019 was 1.7 million (8.5% of the population). Based solely on this, the proportion of the labour market who wanted more hours was 11.6%.

Adding these two proportions together (13.4% and 11.6%), makes the total potential supply of underutilised workers 25.0% - a quarter of all workers and potential workers.

Why aren’t the headline figures this high? This brings us to the second important condition of labour supply – only counting those who were available to work.

Wanting work

Total wanting work – 3.68 million (18.3%)

  • Works full-time and wants more hours – 560,000 (2.8%)
  • Works part-time and wants more hours – 1.14 million (5.7%)
  • Not employed and wants to work – 1.98 million (9.8%)
     

Does not want to work – 4.84 million (24.0%)

Unable to work – 560,000 (2.8%)

Main activity of people who do not want to work

  • Retired – 2.62 million (54.2%)
  • Home duties – 586,000 (12.1%)
  • Attending educational institution – 580,000 (12.0%)
  • Ill health or disability – 341,000 (7.0%)
  • Caring for children – 204,000 (4.2%)
     

Available to work

    Not everyone who wants to work is available to work, and this therefore limits their ability to supply their labour. Of the 1.98 million people who wanted to work, 1.27 million were available to start working straight away, while 420,000 would be available in the next 4 weeks. The remaining 289,000 wanted to work, but were not available within 4 weeks.

    There were many reasons why people are not available to work. The main reason was because they were busy caring for children (24.2%). Other reasons included studying or returning to studies (18.5%), a long term health condition or disability (17.9%) or caring for an elderly person or relative (7.7%). Similarly to those who do not want to work, these people who are unavailable to work are not included in the available labour supply.

    Based on these two conditions of wanting and being available to work straight away, the proportion of available workers who were seeking work would be 9.1%.

    Similarly, there were fewer workers who were both wanting and available to work more hours. Of the part-time workers, 1.07 million were available to work more hours, and 534,000 full-time workers were available for more hours.

    This brings the total to 1.6 million workers who were available and wanted to work more hours, or 11.4% of all available workers. Combing these ratios results in a figure of 20.5% of the population that was willing and available to work.

    Again, these numbers are higher than the headline underemployment and underutilisation rates. There is a third and final important condition for labour supply – only counting those who were actively looking for work.

    Wanting and available to work

    Total available workers who wanted work – 2.87 million (14.3%)

    • Works full-time and available for more hours – 534,000 (2.7%)
    • Works part-time and available for more hours – 1.07 million (5.3%)
    • Wants to work and available – 1.27 million (6.3%)
       

    Wants to work and available in 4 weeks – 420,000 (2.1%)

    Wants to work but not available – 289,000 (1.4%)

    Main reasons people are not available to work in 4 weeks

    • Caring for children – 70,000 (24.2%)
    • Studying, or returning to studies – 54,000 (18.5%)
    • Own long-term health condition or disability – 52,000 (17.9%)
    • Caring for ill or elderly person/relative – 22,000 (7.7%)
    • Own short-term health condition or injury – 21,000 (7.2%)
    • Pregnancy – 12,000 (4.2%)
       

    Actively looking for work

    Businesses looking for workers can only find job seekers when they actively make contact, either through applying for vacant positions, making phone calls, registering with an employment agency, or a number of other active steps. Therefore, in order to be part of the potential labour supply to be utilised in the Australian economy, a person must be actively looking for a job. Passively looking for work may be a precursor to someone looking for work, but it is the active steps taken to find work that will lead to their labour supply being available to employing businesses.

    In February 2019, 640,000 were actively looking for work and were available to start immediately. Another 58,000 were actively looking and available to start within 4 weeks. 860,000 were wanting to work and available to start within 4 weeks, but they were not actively looking for work. 160,000 were not actively looking because they had either already accepted a job offer but had not yet started working, or they were attached to a job and away from work without pay.

    The main reasons people did not actively look for work was because they were attending an educational institution (25.3%) or caring for children (17.9%). Some people did not actively look for work due to a long-term health condition or disability (8.9%). Other people had simply given up looking for work and are classified as “discouraged job seekers.”

    There were 90,000 discouraged job seekers in February 2019, and most believed they could not find work because employers thought they were too young or too old (32%), or that there were no jobs available in their locality, their line of work, or just no jobs available at all (26%).

    When using all three conditions of wanting to work, being available to work, and actively looking for work, a measure of unemployment can be calculated at around 4.8% of the actively participating labour force.

    We can also apply the same criteria to those looking for more hours, but, given underemployed workers can get extra hours within their existing employment, it is not considered to be a reasonable limitation on underemployment. They are already meeting the requirement for being “economically active” by being employed and it would be unreasonable to expect underemployed workers to keep asking their employer for more hours every month or continuously apply for new jobs to be counted as underemployed from one month to the next.

    Available and actively looking for work

    Wants to work, available, and actively looking for work – 640,000 (3.2%)

    Total underemployed part-time workers – 1.02 million (5.1%)

    • Works part-time, available and looking for more hours – 505,000 (2.5%)
    • Works part-time, available for more hours but not looking – 514,000 (2.6%)


    Not looking, but has a job to start or return to – 160,000 (0.8%)

    Wants to work, available in 4 weeks, and actively looking for work – 58,000 (0.3%)

    Wants to work, available in 4 weeks, but not looking for work – 860,000 (4.3%)

    Main reasons not actively looking for work

    • Attending an educational institution – 218,000 (25.3%)
    • Caring for children – 154,000 (17.9%)
    • Discouraged job seekers – 90,000 (10.5%)
    • Own long-term health condition or disability – 76,000 (8.9%)
       

    Underutilisation

    The ABS uses combinations of these conditions to determine headline rates of potential labour supply and underutilisation over time, which are consistent with international standards. On the rare occasions that a standard is changed, the ABS can draw upon the wealth of information collected to revise and maintain a consistent time series.

    The headline unemployment numbers are based on those people who are not employed who met all three conditions: wanting to work, available to work and actively looking for work. It also includes people who have stopped actively looking for work because they have accepted a job offer, but have not started working yet. In February 2019, there were 677,000 unemployed people.

    The headline number of underemployed part-time workers are based on two conditions, wanting more hours and also being available to work more hours. It does not require underemployed workers to actively look for work. There were 1.02 million underemployed part-time workers in February 2019.

    The headline number of underemployed full-time workers are not based on the conditions explored so far. A full-time worker is considered underemployed if they involuntarily work part-time hours for “economic reasons”, such as not having enough work or being stood down by their employer. It does not include workers who lost hours due to illness, plant breakdowns or bad weather, as these are not considered to be economic reasons. In February 2019, there were 83,000 full-time workers who were underemployed.

    The total labour force includes everyone who is employed and unemployed. It does not include those who do not want to or were unable to work, or those who were unavailable to start work straight away, or those who were not actively looking for work. The size of the labour force in February 2019 was 13.4 million.

    Based on these classifications, the PJSM data indicates that the underutilisation rates for February 2019 were:

    • Unemployment rate = 5.0%
    • Underemployment rate = 8.2%
    • Underutilisation rate = 13.3%
       

    Note that while the labour force categories are arranged neatly in a line from “least employed” to “most employed,” the reality of labour market dynamics means that people can shift between any of these categories. A part-time worker does not need to be underemployed before becoming unemployed, they could go straight into not in the labour force after losing their job. Before they even start looking for work, they could get a full-time job and bypass unemployment and go straight into employment.

    Extended underutilisation

    Beyond the commonly cited headline measures of labour supply and underutilisation, the ABS also periodically produces an alternative set of broader measures that relax some of these conditions around unemployment and underemployment.

    An extended measure of unemployment starts with the official definition and extends the availability criteria to include those who are available to start within 4 weeks, rather than only counting those who can start immediately. It also includes discouraged job seekers, as they meet all of the criteria for unemployment except for actively looking for work. It does not include people who were not actively looking for other reasons, such as studying or caring for children. The number of people who meet the extended measure of unemployment in February 2019 was 825,000.

    The extended measure of underemployment applies the same lens to both full-time and part-time workers. Regardless of usual hours worked, a worker is underemployed if they worked less than their usual hours for economic reasons, or if they preferred and were available to work more hours.

    Using this measure, there was an extra 550,000 full-time workers who were underemployed, as they either preferred and were available to work more full-time hours, or they worked less full-time hours than usual for economic reasons. The total number of underemployed full-time workers under the extended definition was 640,000 in February 2019.

    The number of underemployed part-time workers also increased under the extended definition, including part-time workers who worked less part-time hours than usual hours for economic reasons. The total number of underemployed part-time workers was 1.17 million in February 2019 under the extended definition.

    The extended measure of the labour force combines the employed and the extended measure of unemployed. It also includes some people who would normally be counted as not in the labour force, but had a job that they were either starting in the future or one they would return to after a period of leave without pay. The size of the labour force under this extended definition was 13.7 million in February 2019.

    Using these more relaxed measures, the extended underutilisation rates in PJSM for February 2019 were:

    • Extended Unemployment rate = 6.0%
    • Extended Underemployment rate = 13.2%
    • Extended Underutilisation rate = 19.2%
       

    Updated tables of the extended rates of underutilisation by Sex, Age, and State and Territory for the period 2015 to 2019 are available in the Data downloads section.

    Further information

    For more information on these on any other labour statistics, contact the ABS Labour Statistics branch via labour.statistics@abs.gov.au.

    Impact of Townsville floods

    Show all

    Flooding in Townsville in February 2019 resulted in a major disruption to the operation of the Labour Force Survey (LFS) and the accompanying Participation, Job Search and Mobility Survey (PJSM). As a result, there was a very low sample of responding households in the region in February.

    Given the severity of these disruptions, which affected almost the entire region, and to ensure that this loss of sample did not affect data for Australia and Queensland, the ABS imputed sample for Townsville for February 2019. The imputation drew upon previous information that had been collected from people in Townsville.

    During 2018, the ABS estimated that employed persons in Townsville accounted for around 1 per cent of all employed persons in Australia, around 4 per cent of employed persons in Queensland, and around 9 per cent of employed persons in the regions in Queensland outside of Brisbane.

    It is also important to note that there were also a range of bushfires across Australia over the period that resulted in minor disruption to data collection activities. These did not result in any notable impacts to LFS or PJSM data.

    From the archives - underemployment, 1962 vs 2019

    Show all

    Six state capital cities

    The ABS has been keeping an eye on underemployment since the very earliest Labour Force Surveys in the 1960s. The following table from Chapter 29 - Employment and Unemployment (p. 1192) of the Year Book, Australia, 1967 (cat. no. 1301.0) shows measures of underemployment for the six state capital cities for the period November 1962 to November 1966.

    The term underemployed was not yet used, but the category "Lack of work" closely resembles how we measure underemployment today.

    • In November 1962, only 17.7% of the labour force in the capital cities worked part-time hours, compared to 37.4% in February 2019.
    • 1.1% of the labour force in the state capital cities were underemployed in November 1962 (5.9% of those who worked part-time hours). In February 2019, 7.9% of the labour force in the capital cities was underemployed (21.2% of those who worked part-time hours).
    • The unemployment rate of the state capital cities in November 1962 was 1.6%. Combined with the 1.1% underemployment rate, underutilisation was 2.7% in 1962. Underutilisation of the capital cities in February 2019 was 13.0% (with a 5.1% unemployment rate).
       

    Table 1 - Employed civilians who worked less than 35 hours a week, by reason - November 1962 to 1966 six Australian state capital cities

    November⁠—Reason for working less than 35 hours a week
    Persons who usually work 35 hours or more a weekPersons who usually work less than 35 hours a weekAll persons who worked less than 35 hours in the survey period
    Lack of work (a)Other reasons (b)TotalLack of work (c)Other reasons (d)TotalLack of work (a)(c)Other reasons (b)(d)Total
    Number ('000)—
    1962 (e)14.7228.3243.012.2197.4209.626.9425.7452.6
    1963 (e)12.4229.9242.27.6213.1220.720.0443.0463.0
    1964 (e)10.7226.5237.27.3230.5237.818.0457.0475.0
    1965 (e)17.2238.8256.07.8258.1265.825.0496.8521.8
    1966 (f)17.5239.0256.56.5279.0285.524.0518.0542.0
    Proportion of the civilian work force of the six capitals (per cent)—
    1962 (e)0.68.99.50.57.78.21.116.617.7
    1963 (e)0.58.89.30.38.28.50.817.017.8
    1964 (e)0.48.58.90.38.68.90.717.117.8
    1965 (e)0.68.69.20.39.39.60.917.918.8
    1966 (f)0.68.38.90.29.79.90.818.118.9

    a. Excludes persons laid off for whole week without pay, who are included in the unemployed. The figures comprise persons working short time, those who lost their jobs or commenced in new jobs during the specified week, and those absent from work because of plant breakdowns or bad weather.
    b. Own illness or injury, leave or holiday, and industrial disputes.
    c. Persons who would prefer to work 35 hours or more a week if suitable work were available.
    d. Persons who prefer to work less than 35 hours a week.
    e. Persons aged 14 years and over.
    f. Persons aged 15 years and over.
     

    Table 2 - Employed persons (f) who worked less than 35 hours a week, by reason - February 2015 to 2019 six Australian state capital cities

    February—Reason for working less than 35 hours a week
    Persons who usually work 35 hours or more a weekPersons who usually work less than 35 hours a weekAll persons who worked less than 35 hours in the survey period
    Lack of work (a)Under- employed (a')Other reasons (b')TotalLack of work (c)Under- employed (c')Other reasons (d')TotalLack of work (a)(c)Under- employed (a')(c')Other reasons (b')(d')Total
    Number ('000)—
    201559.043.9667.4711.3651.1602.21,718.02,320.2710.1646.12,385.43,031.4
    201670.651.0652.4703.3682.2636.91,775.12,412.0752.8687.82,427.53,115.3
    201777.854.0716.9771.0699.6658.61,804.52,463.1777.4712.62.521.53,234.1
    201877.056.4714.1770.5717.6666.81,874.32,541.1794.5723.22,588.43,311.6
    201977.857.6722.8780.3710.6657.41,929.82,587.2788.4715.02,652.53,367.5
    Proportion of the labour force of the six capitals (per cent)—
    20150.70.58.28.78.07.421.028.48.77.929.237.1
    20160.80.67.88.48.17.621.228.89.08.229.037.2
    20170.90.68.49.08.27.721.228.99.18.429.637.9
    20180.90.68.18.88.27.621.328.99.08.229.437.7
    20190.90.68.08.77.97.321.428.88.87.929.537.4

    a. The figures comprise persons working short time, those who lost their jobs or commenced in new jobs during the specified week, and those absent from work because of plant breakdowns or bad weather. These are included for comparison with the 'Lack of Work' figures from 1962-66.
    a'. Worked less than 35 hours for economic reasons (stood down, no work or not enough work available). These are the underemployed figures for full-time workers.
    b'. Worked less than 35 hours for non-economic reasons (own illness or injury, leave or holiday, and industrial disputes, etc).
    c. Persons who would prefer to work 35 hours or more a week if suitable work were available. These are included for comparison with the 'Lack of Work' figures from 1962-66.
    c'. Persons who would prefer and were available to work 35 hours or more a week if suitable work were available. These are the underemployed figures for part-time workers.
    d'. Persons who prefer to work less than 35 hours a week or were unavailable to work more hours.
    f. Persons aged 15 years and over.
     

    Further information

    For more information on these on any other labour statistics, contact the ABS Labour Statistics branch via labour.statistics@abs.gov.au.

    From the archives - underemployment, 1985 vs 2019

    Show all

    The first underemployed workers survey

    In May 1985, the ABS ran its first survey dedicated to exploring the conditions of underemployment - the Underemployed Workers Survey (UEW). This article presents excerpts from the Summary of Findings of the first publication (cat. no. 6265.0), published on 6th March 1986. A digitised copy of the publication is available here.

    The summary data presented is also compared against the latest data from the 2019 Participation, Job Search and Mobility (PJSM) Survey.

    Summary of findings

    May 1985 - summary of findings

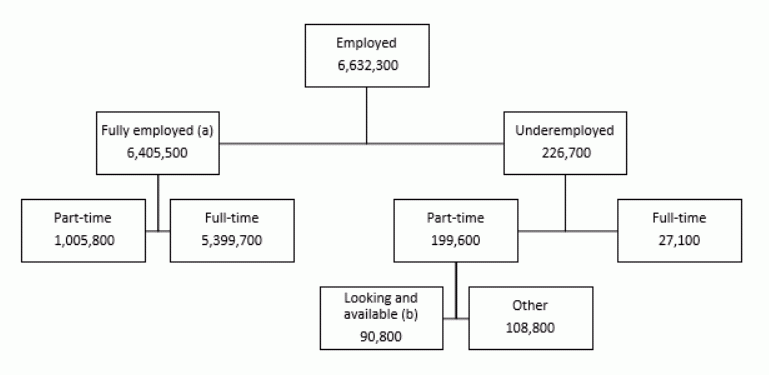
    In May 1985 there were 6,632,300 employed persons aged 15 and over (55.6 per cent of the civilian population in this age group). Of these, most were fully employed (96.6 per cent) and 3.4 per cent (226,700) were underemployed.

    199,600 (88.0 per cent) of these underemployed workers were part-time workers who indicated that they would prefer to work more hours. The remaining 27,100 persons were full-time workers who did not work full-time hours in the reference week due to economic reasons.

    22.9 per cent of part-time employed males were underemployed, compared with 14.9 per cent of part-time employed females. For both males and females, 0.5 per cent of full-time employed workers were underemployed.

    Diagram 1. Employed persons - relationship of underemployed workers to fully employed workers, May 1985

    Diagram 1. Employed persons - relationship of underemployed workers to fully employed workers, May 1985
    This image is a flow chart that outlines the relationship of underemployed workers to fully employed workers in May 1985. The flow chart has four levels. The first level is employed at 6,632,300. This flows down to fully employed with 6,405,500 and underemployed with 226,700. For the definition of fully employed, see explanatory notes paragraph 8. Fully employed then flows to part-time with 1,005,800, and full-time with 5,399,700. Underemployed flows to full-time with 27,100 and part-time with 199,600. Part-time then flows to looking for available, that is, underemployed part-time workers who had been looking for work with more hours at some time in the four weeks up to the end of the survey week and were available to start such work within four weeks, with 90,800, and finally, other with 108,800
    1. For the definition of fully employed. See Explanatory Notes paragraph 8 on the Methodology page (excerpt below).
    2. Underemployed part-time workers who had been looking for work with more hours at some time in the four weeks up to the end of the survey week and were available to start such work within four weeks.

    (Source of data: Table 2, May 1985)

    NOTE: Fully employed workers are defined as those persons who are voluntarily working part-time, or who worked full-time hours in the reference week, or who are full-time workers who did not work full-time hours in the reference week for non-economic reasons. It should be noted that persons who are normally underemployed but who worked full-time hours in the reference week are classified as fully employed.

    Today, under the current definition, fully employed workers also include part-time workers who prefer more hours, but were unavailable to work any extra hours. These are not included in the data from 1985 and are instead included amongst the underemployed, unless otherwise noted.

    Feb 2019 - summary of findings

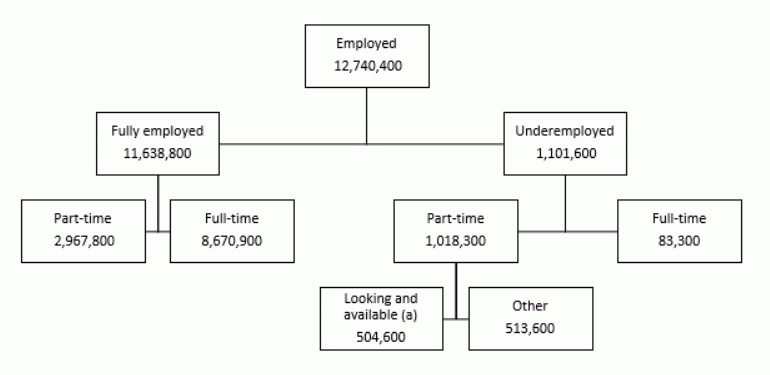
    In February 2019, there were 12.7 million employed persons. This was 63.3% of the population, up from 55.6% in 1985. Of these:

    • 91.4% were fully employed, down from 96.6% in 1985
    • 8.6% (1.1 million) were underemployed, up from 3.4% in 1985
       

    92.4% of the underemployed were part-time workers who preferred and were available to work more hours, up from 88.0% in 1985.

    • 31.4% of part-time males were underemployed, up from 22.9% in 1985
    • 22.9% of part-time females were underemployed, up from 14.9% in 1985
       

    The remaining underemployed (7.6%) were full-time workers who involuntarily worked part-time hours because they was not enough work or were stood down by their employer.

    • 1.1% of full-time males were underemployed, up from 0.5% in 1985
    • 0.7% of full-time females were underemployed, up from 0.5%
       

    Diagram 1b. Underemployed vs. fully employed, Feb 2019

    Diagram 1b. Underemployed vs. fully employed, Feb 2019
    This image is a flow chart that outlines the relationship of underemployed workers vs fully employed workers in February 2019. The flow chart has four levels. The first level is employed at 12,740,400. This flows down to fully employed with 11,638,800 and underemployed with 1,101,600. Fully employed then flows to part-time with 2,967,800, and full-time with 8,670,900. Underemployed flows to full-time with 83,300 and part-time with 1,018,300. Part-time then flows to looking for available, that is, underemployed part-time workers who had been looking for work with more hours at some time in the four weeks up to the end of the survey week and were available to start such work within four weeks, with 504,600, and finally, other with 513,600.
    1. Underemployed part-time workers who had been looking for work with more hours at some time in the four weeks up to the end of the survey week and were available to start such work within four weeks.

    (Source of data: Tables 2 & 3, Feb 2019)

    Underemployed and unemployed

    May 1985 - underemployed workers and unemployed persons

    While most underemployed workers were females (66.0 per cent), most unemployed persons were males (59.5 per cent). Approximately 35 per cent of underemployed workers were aged 15 to 24, while about 45 per cent of unemployed persons were in this age group. About 25 per cent of both underemployed workers and unemployed persons were aged 25 to 34. The remaining 40 per cent of underemployed workers and 30 per cent of unemployed persons were in the older age group of 35 and over.

    116,600 or 51.4 per cent of underemployed workers were husbands or wives, of whom 75,100 had children aged 0 to 14 present, while 219,500 or 36.1 per cent of unemployed persons were husbands or wives, of whom 147,800 had children aged 0 to 14 present. 23.1 per cent of underemployed workers were children of family heads, compared with 33.3 per cent of unemployed persons.

    The underemployment and unemployment rates were 3.1 per cent and 8.4 per cent respectively, yielding an underutilisation rate of 11.5 per cent.

    Feb 2019 - underemployed and unemployed

    • The underemployment rate was 8.2% in 2019 which was higher than the 3.1% in 1985
    • The unemployment rate was 5.3% in 2019 which was lower than the 8.4% in 1985
    • The underutilisation rate was 13.5% in 2019 which was higher than the 11.5% in 1985
       

    Underemployed (1.1 million)

    • Most underemployed were female (59.0%)
       
    • 34% were aged 15 to 24
    • 21% were aged 25 to 34
    • 45% were aged 35 and over
       
    • 44.1% were husbands, wives or partners
    • 21.2% were partners with children under 15
    • 30.6% were working age children living with parents
       

    Unemployed (680,000)

    • Most unemployed were male (52.8%)
       
    • 37% were aged 15 to 24
    • 20% were aged 25 to 34
    • 43% were aged 35 and over
       
    • 33.0% were husbands, wives or partners
    • 16.5% were partners with children under 15
    • 36.5% were working age children living with parents
       

    Average duration of underemployment and unemployment

    May 1985 - average duration of current period of underemployment/unemployment

    Underemployed part-time workers who had been looking for work with more hours and were available to start such work within four weeks had, on average, been underemployed for 36.1 weeks. Underemployed full-time workers had experienced an average duration of 12.6 weeks.

    These two groups combined had an average duration of current period of underemployment of 30.7 weeks, which was lower than the average duration of current period of unemployment (50.2 weeks). The average duration of underemployment for males (31.9 weeks) was only slightly higher than that for females (29.9 weeks). However, males had experienced a much higher average duration of unemployment (57.2 weeks) than females (39.9 weeks).

    Persons with post-school qualifications had been underemployed for an average of 35.6 weeks compared with persons without post-school qualifications, who had been underemployed for an average of 28.2 weeks.

    1. Excludes underemployed part-time workers who either had not been looking for work with more hours at some time during the four weeks up to the end of survey week or were not available to start such work within four weeks.


    NOTE: Duration of current period of underemployment is the period from the time the person became underemployed to the end of the survey week. Average (mean) duration is obtained by dividing the aggregate number of weeks a group has been underemployed by the number of persons in that group. Median duration is that which divides underemployed persons into two equal groups, one comprising persons whose duration of underemployment is above the median and the other, persons whose duration is below it.

    The duration of current period of underemployment was measured differently in 1985 to 2019. In 1985, respondents were asked to recall the number of weeks they had been both working less than 35 hours and looking for more work. In 2019, respondents were asked to recall the number of weeks they had been both working less than 35 hours and wanting to work more hours.

    Feb 2019 - average duration of underemployment and unemployment

    Average duration of underemployment was 86.5 weeks in 2019, higher than the 30.7 weeks in 1985.

    • Average duration of part-time underemployment was 56 weeks higher in 2019 compared to 1985, while the average duration of full-time underemployment was just 0.6 weeks higher.
    • Average duration of underemployment rose for both males and females between 1985 and 2019. Males rose from 31.9 weeks to 77.3 weeks, and females rose from 29.9 weeks to 92.9 weeks.
    • Average duration of underemployment for those with a post-school qualification was 88.6 weeks, higher than the 35.6 weeks in 1985. For those without a post-school qualification, average duration of underemployment was 83.5 weeks, higher than the 28.2 weeks in 1985


    Average duration of unemployment was 45.9 weeks in 2019, lower than the 50.2 weeks in 1985.

    • The average duration of male unemployment fell nearly 10 weeks between 1985 and 2019, while the reverse is true for female average duration of unemployment, which rose 4 weeks over that time.
       

    Source: TableBuilder

    Feb 2019 - median duration of underemployment and unemployment

    Median duration of underemployment was 30 weeks in 2019, higher than the 12 weeks in 1985.

    • Median duration of part-time underemployment was 22 weeks higher in 2019 compared to 1985, while the median duration of full-time underemployment was just 1 week higher.
    • Median duration of underemployment rose for both males and females between 1985 and 2019. Males rose from 8 weeks to 26 weeks, and females rose from 13 weeks to 34 weeks.
    • Median duration of underemployment for those with a post-school qualification was 32 weeks, higher than the 14 weeks in 1985. For those without a post-school qualification, the median duration of underemployment was 30 weeks, higher than the 12 weeks in 1985.


    Median duration of unemployment was 10 weeks in 2019, lower than the 22 weeks in 1985.

    • The median duration of male unemployment fell 15 weeks between 1985 and 2019. Median duration of unemployment for females also fell by 8 weeks over the same period.
       

    Source: TableBuilder

    Industry

    May 1985 - industry (ASIC 83) of underemployed and fully employed workers

    Industries accounting for the most underemployed workers were Wholesale and Retail Trade (24.3 per cent), Community Services (21.4 per cent) and Recreation, Personal and Other Services (17. 7 per cent). These same three industries also had high proportions of their workers underemployed, 9.1 per cent in Recreation, Personal and Other Services and slightly over 4 per cent in both Community Services and Wholesale and Retail Trade. In the Manufacturing sector, 1.4 per cent of workers were underemployed, representing 7.2 per cent of all underemployed persons.

    1. Comprises Mining; Electricity, Gas and Water: and Public Administration and Defence.

    Feb 2019 - industry (ASIC 83)

    Industries with the most underemployed workers:

    • Recreation, Personal and Other Services (28.7%), which is up from 24.3% in 1985
    • Community Services (23.9%), which is up from 21.4% in 1985
    • Wholesale and Retail Trade (22.6%), which is down from 24.3% in 1985
       

    Industries with the highest proportion of underemployment:

    • Recreation, Personal and Other Services (17.6%), which is up from 9.1% in 1985
    • Wholesale and Retail Trade (12.8%), which is up from 4.2% in 1985
    • Community Services (8.6%), which is up from 4.3% in 1985
       

    3.0% of all underemployed workers were in Manufacturing, which is down from 7.2% in 1985.

    3.8% of workers in Manufacturing were underemployed, which is up from 1.4% in 1985.

    1. Comprises Mining; Electricity, Gas and Water: and Public Administration and Defence.

    Source: TableBuilder using ASIC 83 to ANZIC 06 concordance

    1. Comprises Mining; Electricity, Gas and Water: and Public Administration and Defence.

    Source: TableBuilder using ASIC 83 to ANZIC 06 concordance

    Feb 2019 - industry (ANZSIC 06)

    Industries with the most underemployed workers:

    • Retail Trade (20.7%), up from 17.2% in 1985
    • Accommodation and Food Services (15.8%), up from 12.6% in 1985
    • Health Care and Social Assistance (13.8%), up from 9.4% in 1985
       

    Industries with the highest proportion of underemployment:

    • Accommodation and Food Services (19.2%), up from 8.7% in 1985
    • Retail Trade (17.4.%), up from 5.5% in 1985
    • Arts and Recreation Services (16.3%), up from 7.5% in 1985
       

    2.9% of all underemployed workers were in Manufacturing, down from 6.8% in 1985.

    3.8% of workers in Manufacturing were underemployed, up from 1.4% in 1985.

    1. Comprises Mining; Electricity, Gas, Water and Waste Services; Wholesale Trade; Information Media and Telecommunications; Financial and Insurance Services; Rental, Hiring and Real Estate Services; and Other Services.

    Source: TableBuilder

    1. Comprises Mining; Electricity, Gas, Water and Waste Services; Wholesale Trade; Information Media and Telecommunications; Financial and Insurance Services; Rental, Hiring and Real Estate Services; and Other Services.

    Source: TableBuilder

    Usual hours and extra hours wanted

    May 1985 - usual number of hours worked and preferred number of extra hours

    Of those underemployed part-time workers who had been looking for work with more hours and were available to start such work within four weeks, 35,500 (39.1 per cent) usually worked from 1 to 10 hours, 34,400 (37.9 percent) usually worked from 11 to 20 hours and the remaining 21,000 (23.1 per cent) usually worked from 21 to 34 hours.

    Of those who usually worked from 1 to 10 hours, 43.7 per cent reported that they would prefer to work 30 or more extra hours, while only 11.8 per cent preferred less than 10 extra hours.

    55.8 per cent of those persons who usually worked from 11 to 20 hours would like to work 20 to 29 extra hours, while a further 29.9 per cent of these persons would like to work 10 to 19 extra hours.

    The majority of persons who usually worked from 21 to 34 hours reported that they would prefer 10 to 19 extra hours (72.4 per cent), while a further 23.8 per cent preferred less than 10 extra hours.

    Underemployed part-time workers who had been looking for work with more hours and were available to start such work within four weeks reported that they would prefer to work an average of 20 extra hours. The total quantum of underemployment for these persons was 1,785,500 hours per week.

    Graph 3. Underemployed part-time workers who had been looking for work with more hours(a) and were available to start such work within four weeks - usual number of hours worked and preferred number of extra hours, May 1985

    1. At some time during the four weeks up to the end of survey week.
    1. At some time during the four weeks up to the end of survey week.
    1. At some time during the four weeks up to the end of survey week.


    NOTE: Quantum of underemployment is the sum of the preferred number of extra hours reported. It measures the number of potential hours of work lost due to underemployment.

    It is known today as a Volume measure of underemployment.

    Feb 2019 - usual hours and extra hours wanted

    The average number of extra hours that part-time underemployed workers were looking for was 15 more hours per week (median of 13 hours). This is less than the average of 20 extra hours sought in 1985.

    The total volume of additional hours preferred was 7,503,000 hours per week.

    In 2019, the usual hours of part-time workers looking for more work were greater than in 1985:

    • 29.0% usually worked 10 or fewer hours, less than the 39.1% in 1985
    • 37.8% usually worked from 11 to 20 hours, about the same as in 1985
    • 33.3% usually worked from 21 to 34 hours, more than the 23.1% in 1985
       

    Of those who usually worked 10 or fewer hours:

    • 26.3% wanted an extra 30 or more hours, less than the 43.7% in 1985
    • 21.5% wanted less than 10 extra hours, more than the 11.8% in 1985


    Of those who usually worked from 11 to 20 hours:

    • 37.6% wanted an extra 20 to 29 hours, less than the 55.8% in 1985
    • 37.1% wanted an extra 10 to 19 hours, more than the 29.9% in 1985
       

    Of those who usually worked from 21 to 34 hours:

    • 58.4% wanted an extra 10 to 19 hours, less than the 72.4% in 1985
    • 39.7% wanted less than 10 extra hours, more than the 23.8% in 1985.
       

    Source: TableBuilder

    Preferred hours

    ​​​​​​​May 1985 - preferred total number of hours

    25,200 (27.8 per cent) underemployed part-time workers who had been looking for work with more hours and were available to start such work within four weeks reported that they would prefer to work more part-time hours. This comprised 19,100 who would like to work a total of less than 30 hours and 6,100 who would like to work from 30 to 34 hours.

    The remaining 65,600 (72.2 per cent) persons would prefer to work full-time hours, comprising 23,800 persons who would like to work a total of from 35 to 39 hours and 41,800 persons who would like to work 40 hours or over.

    Feb 2019 - preferred hours

    42.6% of part-time workers looking for more work preferred to work more part-time hours, more than the 27.8% in 1985:

    • 65.9% preferred less than 30 hours, less than the 76% in 1985
    • 34.1% preferred 30 to 34 hours, more than the 24% in 1985


    57.4% preferred to work full-time, less than the 72.2% in 1985:

    • 53.5% preferred to work 35 to 39 hours, more than the 38% in 1985
    • 46.5% preferred to work 40 hours or more, less than the 62% in 1985
       

    Underemployment publications, 1966 to 1995

      The publication Underemployed Workers, Australia (cat. no. 6265.0) has digitised back issues dating back to September 1996, which can be found here.

      The remaining issues from before 1996 have now been digitised and were recently made available on the ABS website.

      Further information

      For more information on these on any other labour statistics, contact the ABS Labour Statistics branch via labour.statistics@abs.gov.au.

      Survey material

      Questionnaire: Participation, job search and mobility survey, 2019

      Data downloads

      Table 1: Discouraged job seekers and other marginally attached persons, 2015-2019

      Table 2: Underemployed status of full-time and part-time workers, 2015-2019

      Table 3: Part-time workers who would prefer more hours, 2015-2019

      Table 4: Characteristics of part-time workers who would prefer more hours

      Table 4 (historical): Characteristics of part-time workers who would prefer more hours

      Table 5: Duration of insufficient hours of underemployed part-time workers

      Table 5 (historical): Duration of insufficient hours of underemployed part-time workers

      Table 6: Number of extra hours preferred by underemployed part-time workers

      Table 6 (historical): Number of extra hours preferred by underemployed part-time workers

      Table 7: Main difficulty in finding more work of underemployed part-time workers

      Table 7 (historical): Main difficulty in finding more work of underemployed part-time workers

      Table 8: Characteristics of discouraged job seekers and other potential workers

      Table 8 (historical): Characteristics of discouraged job seekers and other potential workers

      Table 9: Time since last job and main activity of discouraged job seekers and other potential workers

      Table 9 (historical): Time since last job and main activity of discouraged job seekers and other potential workers

      Table 10: Retrenchments and other reasons for ceasing a job in the last year

      Table 10 (historical): Retrenchments and other reasons for ceasing a job in the last year

      Table 11: Main reason for not actively looking for work of persons who wanted to work and were available to start

      Table 11 (historical): Main reason for not actively looking for work of persons who wanted to work and were available to start

      Table 12: Job search experience of unemployed persons, 2015-2019

      Table 13: Characteristics of successful and unsuccessful job search experience

      Table 13 (historical): Characteristics of successful and unsuccessful job search experience

      Table 14: Number of job offers while searching for work

      Table 14 (historical): Number of job offers while searching for work

      Table 15: Main difficulty and duration of job search of unemployed persons

      Table 15 (historical): Main difficulty and duration of job search of unemployed persons

      Table 16: Main difficulty in finding work by age group of unemployed persons

      Table 16 (historical): Main difficulty in finding work by age group of unemployed persons

      Table 17: Labour mobility, retrenchments and duration of employment, 2015-2019

      Table 18: Change in employment characteristics of persons employed over the last year

      Table 18 (historical): Change in employment characteristics of persons employed over the last year

      Table 19: Change in employment characteristics of persons employed last year by industry

      Table 19 (historical): Change in employment characteristics of persons employed last year by industry

      Table 20: Change in employment characteristics of persons employed last year by occupation

      Table 20 (historical): Change in employment characteristics of persons employed last year by occupation

      Table 21: Populations by state or territory of usual residence

      Table 21 (historical): Populations by state or territory of usual residence

      Table 22: Extended measures of underutilisation, 2015-2019

      Changes in this issue

      Show all

      Regular rebenchmarking

      From 2018, the estimates in this publication are now rebenchmarked every year to reflect the most recently available release of Estimated Resident Population (ERP) data.

      Estimates have been revised to incorporate the latest benchmarks and all estimates, including 2019, are comparable with estimates published in the March 2019 issue of Labour Force, Australia (cat. no. 6202.0).

      Revised tables for 2015 to 2018 have been published in this issue (contained in Historical .zip files) and supersede the tables published in previous issues of this publication.

      Trend factor adjustments

      To reduce the impact of seasonal and irregular effects on total employment and unemployment, the estimates have been adjusted by factors based on trend Labour Force Survey (LFS) estimates (as published in March 2019).

      For example, the unemployment estimates collected in February have a typical seasonal pattern of higher estimates. The factors applied result in a decrease to the total number of unemployed to match trend LFS estimates.

      From this issue, underemployed estimates have also been adjusted by trend factors, also based on the monthly LFS estimates published in March 2019. Revisions using the underemployed trend adjustment have been completed back to 2015, Data from years prior to 2015 will be revised and published at a later date.

      For more information refer to the Methodology page.

      TableBuilder

      Participation, Job Search and Mobility 2019 microdata will be available today (8th July 2019) via TableBuilder (cat. no. 6226.0.00.001). For the first time, five years of data will be available, from 2015 to 2019.

      For more information see About TableBuilder.

      Skill level of last job

      The Australian and New Zealand Standard Classification of Occupations (ANZSCO) is a skill-based classification used to classify all occupations and jobs in the Australian and New Zealand labour markets. In line with the ANZSCO, occupation data have been grouped by skill level alongside the standard major occupation groups, providing an alternative view on the nature of work. Under this classification every occupation is assigned a skill level from 1 (high-skilled) to 5 (low-skilled) based on the range and complexity of the particular set of tasks performed in that job.

      Data relating in changes of skill level between the current and previous job are also available, and can be explored to greater detail in TableBuilder.

      Revisions to industry and occupation

      After a review of the industry and occupation data collected in PJSM since 2015, improvements have been made to the coding of responses relating to the occupation and industry of last job, the job last February, and changes in occupation while working for the same employer.

      Subsequently, revisions have been made to industry and occupation estimates. Revised tables for 2015 to 2018 have been published in this issue and supersede the tables published in previous issues of this publication.

      Relationship in household

      During the quality assurance of the publication Labour Force Status and Other Characteristics of Families (cat. no. 6224.0.55.001), the ABS identified an issue with some family coding, which affected a range of key family estimates - particularly during the period 2015 to 2018.

      For this reason, estimates relating to Relationship in Household have been removed from this issue of PJSM. All family related items have also been removed from TableBuilder.

      Revised data for the 2015-2019 period will be published in the next release of PJSM in 2020.

      History of changes

      Show all

      29/10/2019 - Replaced expired links to documents on ABS ShareFile with updated links to documents on ABS website.

      Back to top of the page