Overseas Arrivals and Departures, Australia

This is not the latest release View the latest release

Statistics on international travel arriving in and departing from Australia.

Reference period
September 2021
Released
12/11/2021

Key statistics

In September 2021:

  • Total arrivals: 18,840 – a monthly decrease of 8,140 trips

  • Total departures: 30,330 – a monthly decrease of 6,860 trips. The lowest on record.

These statistics report on the number of international border crossings rather than the number of people. Most data in this release are rounded to the nearest 10. As a result, sums of components may not add exactly to totals.

Migration Statistics

This release presents statistics on overseas arrivals and departures, which is not the same as migration statistics.

If you are looking for migration statistics, please refer to:

Arrivals and departures

(a) Provisional data for the most recent month has not had the full quality assurance methods applied as is done for the earlier months. Provisional data will be revised in the next issue of this publication.

(a) Provisional data for the most recent month has not had the full quality assurance methods applied as is done for the earlier months. Provisional data will be revised in the next issue of this publication.

Provisional Estimates

To provide more timely travel data in response to COVID-19, provisional estimates for total overseas arrivals and total overseas departures are now included in Graphs 1.1, 1.2 and 1.3. Additional provisional data are available under the Data downloads for State of clearance (Table 13), Country of citizenship (Table 14), and Visa group (Table 15). No further breakdowns of provisional data are available, other than those which appear in this release.

(a) Provisional data for the most recent month has not had the full quality assurance methods applied as is done for the earlier months. Provisional estimates will be revised in the next issue of this publication.

1.4 Arrivals and departures by category of travel - monthly change(a)
 Sep-19Sep-20Aug-21Sep-21Monthly change Aug 21 to Sep 21
Category of travel(no.)(no.)(no.)(no.)(no.)
Permanent arrivals(b)7,5209202,8002,290-510
Australian resident returns(c)     
          long-term10,6302,5305,5403,930-1,600
          short-term992,8208,17010,3106,020-4,290
Overseas visitor arrivals(d)     
          long-term40,1708802,0902,18090
          short-term694,9603,7206,2404,410-1,830
TOTAL ARRIVALS1,746,10016,20026,98018,840-8,140
Australian resident departures(c)     
          long-term16,9302,7905,4204,430-1,000
          short-term1,133,10013,66016,66014,420-2,240
Overseas Visitor departures(d)     
          long-term18,5606,06010,2509,220-1,040
          short-term627,95025,9804,8502,270-2,580
TOTAL DEPARTURES1,796,54048,49037,18030,330-6,860

a. Category of travel data is not available from provisional estimates.
b. Permanent arrivals (settlers) comprise: travellers who hold permanent visas, New Zealand citizens who indicate on their passenger card an intention to migrate permanently, and those who are otherwise identified as eligible to settle.
c. Australian resident includes Australian citizens, permanent visa holders residing in Australia, and any New Zealand citizens who can be identified as a resident.
d. An overseas visitor is any traveller arriving to, or departing from, Australia who is not an Australian resident.
NOTE: Long-term are travellers who have been away or in Australia for 12 months or more. Short-term are travellers who have been away or in Australia for less than 12 months.

Visitor arrivals - short-term

Compares international visitor arrivals each month by source country and change at the state and territory level. Analysis in this section is undertaken on short-term trips (less than 1 year).

For visitor arrivals to Australia:

  • A total of 4,410 short-term trips were recorded, an increase of 700 compared with the corresponding month of the previous year.
  • September 2021 trips decreased 99.4% when compared with pre-COVID levels in September 2019.
  • Afghanistan was the largest source country, accounting for 11% of all visitor arrivals.

Source countries

The three leading source countries where visitors came from were:

  • Afghanistan (470 trips)
  • The UK (380)
  • Vanuatu (360).

Details

(a) Top 10 source countries based on month ending September 2021.
(b) Includes United Kingdom, Channel Islands and Isle of Man.
(c) Excludes SARs and Taiwan.

2.3 Short-term visitor arrivals - Top 10 source countries(a)
Country of ResidenceSep 2019 (no.)Sep 2020 (no.)Aug 2021 (no.)Sep 2021 (no.)Aug 2021 to Sep 2021 change
Afghanistan800230470240
UK(b)41,300430540380-160
Vanuatu1,880170770360-410
India32,020210400310-80
Singapore36,260190350310-50
Samoa8500120300180
Indonesia15,7606080290200
USA48,380610400230-160
Philippines12,5801702102100
China(c)98,990200260130-140

(a) Top 10 source countries based on month ending September 2021.
(b) Includes United Kingdom, Channel Islands and Isle of Man.
(c) Excludes SARs and Taiwan.

State or territory of stay

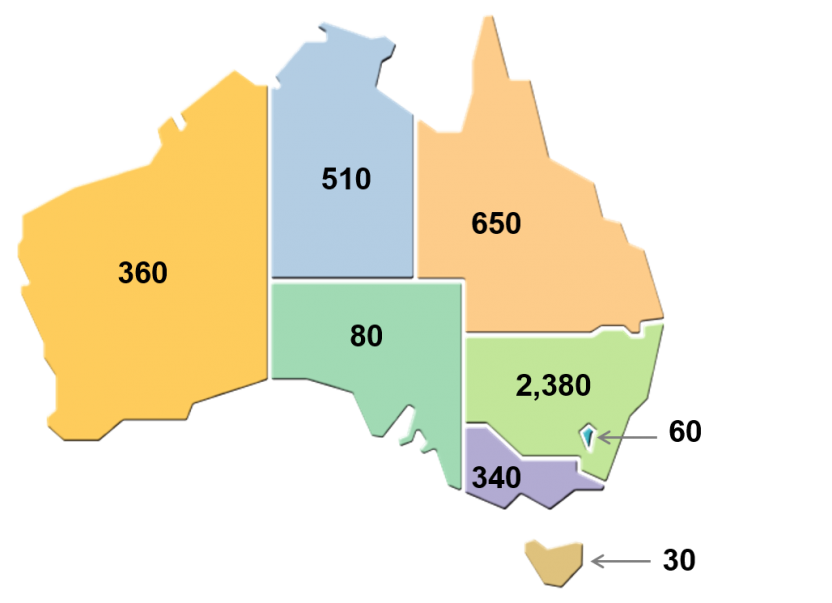
All travellers are asked their intended address in Australia upon arrival. For September 2021, the highest number of visitor arrivals was observed for New South Wales (2,380) whilst Tasmania recorded the fewest (30). 

Details

2.4 Short-term visitor arrivals, State or territory of stay - September 2021

Short-term visitor arrivals, State or territory of stay - September 2021
Data is shown in Table 2.5 below
2.5 Short-term visitor arrivals, State or territory of stay
State or territory of staySep 2019 (no.)Sep 2020 (no.)Aug 2021 (no.)Sep 2021 (no.)Aug 2021 to Sep 2021 change
NSW251,7301,8803,9902,380-1,610
Vic.168,980330700340-360
Qld160,010730820650-170
SA22,780100508030
WA69,390300430360-80
Tas.5,130209030-60
NT8,450270100510410
ACT8,46090506010
Australia(a)694,9603,7206,2404,410-1,830

(a) Includes Other Territories.
 

Visitor arrivals - short-term - state and territory

Compares international visitor arrivals each month by source country for each state and territory. The additional information is being provided during the COVID-19 pandemic. Analyses in this section are undertaken on short-term trips (less than 1 year) unless otherwise stated.

New South Wales

For visitor arrivals to New South Wales:

  • There were 2,380 short-term visitor arrivals, an increase of 500 compared with the corresponding month of the previous year.
  • September 2021 arrivals decreased 99.1% when compared with pre-COVID levels in September 2019.

Source countries

The three leading source countries for New South Wales were:

  • The UK (280 trips)
  • Singapore (180)
  • Vanuatu (180).

(a) Top 10 source countries based on month ending September 2021.
(b) Includes United Kingdom, Channel Islands and Isle of Man.
(c) Excludes SARs and Taiwan.

3.3 Short-term visitor arrivals, NSW - Top 10 source countries(a)
Country of ResidenceSep 2019 (no.)Sep 2020 (no.)Aug 2021 (no.)Sep 2021 (no.)Aug 2021 to Sep 2021 change
UK(b)13,960260390280-110
Singapore8,6709017018010
Vanuatu47080360180-180
USA24,740320280160-120
Afghanistan400160150-10
Samoa40009014050
India11,32050270130-140
Philippines5,80090140120-20
Tonga52000100100
China(c)42,13010015070-80

(a) Top 10 source countries based on month ending September 2021.
(b) Includes United Kingdom, Channel Islands and Isle of Man.
(c) Excludes SARs and Taiwan.
 

Long-term visitor arrivals

For visitors arriving in New South Wales for a long-term trip (1 year or more):

  • There were 1,310 arrivals, an increase of 860 compared with the corresponding month of the previous year.
  • September 2021 arrivals decreased 92.7% when compared with pre-COVID levels in September 2019.

Victoria

For visitor arrivals to Victoria:

  • There were 340 short-term visitor arrivals, an increase of 20 compared with the corresponding month of the previous year.
  • September 2021 arrivals decreased 99.8% when compared with pre-COVID levels in September 2019.

Source countries

The three leading source countries for Victoria were:

  • Afghanistan (90 trips)
  • China (40)
  • The UK (30).

(a) Top 10 source countries based on month ending September 2021.
(b) Excludes SARs and Taiwan.
(c) Includes United Kingdom, Channel Islands and Isle of Man.

4.3 Short-term visitor arrivals, Vic. - Top 10 source countries(a)
Country of ResidenceSep 2019 (no.)Sep 2020 (no.)Aug 2021 (no.)Sep 2021 (no.)Aug 2021 to Sep 2021 change
Afghanistan200309060
China(b)31,700507040-30
UK(c)8,380305030-20
Vanuatu440020030-170
India12,0403010200
USA9,720404010-30
Hong Kong5,2901010100
Ireland1,0001010100
Philippines3,330010100
Unit Arab Emir50001010-10

(a) Top 10 source countries based on month ending September 2021
(b) Excludes SARs and Taiwan.
(c) Includes United Kingdom, Channel Islands and Isle of Man. 

Long-term visitor arrivals

For visitors arriving in Victoria for a long-term trip (1 year or more):

  • There were 230 arrivals, an increase of 130 compared with the corresponding month of the previous year.
  • September 2021 arrivals decreased 97.9% when compared with pre-COVID levels in September 2019.

Queensland

For visitor arrivals to Queensland:

  • There were 650 short-term visitor arrivals, a decrease of 80 compared with the corresponding month of the previous year.
  • September 2021 arrivals decreased 99.6% when compared with pre-COVID levels in September 2019.

Source countries

The three leading source countries for Queensland were:

  • India (120 trips)
  • Afghanistan (120)
  • Vanuatu (50).

(a) Top 10 source countries based on month ending September 2021.
(b) Includes United Kingdom, Channel Islands and Isle of Man.

5.3 Short-term visitor arrivals, Qld - Top 10 source countries(a)
Country of ResidenceSep 2019 (no.)Sep 2020 (no.)Aug 2021 (no.)Sep 2021 (no.)Aug 2021 to Sep 2021 change
India4,2401007012050
Afghanistan004012080
Vanuatu53010105040
Philippines1,59060304010
UK(b)9,820806030-30
USA8,210803020-10
Ukraine6020102010
Solomon Islands5000102010
New Zealand51,82011012020-100
Singapore5,3802014020-130

(a) Top 10 source countries based on month ending September 2021.
(b) Includes United Kingdom, Channel Islands and Isle of Man.

Long-term visitor arrivals

For visitors arriving in Queensland for a long-term trip (1 year or more):

  • There were 280 arrivals, an increase of 180 compared with the corresponding month of the previous year.
  • September 2021 arrivals decreased 94.7% when compared with pre-COVID levels in September 2019.

South Australia

For visitor arrivals to South Australia:

  • There were 80 short-term visitor arrivals, a decrease of 20 compared with the corresponding month of the previous year.
  • September 2021 arrivals decreased 99.6% when compared with pre-COVID levels in September 2019.

Long-term visitor arrivals

For visitors arriving in South Australia for a long-term trip (1 year or more):

  • There were 40 arrivals, an increase of 20 compared with the corresponding month of the previous year.
  • September 2021 arrivals decreased 97.3% when compared with pre-COVID levels in September 2019.


Due to volatility in the very small number of movements caused by COVID-19, no further analysis has been undertaken.

Western Australia

For visitor arrivals to Western Australia:

  • There were 360 short-term visitor arrivals, an increase of 50 compared with the corresponding month of the previous year.
  • September 2021 arrivals decreased 99.5% when compared with pre-COVID levels in September 2019.

Source countries

The three leading source countries for Western Australia were:

  • Vanuatu (80 trips)
  • Singapore (40)
  • Afghanistan (30).

(a) Top 10 source countries based on month ending September 2021.
(b) Includes United Kingdom, Channel Islands and Isle of Man. 

7.3 Short-term visitor arrivals, WA - Top 10 source countries(a)
Country of ResidenceSep 2019 (no.)Sep 2020 (no.)Aug 2021 (no.)Sep 2021 (no.)Aug 2021 to Sep 2021 change
Vanuatu200708010
Singapore10,29030204020
Afghanistan10003030
Philippines99010203010
UK(b)6,310403020-10
India2,260203020-10
Indonesia2,8601020200
USA2,4304020200
New Zealand5,5702014010-130
Germany1,7001001010

(a) Top 10 source countries based on month ending September 2021.
(b) Includes United Kingdom, Channel Islands and Isle of Man. 

Long-term visitor arrivals

For visitors arriving in Western Australia for a long-term trip (1 year or more):

  • There were 170 arrivals, an increase of 80 compared with the corresponding month of the previous year.
  • September 2021 arrivals decreased 94.9% when compared with pre-COVID levels in September 2019.

Tasmania

For visitor arrivals to Tasmania:

  • There were 30 short-term visitor arrivals, an increase of 10 compared with the corresponding month of the previous year.
  • September 2021 arrivals decreased 99.3% when compared with pre-COVID levels in September 2019.

Long-term visitor arrivals

For visitors arriving in Tasmania for a long-term trip (1 year or more):

  • There were 10 arrivals, the same as the corresponding month of the previous year.
  • September 2021 arrivals decreased 97.5% when compared with pre-COVID levels in September 2019.


Due to volatility in the very small number of movements caused by COVID-19, no further analysis has been undertaken.

Northern Territory

For visitor arrivals to the Northern Territory:

  • There were 510 short-term visitor arrivals, an increase of 240 compared with the corresponding month of the previous year.
  • September 2021 arrivals decreased 94% when compared with pre-COVID levels in September 2019.

Long-term visitor arrivals

For visitors arriving in the Northern Territory for a long-term trip (1 year or more):

  • There were 70 arrivals, an increase of 40 compared with the corresponding month of the previous year.
  • September 2021 arrivals decreased 82.8% when compared with pre-COVID levels in September 2019.


Due to volatility in the very small number of movements caused by COVID-19, no further analysis has been undertaken.

Australian Capital Territory

For visitor arrivals to the Australian Capital Territory:

  • There were 60 short-term visitor arrivals, a decrease of 30 compared with the corresponding month of the previous year.
  • September 2021 arrivals decreased 99.3% when compared with pre-COVID levels in September 2019.

Long-term visitor arrivals

For visitors arriving in the Australian Capital Territory for a long-term trip (1 year or more):

  • There were 80 arrivals, a decrease of 10 compared with the corresponding month of the previous year.
  • September 2021 arrivals decreased 91% when compared with pre-COVID levels in September 2019.


Due to volatility in the very small number of movements caused by COVID-19, no further analysis has been undertaken.

Visitor arrivals - short-term - Financial year 2020-21

Compares annual international travel arrivals over time by source country, by state and territory, by age and sex, by main reason for journey and by median duration of trip. All analysis in this section is done on short-term trips (less than 1 year).

Effects of COVID-19 outbreak

The World Health Organisation (WHO) commenced daily situation reports of the COVID-19 outbreak on 21 January 2020 and identified it as an international health emergency on 30 January. This was less than a month after suspected cases were reported in Wuhan, China. Initially the Australian Government placed travel restrictions on those travelling to Australia from mainland China commencing 1 February 2020. Restrictions on other countries soon followed. From 20 March 2020, all overseas travel was banned, with few exceptions. The pandemic has continued to disrupt international travel with volumes at a record low for the 2020-21 financial year. For more information, see the Prime Minister's media release on border restrictions or the Smartraveller page from the Australian Government Department of Foreign Affairs and Trade website.

Visitors arriving in Australia in 2020-21:

  • There were 150,880 visitor arrivals, down 97.8% on the previous year
  • New Zealand was the largest source country, accounting for 83,710 visitors nationally
  • The main reason for travel was 'Visiting friends/relatives' (54.1%). A year ago it was 'Holiday' (46.3%)
  • Nationally, the median duration of stay in Australia was 27 days.

Annual visitor arrivals

There were 150,880 visitor arrivals in 2020-21. This was down 97.8% on the previous year with 6.6 million fewer arrivals.

The COVID-19 pandemic has resulted in substantial declines in travel movements since the introduction of border restrictions in March 2020.

11.1 Short-term visitor arrivals by month
2020-21'000Change (no.)(a)
Jul3.53-786.85
Aug3.03-786.17
Sep3.72-691.24
Oct6.07-767.95
Nov7.57-808.34
Dec8.82-1,068.90
Jan7.99-758.60
Feb6.26-679.15
Mar8.32-323.57
Apr22.6120.36
May36.1932.75
Jun36.7731.38
Annual Total150.88-6,586.29

(a) Numerical change when compared to the same period of the previous year.


Visitor arrivals to Australia have generally been increasing over recent decades, with a strong continuous increase over the past ten years (as seen in graph 13.2 below).

  • Peaks were seen during the Brisbane Expo in 1988 and the Sydney Olympics in 2000
  • Decreases were experienced during the Asian financial crisis in 1998, after the 2001 September 11 attacks in the USA, the Severe Acute Respiratory Syndrome (SARS) outbreak in 2003 and the Global Financial Crisis (GFC) in 2008.

However, due to the impact of COVID-19, a substantial decline has been observed from February 2020 onwards. Prior to the pandemic, there were a record 9.5 million visitors to Australia in the year ending January 2020.

Events impacting short-term visitor arrivals include:

  • 1988: Brisbane Expo
  • 1998: Asian financial crisis
  • 2000: Sydney Olympics
  • 2001: September 11 attacks
  • 2003: Severe Acute Respiratory Syndrome (SARS) outbreak
  • 2008: Global Financial Crisis (GFC)
  • 2020: COVID-19 outbreak from February onwards

Source countries

Travel restrictions have resulted in a change in the source countries of visitors to Australia.

In 2020-21:

  • Short-term visitor arrivals for all top 5 source countries are lower when compared with the previous year, due to the impact of the COVID-19 pandemic
  • New Zealand (83,710 visits) was the largest source country for visitor arrivals
  • The USA (10,200) was the second largest.

In 2019-20, New Zealand was the largest and China the second largest.

(a) Top 5 source countries based on year ending June 2020.
(b) Includes United Kingdom, Channel Islands and Isle of Man.
(c) Excludes SARs and Taiwan.

Among the top 10 source countries, there was strong growth from Asian countries over the last decade. Recent declines for these countries are due to the impact of the COVID-19 pandemic.

11.4 Short-term visitor arrivals, Australia — Top 10 source countries(a) — 2020-21
Country of Residence'0002019-20 to 2020-21 change ('000)2010-11 to 2020-21 change ('000)
New Zealand83.71-944.71-1,091.820
USA10.2-571.26-465.54
UK(b)8.11-554.22-653.16
Singapore3.86-311.87-264.62
China(c)3.4-896.35-494.98
India3.22-281.63-141.93
Vanuatu2.73-9.8-7.26
Philippines2.58-102.65-58.79
Hong Kong2.2-225.19-155.02
Tonga2-6.67-5.52

(a) Top 10 source countries based on year ending June 2021.
(b) Includes United Kingdom, Channel Islands and Isle of Man.
(c) Excludes SARs and Taiwan.

State or territory of stay

All travellers are asked their intended address in Australia upon arrival.

Since the start of the COVID-19 pandemic, a number of state borders and airports have been closed to international visitors at different times.

In July 2020 National Cabinet agreed that all international passenger flight arrivals would be coordinated by the Commonwealth Government. This meant that the number of arrivals at each international airport was subject to caps agreed upon between federal and state and territory governments. For example, as part of this national coordinated approach, all international passenger flights into Victoria were cancelled from this time until 7 December 2020.

The proportion of short-term visitor arrivals by intended state or territory in 2020-21 were as follows:

  • NSW (47.6% of all short-term visitors)
  • Vic. (13.6%)
  • Qld (25.0%)
  • SA (2.5%)
  • WA (7.5%)
  • Tas. (1.3%)
  • NT (1.1%)
  • ACT (1.2%). 

All states recorded growth in international visitors in the ten year period up to early 2020. In comparison, the territories experienced fluctuations in visitor numbers, particularly the Northern Territory. All states and territories observed a considerable drop in visitor numbers in 2020-21.

At the state and territory level, the mix of source countries varies from that at the national level. During 2020-21:

  • Due to the trans-Tasman travel bubble, New Zealand provided the most visitors to all states except the NT
  • The USA was the largest provider of visitors to the NT

Ten years earlier in 2010-11, New Zealand was the leading source country for NSW, Vic., Qld, SA, and Tas. However, the USA was the leading source country for the NT and ACT, and the UK was the leading source country for WA.

Age and sex

There were more visits to Australia by men than women in 2020-21 (84,130 men compared with 66,750 women). The same was true in 2010-11 (3.0 million men and 2.9 million women).

In 2020-21 male visitors had a median age of 40 years, whereas female visitors had a median age of 41 years. The largest group of visitor arrivals was aged between 25 and 29 years, with the largest source country for this age group being New Zealand.

Main reason for journey

In 2020-21, the most frequently stated main reason for journey by short-term visitors to Australia was:

  • Visiting friends/relatives (54.1%)
  • Business (12.1%)
  • Employment (11.1%)

(a) As a percentage of all short-term visitor arrivals.

Female visitors were more likely than males to record their main reason for journey as:

  • Visiting friends or relatives
  • Holiday 
  • Education.

Male visitors were more likely than females to record their main reason for journey as:

  • Business
  • Employment
  • Other.

During the pandemic and associated travel restrictions there has been an increase in travellers recording 'Other' as their main reason for journey. 

11.8 Short-term visitor arrivals, Australia — Main reason for journey and Sex — 2020-21
Males (%)Females (%)
Visiting friends/relatives43.068.2
Business17.65.1
Employment15.45.8
Holiday8.49.6
Education1.52.2
Convention/conference1.00.7
Exhibition0.10.1
Other13.08.5
Total100.0100.0

Duration of stay

Visitors are asked their intended duration in Australia upon arrival.

During 2020-21, the median duration of stay in Australia had increased to 27 days from 12 days the year before. This is due to the impact of COVID-19 on travel behaviour and a much smaller volume of travellers making the data more volatile. The median duration varied between the states and territories and between the numerous source countries. It also varied depending on a traveller's main reason for journey.

In 2020-21, the median duration of days for those visiting the NT was 91 days (or 3 months as recorded on the passenger card), whereas for Qld it was 14 days. Those from Vanuatu and Tonga (with a median duration of stay of 9 months) stated much longer intended durations of stay than most others, but this also varied between the states and territories. Many of these visitors were seasonal workers. Those from New Zealand only visited for 11 days on average, but this was up from 7 days recorded from the year before.

11.9 Short-term visitor arrivals, Australia — Top 10 source countries(a) by State/Territory of stay — Median duration of stay (days) — 2020-21
NSWVic.QldSAWATas.NTACTAust.(b)
Vanuatu27427424427427427427461274
Tonga274183274274244274102213274
China(c)92929192921821499292
India919213921692219262
UK(d)626262916867906262
Hong Kong6291626261183914362
USA6161616161621826161
Singapore616161506265925561
Philippines319115911515919130
New Zealand101110141610221111
All countries293114554053913527

(a) Top 10 source countries have been calculated at the Australia level.
(b) Includes Other Territories.
(c) Excludes SARs and Taiwan.
(d) Includes United Kingdom, Channel Islands and Isle of Man.

The median duration of stay of short-term visitors to Australia varied according to reason for journey:

  • Those travelling for education and employment (both 152 days) stayed the longest
  • Business and Exhibition (30 days)
  • Visiting friends/relatives (21 days)
  • Those travelling for a holiday or a convention/conference stayed the shortest (10 and 6 days respectively).

Arrivals - international students

Compares international student arrivals each month by visa type for each state and territory and nationally. It includes both those whose intended duration is short-term (less than 1 year) or long-term (1 year or more). The additional information is being provided during the COVID-19 pandemic. 

Australia

  • In September 2021 there were 120 international student arrivals to Australia, an increase of 30 students compared with the corresponding month of the previous year.
  • September 2021 arrivals decreased 99.7% when compared with pre-COVID levels in September 2019.

(a) International student visa holders whether it be for a short-term (less than 1 year) or long-term (1 year or more) duration.
This is not the same as when a traveller self reports 'education' as their main reason for journey.
(b) English Language Intensive Courses for Overseas Students.

New South Wales

  • In September 2021 there were 80 international student arrivals to New South Wales, an increase of 50 students compared with the corresponding month of the previous year.
  • September 2021 arrivals decreased 99.6% when compared with pre-COVID levels in September 2019.


Due to volatility in the very small number of movements caused by COVID-19, no further analysis has been undertaken.

Victoria

  • In September 2021 there were 20 international student arrivals to Victoria, an increase of 10 students compared with the corresponding month of the previous year.
  • September 2021 arrivals decreased 99.8% when compared with pre-COVID levels in September 2019.


Due to volatility in the very small number of movements caused by COVID-19, no further analysis has been undertaken.

Queensland

  • In September 2021 there were 0 international student arrivals to Queensland, a decrease of 10 students compared with the corresponding month of the previous year.
  • September 2021 arrivals decreased 99.9% when compared with pre-COVID levels in September 2019.


Due to volatility in the very small number of movements caused by COVID-19, no further analysis has been undertaken.

South Australia

  • In September 2021 there were 0 international student arrivals to South Australia, the same as the corresponding month of the previous year.


Due to volatility in the very small number of movements caused by COVID-19, no further analysis has been undertaken.

Western Australia

  • In September 2021 there were 0 international student arrivals to Western Australia, the same as the corresponding month of the previous year.


Due to volatility in the very small number of movements caused by COVID-19, no further analysis has been undertaken.

Tasmania

  • In September 2021 there were 0 international student arrivals to Tasmania, the same as the corresponding month of the previous year.


Due to volatility in the very small number of movements caused by COVID-19, no further analysis has been undertaken.

Northern Territory

  • In September 2021 there were 0 international student arrivals to the Northern Territory, the same as the corresponding month of the previous year.


Due to volatility in the very small number of movements caused by COVID-19, no further analysis has been undertaken.

Australian Capital Territory

  • In September 2021 there were 0 international student arrivals to the Australian Capital Territory, the same as the corresponding month of the previous year.


Due to volatility in the very small number of movements caused by COVID-19, no further analysis has been undertaken.

Resident returns - short-term

Compares international resident returns each month by destination country and change at the state and territory level. Analysis in this section is undertaken on short-term trips (less than 1 year).

For residents returning from overseas:

  • A total of 6,020 short-term trips were recorded, a decrease of 2,140 compared with the corresponding month of the previous year.
  • September 2021 trips decreased 99.4% when compared with pre-COVID levels in September 2019.
  • The USA was the most popular destination country, accounting for 14% of all resident returns.

Destination countries

The three leading destination countries residents returned from were:

  • The USA (870 trips)
  • The UK (590)
  • Japan (500).

Details

(a) Top 10 destination countries based on month ending September 2021.
(b) Includes United Kingdom, Channel Islands and Isle of Man.
(c) Excludes SARs and Taiwan.

13.3 Short-term resident returns - Top 10 destination countries(a)
Country of StaySep 2019 (no.)Sep 2020 (no.)Aug 2021 (no.)Sep 2021 (no.)Aug 2021 to Sep 2021 change
USA95,180750600870270
UK(b)73,8301,08056059030
Japan30,8601301,190500-690
PNG8,06039030035040
India22,950440420250-160
New Zealand110,9509404,270230-4,040
China(c)46,650500250220-30
Pakistan2,2207013019070
Unit Arab Emir4,3101708014060
France16,4601207012050

(a) Top 10 destination countries based on month ending September 2021.
(b) Includes United Kingdom, Channel Islands and Isle of Man.
(c) Excludes SARs and Taiwan.

State or territory of residence

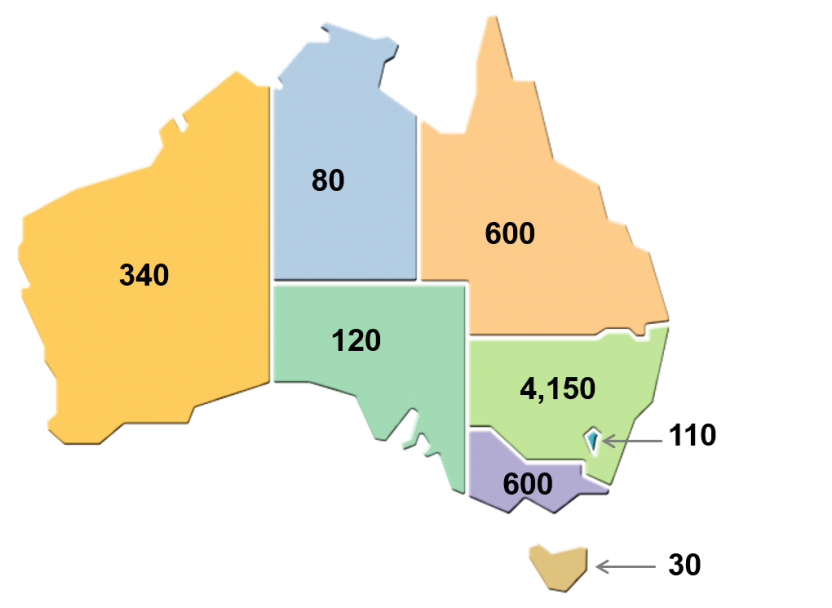
All travellers are asked their intended address in Australia upon arrival.  For September 2021, the highest number of resident returns were observed for New South Wales (4,150) whilst Tasmania recorded the fewest (30). 

Details

13.4 Short-term resident returns, State or territory of residence - September 2021

13.4 Short-term resident returns, State or territory of stay - September 2021
Data is shown in Table 13.5 below
13.5 Short-term resident returns, State or territory of residence
State or territory of residenceSep 2019 (no.)Sep 2020 (no.)Aug 2021 (no.)Sep 2021 (no.)Aug 2021 to Sep 2021 change
NSW318,8404,5506,9204,150-2,770
Vic.292,5501,080950600-350
Qld176,4601,2201,190600-590
SA47,780260160120-40
WA120,110750850340-510
Tas.11,120606030-30
NT8,00070408040
ACT17,760180140110-30
Australia(a)992,8208,17010,3106,020-4,290

(a) Includes Other Territories.
 

Resident returns - short-term - Financial year 2020-21

Compares annual international travel for resident returns over time by destination country, by state and territory, by age and sex, by main reason for journey and by median duration of trip. All analysis in this section is done on short-term trips (less than 1 year).

Effects of COVID-19 outbreak

The World Health Organisation (WHO) commenced daily situation reports of the COVID-19 outbreak on 21 January 2020 and identified it as an international health emergency on 30 January. This was less than a month after suspected cases were reported in Wuhan, China. Initially the Australian Government placed travel restrictions on those travelling to Australia from mainland China commencing 1 February 2020. Restrictions on other countries soon followed. From 20 March 2020, all overseas travel was banned, with few exceptions. The pandemic has continued to disrupt international travel with volumes at a record low for the 2020-21 financial year. For more information, see the Prime Minister's media release on border restrictions or the Smartraveller page from the Australian Government Department of Foreign Affairs and Trade website.

Australian residents returning to Australia in 2020-21:

  • There were 223,830 resident returns from overseas, down 97.4% on the previous year and the lowest since 1996
  • New Zealand continued to be the leading destination country for Australians travelling overseas, accounting for 122,740 trips nationally
  • The main reason for travel was 'visiting friends/relatives' (52.7%)
  • Nationally, the median duration away was 29 days.

Annual resident returns

There were 223,830 resident trips overseas in 2020-21. This was down 97.4% on the previous year with 8.3 million fewer trips taken. This was the lowest annual number of resident trips since 1996. 

The COVID-19 pandemic has resulted in substantial declines in travel movements since the introduction of border restrictions in March 2020.

14.1 Short-term resident returns by month
2020-21'000Change ('000)
Jul10.28-1,112.31
Aug8.07-922.90
Sep8.17-984.65
Oct11.17-1,134.81
Nov13.00-836.79
Dec14.30-735.36
Jan11.35-1,386.07
Feb8.39-777.00
Mar9.25-529.11
Apr16.99-0.06
May62.3648.98
Jun50.4934.74
Annual Total223.83-8,335.34

(a) Numerical change when compared to the same period of the previous year


Australian residents travelling overseas have generally been increasing over recent decades, with a number of decreases observed over time due to various historical events (as seen in graph 14.2 below) such as the: 

  • Early 1990s recession in Australia
  • September 11 terrorist attacks in 2001
  • Bali bombings in 2002
  • Severe Acute Respiratory Syndrome (SARS) outbreak in 2003
  • Global Financial Crisis (GFC) in 2008

However, due to the impact of COVID-19, a substantial decline has been observed from March 2020 onwards. Prior to the pandemic, there were 11.4 million resident trips overseas in the year ending February 2020.

Events impacting short-term resident returns include:

  • 1990: Recession
  • 2001: September 11 attacks
  • 2002: Bali bombings
  • 2003: Severe Acute Respiratory Syndrome (SARS) outbreak
  • 2008: Global Financial Crisis (GFC)
  • 2020: COVID-19 outbreak from February onwards

Destination countries

In 2020-21: 

  • Short-term resident returns for all top 5 destination countries continue to be low due to the impact of COVID-19
  • New Zealand (122,740 trips) was the leading destination country
  • The USA (10,590) was the second most popular destination
  • The UK (10,440) was the third leading destination.

(a) Top 5 destination countries based on year ending June 2021.
(b) Includes United Kingdom, Channel Islands and Isle of Man.
(c) Excludes SARs and Taiwan.

Among the top 10 destination countries, the strongest growth over the last decade was for Australians visiting Asian countries. Recent declines for these countries are due to the impact of the COVID-19 pandemic.

14.4 Short-term resident returns, Australia — Top 10 destination countries(a) — 2020-21
Destination Country'0002019-20 to 2020-21 change ('000)2010-11 to 2020-21 change ('000)
New Zealand122.74-1,022.23-937.36
USA10.59-768.07-753.30
UK(b)10.44-517.57-485.92
India7.33-339.92-169.15
China(c)5.87-391.01-348.75
PNG5.17-65.84-73.46
Singapore3.98-299.86-266.92
Hong Kong3.37-112.09-212.24
Indonesia2.75-1,073.96-804.32
Pakistan2.61-33.20-12.61

(a) Top 10 destination countries based on year ending June 2021.
(b) Includes United Kingdom, Channel Islands and Isle of Man.
(c) Excludes SARs and Taiwan.

State or territory of residence

All travellers are asked their intended address in Australia upon arrival.

Since the start of the COVID-19 pandemic, a number of state borders and airports have been closed to international visitors at different times.

In July 2020 National Cabinet agreed that all international passenger flight arrivals would be coordinated by the Commonwealth Government. This meant that the number of arrivals at each international airport was subject to caps agreed upon between federal and state and territory governments. For example, as part of this national coordinated approach, all international passenger flights into Victoria were cancelled from this time until 7 December 2020.

The proportion of short-term resident returns by their state or territory of residence in 2020-21 were as follows:

  • NSW (54.6% of all short-term resident returns)
  • Vic. (15.9%)
  • Qld (17.5%)
  • SA (2.4%)
  • WA (6.9%)
  • Tas. (0.7%)
  • NT (0.4%)
  • ACT (1.5%).

In 2010-11 the proportions were different especially for the two most populated states, with those travelling overseas from NSW accounting for 35.3% of all visitors and Vic. accounting for 24.5%.

Most states and territories recorded growth in residents taking overseas trips in the ten year period up to early 2020. Western Australia, however, remained flat from 2014 until the impact of the pandemic. While the Northern Territory wavered during the decade and had started to decline in the year before COVID-19. However, there was a considerable drop for all states and territories from March 2020 due to the COVID-19 pandemic.

At the state and territory level, the mix of destination countries is similar to that at the national level. During 2020-21:

  • New Zealand was the leading destination country for residents of all states due to the trans-Tasman travel bubble.

Ten years earlier in 2010-11, New Zealand was the leading destination for residents of all states and territories except for SA, WA, and the NT (for which Indonesia was the leading destination).

Age and sex

There were more trips taken overseas by Australian men than women in 2020-21 (122,550 men compared with 101,280 women), In 2010-11, there was also more trips taken by men than women (3.9 million men compared with 3.5 million women).

In 2020-21, Australian men and women travelling overseas had a similar median age (41 years and 38 years respectively). Among those aged 20 to 29, women took more trips than men.

Main reason for journey

In 2020-21, the most frequently stated main reason for journey by Australian residents returning home after a short-term trip was:

  • Visiting friends/relatives (52.7%)
  • Employment (11.0%)
  • Business (10.8%).

(a) As a percentage of all short-term resident returns.

Female resident returns were more likely than males to record their main reason for journey as:

  • Visiting friends/relatives
  • Other
  • Holiday

Male resident returns were more likely than females to record their main reason for journey as:

  • Business
  • Employment

During the pandemic and associated travel restrictions there has been an increase in travellers recording 'Other' as their main reason for journey. 

14.8 Short-term resident returns, Australia — Main reason for journey and Sex — 2020-21
Main reason for journeyMales (%)Females (%)
Visiting friends/relatives45.761.3
Employment14.56.7
Business15.55.1
Holiday10.310.6
Education2.02.5
Convention/conference0.50.4
Exhibition0.10.1
Other11.413.4
Total100.0100.0

Duration of stay

For Australian residents returning from overseas their exact duration away is measured.

During 2020-21, the median duration away for Australians on a short-term trip had increased to 29 days from 15 days the year before. This is due to the impact of COVID-19 on travel behaviour and a much smaller volume of travellers making the data more volatile. The median duration varied between the states and territories and between the numerous destination countries. It also varied greatly depending on a traveller's main reason for journey.

In 2020-21, the median duration away overseas for those from Qld and NSW was 20 and 21 days respectively, whereas for those from ACT it was 86 days. The median duration of stay for those travelling to New Zealand was 9 days, which was shorter than all the other top 10 destinations. Those travelling to China spent the longest time away (193 days). 

14.9 Short-term resident returns, Australia — Top 10 destination countries(a) by State/Territory of Residence — Median duration of stay (days) — 2020-21
NSWVic.QldSAWATas.NTACTAust.(b)
China(c)197181209204215225255186193
Hong Kong18918220818416124821212189
UK(d)182167162178156206173156172
Singapore17818313614811721758223165
Indonesia153186125134154109197126152
USA15414811017013416285149145
India136143150193146192197120143
Pakistan124123120126105291268102122
PNG807477716967719776
New Zealand810101015111899
All countries215720747533708629

(a) Top 10 source countries have been calculated at the Australia level.
(b) Includes Other Territories.
(c) Excludes SARs and Taiwan.
(d) Includes United Kingdom, Channel Islands and Isle of Man.

The duration of stay of short-term trips by Australian residents going overseas varied according to reason for journey:

  • Those travelling for education stayed away the longest (203 days)
  • Employment (114 days)
  • Exhibition (34 days)
  • Visiting friends/relatives (17 days)
  • Business (13 days)

Recent changes

Inclusion of statistics on total arrivals and departures, and provisional estimates

From June 2021, the ABS has updated the layout and statistics available at the beginning of this publication. It now includes statistics in the commentary on total arrivals and total departures (including provisional figures) rather than just a focus on short-term travel. This is due to increased interest in all travel to Australia. 

To provide more timely travel data in response to COVID-19, provisional estimates are now included in Graphs 1.1, 1.2 and 1.3. Additional provisional data are available under the Data downloads for State of clearance (Table 13), Country of citizenship (Table 14), and Visa group (Table 15). No further breakdowns of provisional data are available, other than those which appear in this release.

COVID-19 from Feb 2020

In response to the need for additional data and analysis due to the COVID-19 pandemic, the ABS will continue to release a series of feature articles containing additional state and territory level analysis of overseas visitor arrivals over the coming months, as well as national and state and territory information on arrivals of overseas students. See the left hand navigation pane to access information on a specific state/territory or article.

The World Health Organisation (WHO) commenced daily situation reports of the COVID-19 outbreak on 21 January 2020 and identified it as an international health emergency on 30 January. This was less than a month after suspected cases were reported in Wuhan, China. The Australian Government placed travel restrictions on those travelling to Australia initially from mainland China commencing 1 February 2020. Restrictions on other countries soon followed. From 20 March 2020, all overseas travel was banned, with few exceptions. For more information, see the Prime Minister's media release on border restrictions or the Smartraveller page from the Australian Government Department of Foreign Affairs and Trade website.

Data notes

This release contains overseas movement data which should not be interpreted as 'persons'. See the Scope section, paragraph 1 in the Methodology for more detail.

The statistics in this release have been rounded. See the Confidentiality section in the Methodology for more detail.

Inquiries

For inquiries about these and related statistics, contact the Customer Assistance Service via the ABS website Contact Us page. The ABS Privacy Policy outlines how the ABS will handle any personal information that you provide to the ABS.

Data downloads

We will be progressively transitioning to releasing Excel files in .XLSX format from 3rd December 2021.

I-notes

1. For all Short-term Visitor Arrivals (STVA) and Short-term Resident Returns (STRR) series, the trend estimates have been suspended from February 2020 and the seasonally adjusted estimates have been suspended from April 2020 due to the impact of the COVID-19 pandemic on international travel. For more information, see the Seasonally adjusted and trend estimates section in the Methodology page associated with this release.

2. The quality of the imputation used to estimate duration of stay for some resident departures has been impacted by changed travel behaviour during COVID-19 travel restrictions. The proportional split between short-term resident departures and long-term resident departures has been impacted. Where possible, instead of departure volumes, we recommend clients use short-term resident returns and long-term resident returns for greater accuracy. For more information on how this variable is imputed, please see paragraph 28 of the Imputations and derivations section of the Methodology page.

3. Short-term arrival movements are usually based on a sample and subject to sampling error. However, from April 2020 a full enumeration has been undertaken due to the small volume of international travel movements caused by the impact of COVID-19. See paragraphs 1-2 of the Sampling section in the Methodology page.

4. Occasionally situations occur that necessitate breaks being applied to the trend series. For an overview of the breaks currently included in the trend series, see paragraph 14 of the Seasonally adjusted and trend estimates section in the Methodology.

5. For further information about the data, including updates or changes, see the Methodology page.

Time series spreadsheets

Data files

ABS.Stat datasets

Caution: Data in ABS.Stat is currently released after the 11:30am release on the ABS website. Please check the reference period when using ABS.Stat.

ABS.Stat is updating and the above datasets are now available in 'Data Explorer'. 
The data available in Data Explorer is similar to ABS.Stat but with a new interface and added functionality.
For more information about Data Explorer and to see what's changed, see the Data Explorer user guide.
The current version of ABS.Stat will be removed at the end of 2021.

Data Explorer datasets

Caution: Data in Data Explorer is currently released after the 11:30am release on the ABS website. Please check the reference period when using Data Explorer.

Previous catalogue number

This release previously used catalogue number 3401.0

Article archive

Back to top of the page