Weighting theory and methodology
The weights used to compile price indexes determine the impact a particular price change will have on the overall index. This section of this release outlines the weighting methodology and sources adopted by the ABS for the Producer and International Trade Price Indexes.
Basic Price Index Structure
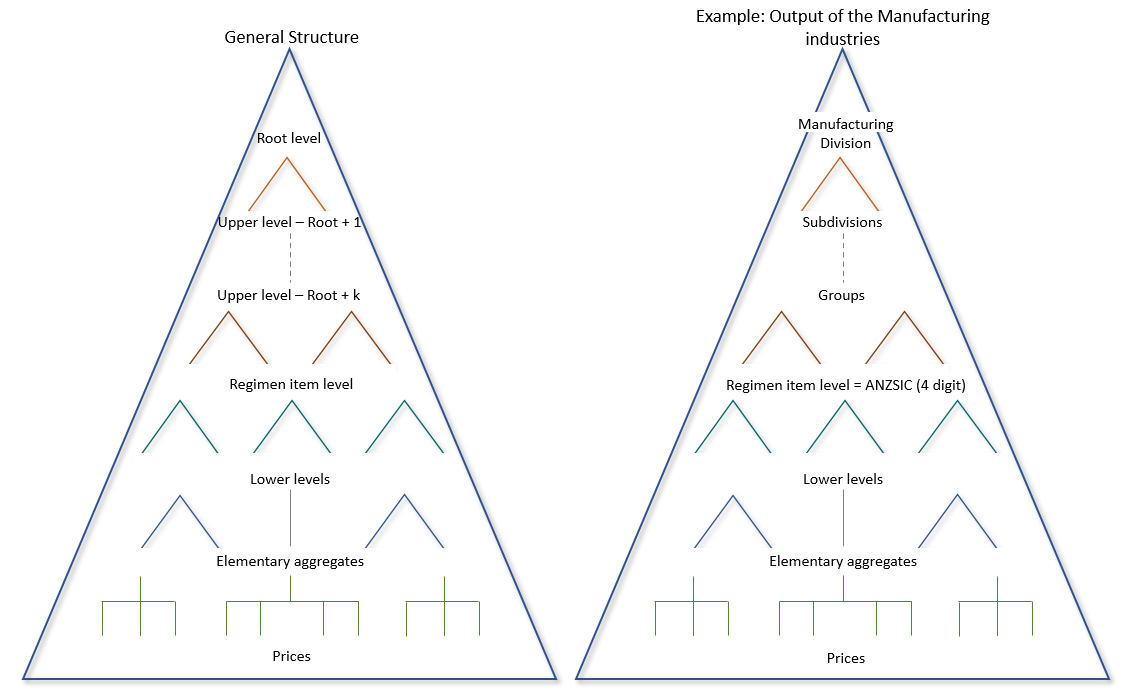
A diagrammatic overview of the typical structure of a price index is provided in Figure 3.1. At the top is the total value of products represented by the index. This is progressively divided into finer product groupings, following the structure of the classification until, at the lowest level, there are samples of prices for individual products. These highly detailed price samples are called elementary aggregates. Indexes are only published down to the regimen level as this is the level at which the structure and weights remain fixed between index reviews.
Figure 3.1 Example of a general index structure and the Output of manufacturing industries index structure
Image
Description
The division of products into finer product groupings is intended to reflect increasing levels of substitutability of the products in response to changes in relative prices.
For an output price index, the index structure reflects substitutability in terms of production, reflecting how producers change their outputs in response to the prices they are receiving in the marketplace. For an input price index, the index structure reflects substitutability in terms of consumption, reflecting how producers change their inputs in response to the prices they are paying in the marketplace.
Adding Weights to an Index structure
The root level or elementary aggregate level of a price index is compiled by weighting price movements (or price relatives) between the reference period and current period by their shares of total value in the reference period. This is simply the alternative way of calculating a Lowe index.
In practise, the value aggregate for a product in period t is calculated by multiplying the reference period value aggregate \(P^0 q^0\) by the price relative for period \(t (p^t/P^0)\). This is simply the product of the reference period quantity and the period t price. Summing the value aggregates in period t and dividing by the sum of the value aggregates in the reference period yields the Lowe price index.
Price indexes measure the change over time in the total price of a fixed basket of products when considered in aggregate. For an input price index, the aggregate is of all products purchased while for an output price index the aggregate is of all products sold. It is important to note that the use of the term ‘fixed’ relates to the quantities underlying the reference period values (or more formally, the quantities in the reference period value aggregate) - it is, after all, the reference period quantities that are fixed in a Lowe index. Weights are expressed in terms of value shares because quantities are not meaningful or consistent across products. Further, value shares will change over time as the rate of price change varies across products.
Weights should be updated regularly to ensure the index remains representative of the market structure.
If held constant on a permanent basis, the weights would become less representative of the relative importance of products produced (or purchased) by producers the further the series moved away from the reference period. There would also be the problem of products that cease to exist and the entry of new products. Furthermore, the finer the level of detail, the less information that exists about the relative importance of products in the basket, which makes it more complicated to calculate weights at lower levels of the index.
To reduce these problems, weighting practises vary by the level of aggregation. Three distinct practises arise:
- Weights for the regimen level and above (also known as upper level weights) in which the implicit quantity weights are fixed between index reviews.
- Weights for the index structure between the regimen level and the elementary aggregate level (also known as lower level weights) which are subject to change, dependent on the outcome of a formal review process
- Weights for the individual specifications within an elementary aggregate (also known as micro-index weights) which are updated as required to ensure the specifications remain representative.
The role of classifications in weighting
Classifications play a vital role in determining the weights for price indexes. A classification not only helps determine the appropriate scope of the price index (and hence inclusions and exclusions from the value to be covered) but plays a critical role in defining a common language. That is, the classification is the common language that is used to relate the price index structure to its underlying value data.
The ABS use tools such as the Australian and New Zealand Standard Industry Classification to structure the Producer and International Trade Price Indexes on an industry basis, and further information on the applicable classification used for each Producer and International Trade Price Index can be found below.
Industry Focus
The Producer Price Indexes are structured and compiled on an industry basis and the structure of the output price indexes include both products primary to an industry, but also include secondary production products and therefore, the weights of output price indexes are inclusive of both primary and secondary product expenditure.
Chain of Representativeness
Price indexes are constructed using a sample of transactions for a range of product types to represent a broad range of economic activity. This “chain of representativeness” is discussed in more detail in the Sampling section. One outcome of using sampling is that the selected products represent not only themselves but also other related products not included in the selected sample.
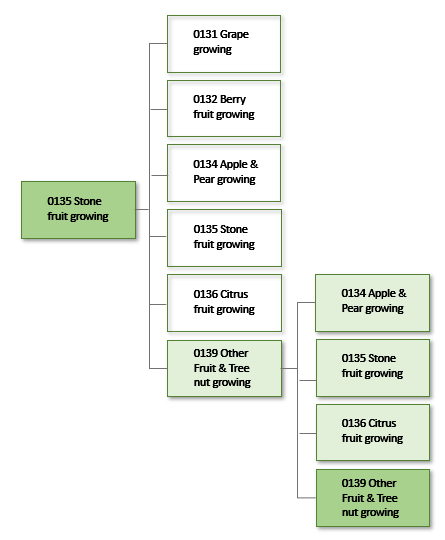
Some industries and products will have very small relative importance in terms of their share of total production. It may not be feasible to maintain a sample for these products, however their weight is still included in the overall index structure. This is achieved through the inclusion of empty node components. When empty node components are included in the index structure, they are weighted according to the value of the output (or input if it is an input price index) of the products represented by the component. When the index is compiled, the price movement of an empty node is derived by using the weighted average price movements of the sampled components within the product group to which the empty node belongs. This approach has the advantage of simplifying the inclusion of a component if it becomes feasible to collect a sample for that component.
An example of the empty node approach is illustrated in Figure 3.2 below, for Australian and New Zealand Standard Industry Classification Class 0139 Other Fruit and Tree Nut Growing (see Figure 6.2). In the example, not all products within the industry classification are included in the sample, specifically Other edible nuts (excluding Peanuts) nec. The value of Other edible nuts (excluding Peanuts) nec was $163.2m (2012-13), or 29.2% of the total value of Class 0139 Other Fruit and Tree Nut Growing. The value (price movement) of the empty node is derived by using the average price movements of the sampled components within the product group; which in this example would be derived from the price movements for bananas, orchard fruit and almonds and macadamias.
Figure 3.2 Empty node approach
Image
Description
Determining the weight reference period
The weighting structure of a price index plays a large part in determining the accuracy and reliability of the index. Key factors in selecting the period used to calculate the weights are:
- The economic activity over the period should be reasonably normal/stable and representative of likely future activity
- Close to the link period (the period where the weights are introduced to the index series).
The weight reference period and the link period used in a price index formula are rarely the same period in practise. For reasons of stability and representativeness, the weight reference period is frequently a year or longer period. New weights are introduced during a specific period, known as the link period. For a Lowe price index, weights are price updated to account for price changes between the weighting period and the link period.
For example, the Import Price Index is re-weighted each year using the most recent financial year data sourced from the ABS International Trade in Goods and Services publication. The updated data is incorporated into the Import Price Index in the September Quarter, which means that in the September quarter each year the weight reference period is updated to the previous financial year, and the weights are price updated to the September quarter to take into account the change in prices between the conclusion of the financial year each year and the three months ending the September quarter.
In satisfying the stability and representativeness criteria presented above, weights for the Producer and International Trade Price Indexes are sometimes taken from multiple periods. This practise is followed in those instances where a single year’s data may not be adequate, either because of unusual economic conditions (such as introduction of a new tax system), volatility observed in the marketplace or insufficient sample sizes from survey data. In such cases, an average of several years’ data provides the best weight reference period as it reduces the sampling and seasonal variance of the production or sales data for a given size of the annual sample. For example, whereas the Import Price Index uses weighting data from the most recent financial year, the Export Price Index uses data from the previous two years due to the volatility observed in key export commodities.
Frequency of weighting
The ABS periodically updates the weights of its price indexes to reflect changes in market structure. The faster the change in an economy’s market structure, the more frequently the weights in the indexes are updated.
Sourcing weighting data
The data used to create weights for price indexes are taken from various internal and external sources by the ABS. This section will explore the different weighting sources for the different index levels for the Producer and International Trade Price Indexes.
Upper-level weighting
Upper level weights are the weights that apply to the components of a price index structure between the root level and the regimen level. The weights, at the root level including the weight of the regimen level, are fixed in terms of underlying quantities until an index redesign takes place.
The majority of the Producer and International Trade Price Indexes use the Australian National Accounts or International Trade in Goods and Services as sources for upper level weights. For some Producer Price Indexes, the scope of activity covered by the price index does not align directly with the Australian National Accounts. This is particularly the case for the price index of Input to the house construction industry, which is weighted using a bills of quantity approach.
Lower-level weighting
Lower level weights are the weights that apply to the components of a price index structure below the regimen level down to the elementary aggregate. The weights, including the weight of the elementary aggregate (but not the price sample within the elementary aggregate) may be adjusted to reflect changes in either producer or purchaser behaviour in the market and hence changes in the relative importance of products in the basket. Furthermore, the effects of discontinued and new types of products can also be accommodated.
Product Specification weighting
The calculation of the broad price indexes starts with the measurement of the relative price change for an elementary aggregate, which represents the first level at which price observations are combined to calculate an index. At this level, weights are needed to combine individual price observations in order to calculate higher-level indexes. The elementary aggregate index covers all prices collected for one detailed product type. Each elementary aggregate is composed of price observations for products that are similar in terms of material composition, end use, and price behaviour.
It is important that the weight for each price observation covers the value of all products that the individual transaction represents. That is, most price observations will have a weight that represents other products and transactions in addition to the value of the sampled product alone. Micro-index weights are frequently adjusted to account for the introduction of new product varieties within a product type (such as a unit of sale or new flavour). Similarly, they are adjusted to account for the removal of discontinued individual product lines.
For example, consider an elementary aggregate for bottled beer for an output price index. The specifications within the elementary aggregate typically incorporate information on brewery, brand, bottle size and units of sale (such as 12 X750 ml bottles or 24 X375 ml bottles etc.). Through the process of sample selection, sampled products are selected to represent other products. A particular sampled product may be a best-selling brand of beer in a 24 X375 ml bottle carton; but the weight of the specification would include not only the value of sales of such a product but also the value of sales of other brand varieties sold by the particular brewery. The weight may also include the value of sales from other breweries.
In calculating such a weight, it is necessary to know several critical pieces of information regarding the values of transactions. Continuing the bottled beer example from above, the following data are required:
- the value of sales of the selected beer product (brewery, brand, size, units of sale)
- the value of sales of other brands of the same size from the selected brewery
- the value of sales of 24 X375 ml cartons of beer from other (non-sampled) breweries.
In general, value data (either revenue or expenditure) are required for the sampled product and also for any other products that are within scope of the elementary aggregate. Determining such information requires the co-operation of sample providers. The ABS generally collects this information via a personal visit during the activity known as a sample review.
The other key source of detailed product information used in micro-index weighting are industry associations, as described above for lower level weights.
Challenges in weighting product specifications
Determining value data at the product specification level is a difficult process that sometimes proves to be burdensome for sample providers. In addition, it can become an increasingly complex task to ensure that the micro-index weights are correctly maintained over time. Continuing the bottled beer example from above, the introduction of an immediately popular new brand (such as a boutique beer) requires collection of not only the sales revenue of the new product but also a measure of how the sales values of existing products have changed in response to the new competition. Collecting such information in a timely manner frequently proves difficult.
Equal weighting formulae
In the case where specification weighting might be difficult to achieve, an alternative is to adopt a micro-index formula where the sampled specifications have the same weight within an elementary aggregate. This process is currently applied to the Australian and New Zealand Standard Industry Classification Class 0400 Accommodation Producer Price Index.
Data sources currently employed by the ABS for weighting the Producer and International Trade Prices
Australian National Accounts Input-Output (I-O) tables
The key sources of data for upper level weights for the Producer Price Indexes are the Australian National Accounts I-O tables and a full overview of the I-O tables is provided above. The I-O tables are primarily used for the upper level weights for the Producer Price Indexes.
In addition to broad data from I-O tables, other data sources used to construct the Australian National Accounts aggregates are frequently used in the estimation of lower level weights for Producer Price Indexes. The Australian National Accounts component data are generally more complete in terms of consistent coverage and valuation bases. The data used for lower-level weighting are at a more detailed level than published Australian National Accounts data.
International merchandise trade data
The key sources of data for upper level weights for the ITPIs are the values of imported and exported products from Australia’s international merchandise trade statistics. These data are compiled (on a trade basis) from information submitted by exporters and importers or their agents to the Department of Home Affairs.
The conceptual framework used in compiling Australia's merchandise trade statistics can be found in International Merchandise Trade, Australia: Concepts, Sources and Methods.
For lower level weights, data provided by the Home Affairs is coded to very detailed levels of the Harmonised System (HS) trade classification. This data is used to construct representative weights for the lowest level of classification.
The use of International Merchandise Trade data for both upper and lower level weighting is described above. Data provided by Home Affairs is coded to very detailed levels of the Harmonised System (HS) trade classification. Value data at the product level is used to construct representative weights for the sampled products within the finest level of classification.
ABS economic surveys
ABS economic surveys are also used in the production of lower level weights for the Producer Price Indexes. These data typically provide information on type and characteristics of producers, as well as some detailed information on revenue. In addition, these ABS surveys frequently provide information regarding industry outputs in terms of quantity measures. Deriving lower level weights from these quantity data requires combination with measures of average prices.
Examples of the use of ABS survey data for lower level weights include:
- A range of revenue estimates from the program of Annual Integrated Collections are adopted to weight lower level components of the Services industry Producer Price Indexes.
- A range of quantity, expenditure and revenue estimates from the Building and Construction Statistics program are adopted to weight the lower level components of a number of different Producer Price Indexes, including the Output of the Construction Industries.
- Revenue estimates from the International Trade in Goods and Services are used in weighting the Services industry Producer Price Indexes, particularly regarding transport (freight) activities.
Australian Taxation Office
The Business Activity Statement is a tax return lodged with the Australian Taxation Office in respect of:
- Goods and Services Tax (GST)
- Pay as you go (PAYG) withholding and instalments
- Fringe benefits tax (FBT) instalments.
The Business Activity Statement must be lodged by all registered businesses, including government entities for each tax period. Since Goods and Services Tax is levied on revenue from sales, the Business Activity Statement data provide information on output (revenue) by size and type of business. These aggregate data can be incorporated into lower level weights for a range of Producer Price Indexes.
Bills of Quantity
Bills of quantity are documents produced in the building industry by professionals such as quantity surveyors. These documents break construction projects down into elements or products, and then quantify the inputs required for each product. In this way the types and quantities of materials required can be established. The price of the quantity of each specific material is determined so that the materials can be represented in value terms rather than as quantities.
The ABS use bills of quantity approach to select a basket of products to be priced each period and to derive weights for those products for its Construction Industries Producer Price Indexes.
For the Input to the House Construction Industry Producer Price Index, the ABS employs quantity surveyors to undertake this exercise for a selection of typical or representative house designs (for example, brick veneer house 100m2, double brick house 180m2 etc.). Product values for different house designs are then weighted together based on the relative shares of the different house designs in total house construction. Products are then aggregated into broad product types. The fixed basket (and hence the upper level weights) is then determined using the values of the broad product types. The bill of quantities approach is refined further in practise by allowing the share of construction of different house types to vary by capital city.
For the Output of the Construction Industry Producer Price Indexes, the bills of quantities approach is used as part of the process of determining lower level weights. Here the representative designs are not of houses but of residential and non-residential building types. Rather than restrict the bill of quantities to just building materials, the approach adopted in parts of the general construction price index includes work in place, which covers labour, plant and materials, plus margins.
Administrative data
A wide variety of administrative data on production values are available from public and private organisations and are now widely used by the Producer and International Trade Price Indexes to support lower level weighting. Examples of data obtained include: data for agricultural and mining activities, production and consumption of energy and outputs and consumption of transport services.
Industry associations
Another source for weighting data is industry associations. Many associations conduct surveys of their membership that include detailed information on value of sales by product. Alternatively, where production of a type of product is dominated by one or two large firms, the market shares for these firms can be a source of weighting data. Both types of data are adopted for use in Producer Price Indexes, particularly for the Services Industries.