Chapter 5 Historical and background
Introduction
This section of the release provides a detailed history of the development and changes of each price index within the current and historical suite of Producer and International Trade Price Indexes.
Economy-wide Producer Price Indexes
The headline measure for the Producer Price Indexes is the Final Demand (Excl. exports) Producer Price Index series. It is an economy wide price measure and is derived from the former Stage of Production (SOP) framework that was developed for the Producer Price Index publication. The SOP framework has been largely discontinued with the Final Demand (Excl. exports) price index the only remaining indicator from the framework currently in production.
This section provides a summary of the development of the SOP framework and its underlying methodology, which continues to inform upon the Final Demand (Excl. exports) Producer Price Index series.
Whole of economy measures
The Producer Price Indexes are largely a collection of industry-based price statistics that together, do not provide a whole of economy perspective of supply side price change for users. In response to this limitation in the Producer Price Indexes, the ABS developed a set of economy wide price indexes using a Stage of Production approach.
Final Demand and the Stage of Production Approach
Under the Stage of Production concept, flows of products are categorised according to their economic destination on a sequential basis along the production chain. The basis for the categorisation is the Australian National Accounts: Input-Output Tables.
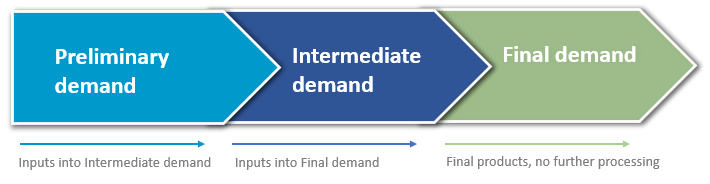
Transactions (flows of products) are placed in one of three stages:
- Stage 3 (Final) becomes Final Demand, i.e. products consumed as Final Demand, with no further processing
- Stage 2 (Intermediate) becomes Intermediate Demand, i.e. products consumed as inputs into the production of Final Demand
- Stage 1 (Preliminary) becomes Preliminary Demand, i.e. products consumed as inputs into the production of Intermediate Demand.
Re-weights:
- From the September quarter 2015 the SOP indexes weights were updated using data from the 2012–13 Australian National Accounts: Input–Output (I–O) Tables.
- March quarter 2022 the Final Demand index weights were updated using data from the 2018–19 Australian National Accounts: Input–Output (I–O) Tables.
Image 5.1 Stage of production process
Image
Description
The three stages of production are not aggregated in order to avoid the potential distorting effects that may result from multiple counting of changes in transaction prices as products flow through different production processes.
Under this framework, preliminary products are used either directly or indirectly in the production of intermediate products; in turn intermediate products flow into the production of final products.
The framework allows for analyses of price change as products flow through production processes. Price changes for earlier stages of production may be indicators of possible future price changes for later stages.
Transaction Flow Approach
The ABS has adopted a transaction flow approach for partitioning the flow of individual products into the different production stages. Under this approach the stage of production in which a transaction is placed is determined by where the product is consumed.
For example, exported wheat and domestically used wheat are treated as different products for index construction purposes. Exported wheat is treated as a Final demand product while wheat to be processed domestically to make flour is considered to be a Preliminary demand product. Similarly, a product such as energy can appear within all three stages of demand.
Scope and Coverage
As the focus is on domestic inflation, exports are excluded from the headline ‘Final Demand', as presented in the key figures on the front page and in Tables 1 & 5 in the quarterly publication.
Import transactions are included within the framework, recognising that they represent an important potential source of inflationary pressure.
The Final Demand concept incorporates all flows of transactions within the economy and it measures prices in basic prices, as it is an output price index.
Products and weights
The basis of the weights for Stage of Production framework is the use table from the Australian National Accounts: Input-Output Table framework. The products included in the stages, for both domestic supply and imports are given proportional weights that reflect the values of product flows.
The current methodology used for deriving Stage of Production weights can be found in Appendix 2 of the Implementation of the Review of the Producer and International Trade Price Indexes, 2012.
From the September quarter 2015 the Stage of Production indexes weights were updated using data from the 2012–13 Australian National Accounts: Input–Output Tables.
Historical development and changes
Producer Price Indexes for the supply of products to the Australian economy within a Stage of Production framework were first published in Stage of Production Producer Price Indexes, Australia. The Stage of Production indexes enable analysis of the pass through of price change of output products to the price change of final products. This publication commenced in July 2000 and presented price indexes compiled from September 1998. The Stage of Production index model brings together the range of detailed price data contained in the separate industry indexes to enhance the analytical value of the data. The Stage of Production framework is based on an economic categorisation of transactions according to their sequencing in the production chain.
These indexes are compiled within the statistical framework outlined in the Information Paper: An Analytical Framework for Price Indexes in Australia, 1997 and were designed to support the study of price inflation.
A more detailed explanation of the Stage of Production concept is contained in the Information Paper: Producer Price Index Developments was released on 25 March 1999.
The weights of the indexes were initially sourced from the 1994-95 Australian National Accounts: Input–Output Tables and presented with an index reference period of 1998-99 = 100.0.
The Stage of Production indexes were reviewed in 2002 and the changes introduced from the December quarter 2002. The weights of the revised series were sourced from the 1996-97 Australian National Accounts: Input–Output Tables.
Following the Outcome of the Review of the Producer and International Trade Price Indexes, 2012 and the subsequent Implementation of the Review of the Producer and International Trade Price Indexes, 2012, the weights were updated with data sourced from the 2007-08 Australian National Accounts: Input–Output Tables in the September quarter 2012 and the indexes were re-referenced to 2011-12 = 100.0.
In addition, the Stage of Production indexes were reclassified to align with the Australian and New Zealand Standard Industrial Classification, 2006. The implementation of the updated classification model resulted in some restructuring and/or renaming of previous Australian and New Zealand Standard Industrial Classification, 1993 series and the discontinuation of old series and introduction of new series. However, while the underlying concepts have remained unchanged, the Stage of Production stages were renamed to reflect the relationship of the stages of production:
- Stage 3 (Final) became Final Demand, i.e. products consumed as Final Demand, with no further processing
- Stage 2 (Intermediate) became Intermediate Demand, i.e. products consumed as inputs into the production of Final Demand
- Stage 1 (Preliminary) became Preliminary Demand, i.e. products consumed as inputs into the production of Intermediate Demand.
From 2020, the Stage of Production framework was reduced to Final Demand in the Producer Price Indexes publication with Preliminary Demand and Intermediate Demand discontinued.
Manufacturing industries Producer Price Indexes
Output of the Manufacturing industries
The price indexes of articles produced by manufacturing industries were first published in June 1976 in the Price Indexes of Articles Produced by Manufacturing Industry, Australia (cat. no. 6412.0), with monthly indexes compiled from July 1968. The structure and weights of the indexes were sourced from the value of production in 1971-72 (as reported in the 1971-72 Census of Manufacturing Establishments). The index reference period was 1968-69 = 100.0.
The index was reviewed in 1990 with changes implemented from May 1990. The weights for this index were sourced from the value of production in 1986-87 (as reported in the 1986-87 Census of Manufacturing Establishments). The index reference period was 1988-89 = 100.0.
The frequency of these indexes was changed from monthly to quarterly from the September quarter 1997.
These indexes were again reviewed in 2000. The products included in the indexes were selected based on the values of articles produced in 1993-94. The selected products were allocated weights in accordance with the estimated value of manufacturing production in 1993-94 valued at the prices applicable in the June quarter 2000. The indexes were re-referenced to 1989-90 = 100.0.
From the September quarter 2000 the presentation of these indexes was changed to reflect the updated weighting patterns and the adoption of ANZSIC 1993. The new weights for the manufacturing division indexes and the associated ANZSIC subdivision and group price indexes were shown in Appendix B of the September quarter 2000 issue of Price Indexes of Articles Produced by Manufacturing Industry, Australia (cat. no. 6412.0).
The publication Price Indexes of Articles Produced by Manufacturing Industry, Australia (cat. no. 6412.0) was combined with several other PPI publications in the June quarter 2001 to form a new publication Producer Price Indexes, Australia (cat. no. 6427.0). The latter publication presented an economy wide framework for PPIs, with the Stage of Production (SOP) indexes as the headline indicators.
From the September quarter 2012 the presentation of the indexes was changed to reflect the 2006 edition of ANZSIC and weights were updated using data from the 2007–08 Australian National Accounts: Input–Output (I–O) Tables. The index of articles produced by manufacturing industries, was renamed Output of the Manufacturing industries and the index reference period updated to 2011–12 = 100.0.
Re-weights:
- September quarter 2015 the Output of the Manufacturing industries index weights were updated using data from the 2012–13 Australian
- March quarter 2022 the Output of the Manufacturing industries index weights were updated using data from the 2018–19 Australian National Accounts: Input–Output (I–O) Tables.
Input to the Manufacturing industries
The Price Indexes of Materials Used in Manufacturing Industries, Australia (cat. no. 6411.0) was first published in April 1975. The index reference period was 1968-69 = 100.0 and had weights sourced from the value of estimated manufacturing materials usage in 1971-72. Monthly index numbers were compiled for the period July 1968 to November 1985. A description of this series, including its composition and weighting pattern, was provided in the April 1975 issue of Price Indexes of Materials Used in Manufacturing Industries, Australia (cat. no. 6411.0).
The indexes were reviewed in 1985, with their composition and weights sourced from values of materials used in manufacturing in 1977-78. The reviewed indexes were introduced from December 1985 with an index reference period of 1984-85 = 100.0.
The indexes were reviewed again in 1996. This review resulted in several changes to the indexes. The underlying classification of the indexes was changed from the Australian Standard Industrial Classification (ASIC) 1983, to ANZSIC 1993. The composition and weights of the indexes were sourced from values of materials used in 1989-90. The indexes were also re-referenced to 1989-90 = 100.0. Index structures and weights were shown in Appendix A of the July 1996 issue of Price Indexes of Materials Used in Manufacturing Industries, Australia (cat. no. 6411.0).
The frequency of these indexes was changed from monthly to quarterly from the September quarter 1997.
The Price Indexes of Materials Used in Manufacturing Industries, Australia (cat. no. 6411.0) was discontinued and data included in Producer Price Indexes, Australia (cat. no. 6427.0) from the June quarter 2001.
From the September quarter 2012 the presentation of the indexes was changed to reflect the 2006 edition of ANZSIC and weights were updated using data from the 2007-08 I-O tables. The index of Materials used in manufacturing industries was renamed to Input to the Manufacturing industries and the index reference period updated to 2011-12 = 100.0.
Re-weights:
- September quarter 2015 the Input to the Manufacturing industries index weights were updated using data from the 2012–13 Australian National Accounts: Input–Output (I–O) Tables.
- March quarter 2022 the Input to the Manufacturing industries index weights were updated using data from the 2018–19 Australian National Accounts: Input–Output (I–O) Tables.
Price indexes of Copper materials - discontinued
The price indexes of copper materials were first published in the October 1972 issue of Price Indexes of Metallic Materials (cat. no. 6410.0) as the Price Indexes of Copper Materials Used in the Manufacture of Electrical Equipment. The indexes were published for the period July 1968 to August 1983 and presented with an index reference period of 1968-69 = 100.0. The October 1972 issue of Price Indexes of Metallic Materials (cat. no. 6410.0) and in Labour Report No. 57, 1972 (cat. no. 6101.0) also included the weights of the indexes.
The publication Price Indexes of Metallic Materials (cat. no. 6410.0) was discontinued from September 1983 to May 1984 due to deficiencies in the price samples.
Revised indexes with an index reference period of 1983-84 = 100.0 were introduced in June 1984. Data were published monthly, with an historical series from July 1983. The Appendix to the June 1984 issue of Price Indexes of Metallic Materials, Australia (cat. no. 6410.0) provides a detailed description of the revised indexes, including their structure and weights.
In January 1986, the title of the publication was changed and the series for the other metallic materials (iron and steel, aluminium, copper and brass, and zinc) were included in Price Indexes of Materials Used in Manufacturing Industries, Australia (cat. no. 6411.0).
The indexes have been compiled and released on a quarterly basis since the September quarter 1997.
In 2002 the indexes were re-weighted using data from the 1998-99 financial year and re-referenced to 1989-90 = 100.0.
The Price Indexes of Materials Used in Manufacturing Industries, Australia (cat. no. 6411.0) (which contained the price indexes of copper materials) was discontinued and indexes published from the June quarter 2001 in the Producer Price Indexes, Australia (cat. no. 6427.0). The price index of copper materials was made available only in electronic form.
As a result of the PPI and ITPI 2012 Review, two subsidiary indexes; Copper input to the other electrical equipment manufacturing industry and Metallic input to the fabricated metal product manufacturing industry have been discontinued from the September quarter 2013.
Construction industries Producer Price Indexes
Output of the Construction industries
A price index for the Output of the Building Industry was first published in the June quarter 2001 issue of Producer Price Indexes, Australia. The index was published as the aggregate of three Australian and New Zealand Standard Industrial Classification, 1993 industry classes:
- Class 4111 – House Construction
- Class 4112 – Residential Building Construction n.e.c.
- Class 4113 – Non-Residential Building Construction
The aggregate index was presented with an index reference period of 1998-99=100.0 and the weighting structure was derived from the 1996-97 Australian National Accounts: Input–Output Tables for the national level, and for state and territory weights, Building Activity Construction Survey data for 5 years ending 1998-99 was sourced from the ABS.
From September 2002, the series for 'Output of the Building Industry', based upon Australian and New Zealand Standard Industrial Classification, 1993 industry Group 411 – Building Construction was published alongside the three industry classes noted above. In addition, a new series for Group 412 – Non-Building Construction was published, which was inclusive of Class 4121 – Road and Bridge Construction.
A review of the suite of the Output of the Building Industry Producer Price Indexes was undertaken in 2007 with several changes then implemented in the December quarter 2007.
The new weights of the indexes at the Industry class level for Australia were primarily sourced from the 2001-02 Australian National Accounts: Input–Output Tables. State level weights were sourced from the Building Activity Construction Survey over the 2005-06 calendar years.
Following the Outcome of the Review of the Producer and International Trade Price Indexes, 2012 and the subsequent Implementation of the Review of the Producer and International Trade Price Indexes, 2012, the price indexes were renamed from Output of the Building Industry to the Output of the Construction Industries to align with the Australian and New Zealand Standard Industrial Classification, 2006.
The current suite of the Output of the Construction Industries Producer Price Indexes are:
- Group 30 – Building Construction
- Class 3011 – House Construction
- Class 3019 – Other Residential Building Construction
- Class 3020 – Non-Residential Building Construction
- Group 31 – Heavy and Civil Engineering Construction
- Class 3109 – Other Heavy and Civil Engineering Construction
- Class 3101 – Road and Bridge Construction
The weighting basis for the Output of the Construction Industries were updated to the 2007-08 Australian National Accounts: Input–Output Tables at the national level, with state and territory weights derived from the Building Activity Construction Survey over the 2010-11 calendar years. The indexes were also given an updated index reference period of 2011-12 = 100.0.
The Output of the Construction Industries were re-weighted in 2020 to include the following weighting sources:
- Building construction indexes were re-weighted at the state and class levels in the June quarter 2020, using Building Activity and Building Approvals data.
- Heavy and civil construction indexes were re-weighted at the state and class level in the March quarter 2020, using Engineering construction survey data.
The Output of the Construction Industries were re-weighted in September quarter 2022.
Input to the House construction industry
The price index of materials used in house building was first published in September 1970 and was presented with an index reference period of 1966-67 =100.0. The weights were sourced from estimated materials usage in 1968-69. Monthly index numbers were compiled for the period July 1966 to September 1986. A description of the index, including its composition and weighting pattern, was given in the Price Index of Materials Used in House Building, Six State Capital Cities (cat. no. 6408.0), and in Labour Report No. 55, 1970 (cat. no. 6101.0).
The index was reviewed in 1986 and a new series introduced from October 1986. This series was linked to the previous series. This series was presented with an index reference period of 1985-86 = 100.0 with weights sourced from estimated materials usage in 1985-86. A description of this series was provided in the October 1986 issue of Price Index of Materials Used in House Building, Six State Capital Cities (cat. no. 6408.0).
The index was reviewed in December 1995. It was re-referenced to 1989-90 =100.0 and was linked to the previous series.
The indexes have been compiled and released on a quarterly basis since the September quarter 1997.
The Price Indexes of Materials Used in House Building, Six State Capital Cities (cat. no. 6408.0) was discontinued and the index published in Producer Price Indexes, Australia (cat. no. 6427.0) from the June quarter 2001.
In December 2005, the index was again reviewed. This review saw the structure of the index changed to reflect building material usage observed in the three years ending 2002-03. Capital city weights were updated to reflect building patterns observed in the six state capitals in 2003-04. The resulting weights were price updated to the September quarter 2005 by adjusting each by the ratio of the price in the September quarter 2005 to the average price in 2003-04.
From the September quarter 2012, this index was renamed from Materials Used in House Building to Input to the house construction industry and re-referenced to 2011-12 = 100.0.
The Input to the House construction industry price index was re-weighted in the December quarter 2013. The weights for the Input to the House construction industry price index were derived from representative housing construction activity for the average of the three years ending 2010-11. The weighting patterns for each capital city index reflects variations in the prices for the cities as applied to an Australian (6 capital cities) weighted average of house construction inputs. The updated weighting patterns were calculated using bill of quantities data for three years ending 2010-11 obtained from quantity surveyors. These quantities were price updated to 2012-13 and then benchmarked to the Building Activity, Australia (cat. no. 8752.0) total value work done for houses, by capital city.
The Input to the House Construction Industry price index were last reweighted in the September 2020 quarter.
Mining industries Producer Price Indexes
Input to the Coal mining industry
The Price Indexes of Materials Used in Coal Mining, Australia (cat. no. 6415.0) was first published in February 1989 and presented with an index reference period of 1987-88 = 100.0. The indexes were compiled for each month from July 1988.
The indexes have been compiled and released on a quarterly basis since the September quarter 1997.
In 2001 the indexes were re-weighted to reflect estimated average use of materials in coal mining over the 1999-2000 financial year and re-referenced to 1989-90 = 100.0.
The Price Indexes of Materials Used in Coal Mining, Australia (cat. no. 6415.0) were discontinued and the data published, from the June quarter 2001, in Producer Price Indexes, Australia (cat. no. 6427.0).
From the September quarter 2012, this index was renamed from Materials used in coal mining to Input to the coal mining industry and re-referenced to 2011-12 = 100.0.
Open cut mining and Underground mining have been discontinued and combined into one index for Input to the Coal mining industry as a result of the PPI and ITPI 2012 Review. The index was updated in the September quarter 2013 to ANZSIC 2006 and weights were sourced from the 2007-08 I-O tables.
Re-weights:
- September quarter 2015 the Input to the Coal mining industry index weights were updated using data from the 2012–13 Australian National Accounts: Input–Output (I–O) Tables.
- June quarter 2023 the Input to the Coal mining industry index weights were updated using data from the 2020–21 Australian National Accounts: Input–Output (I–O) Tables.
Output of the Mining Industry
Following the significant development of the Australian domestic and export gas industry, the ABS developed and implemented an Output of the Mining Industry Producer Price Index. The focus of the Output of the Mining Industry Producer Price Index is Australian and New Zealand Standard Industrial Classification, 2006 industry Subdivision 07 – Oil and Gas Extraction.
The Output of the Mining Industry Producer Price Index release provides three output price index series:
- Domestic Gas Extraction, Australia
- Domestic Gas Extraction, East Coast
- Domestic Gas Extraction, West Coast
The Output of the Mining Industry was first published in the September 2017 release of the Producer Price Indexes publication. The index measures prices of domestic gas extraction.
The time series begins in the September quarter 2015 and the index reference period 2015-16 = 100.0.
For more information on the development and implementation of the Output of the Mining Industry please refer to the following publication - Introduction of the Output of the Mining index.
Re-weights:
- March quarter 2022 the Output of the mining industry index weights were updated using data from the 2018–19 Australian National Accounts: Input–Output (I–O) Tables
Services industries Producer Price Indexes
Price indexes for the Output of service industries are a comparatively new developments and to date are compiled for a selection of services industries.
Quarterly price index numbers for services industries were first published in the March quarter 2000 for the Transport (Freight) and Storage Industries (ANZSIC 1993 Division I) and the Property and Business Services Industries (ANZSIC 1993 Division L).
Indexes were first published in Producer Price Indexes for Selected Service Industries, Australia (cat. no 6423.0). The index structure and weights were sourced from the 1994-95 I-O tables, and presented with an index reference period of 1998-99 = 100.0.
The Producer Price Indexes for Selected Service Industries, Australia (cat. no 6423.0) was discontinued and the data published, from the June quarter 2001, in the Producer Price Indexes, Australia (cat. no. 6427.0).
The price indexes for the output of services industries were reviewed in 2002. From the June quarter 2002, the index structure and weights were sourced from the 1996-97 I-O tables. This review also saw significant improvements in coverage of these price indexes.
Additional service industry price indexes have been developed since September quarter 2012 as part of an ongoing program to improve service industry price measurement. The indexes were also updated in the September quarter 2012 to ANZSIC 2006 and weights were sourced from the 2007-08 I-O tables. The indexes were re-referenced to 2011-12 = 100.0.
Re-weights:
- September quarter 2015 the additional service industries index weights were updated using data from the 2012–13 Australian National Accounts: Input–Output (I–O) Tables.
- March quarter 2022 the service industries index weights were updated using data from the 2018–19 Australian National Accounts: Input–Output (I–O) Tables.
Childcare Services Cost Index
The Childcare Services Cost Index (CSCI) measures change in prices paid by childcare providers for the goods, services and labour they purchase to provide childcare services to households. The Index measures these costs from the perspective of businesses providing childcare services.
In May 2024, the ABS was funded to develop and publish this index. From December quarter 2024, an Australia level CSCI is published each quarter as a supplement to the Producer Price Indexes (PPI), together with the quarterly and annual percentage change movements in Table 37. More details can be found within Introducing a new Childcare Services Index, released as an information paper together with the September 2024 PPI publication.
The results of the CSCI are used as a guide for determining the annual fee growth limit under the Early Childhood Education and Care Worker Retention Payment program. Under this program, over two years, the Government will fund wage increases for the Early Childhood Education and Care (ECEC) workforce of 15% above the modern award rates. Providers who opt-in to this program must meet a range of conditions, as specified in the Grant Guidelines, including a fee constraint condition limiting annual fee increases.
The CSCI is not used as a source of data for the Final demand index.
International Trade Price Indexes
Export price index
Export price measures have been published by the ABS since 1901 and was published annually from 1901 to 1929-30 as a current weighted unit value index and then a fixed weighted index. An index of export prices was not published again until 1937, when a new series was introduced. This series continued until 1962.
A fixed weighted index was introduced in August 1962 and presented with an index reference period of 1959-60 = 100.0. It was replaced by an interim index that was published from July 1969 until June 1979.
The next re-reference was to 1974-75 = 100.0 and was published on this basis until August 1990.
The monthly publication Export Price Index, Australia (cat. no. 6405.0) was introduced in September 1990 and index numbers were compiled from July 1989. The index was referenced to 1989-90 = 100.0.
The indexes have been compiled and released on a quarterly rather than monthly basis since the September quarter 1997.
The export price index was reviewed in 1999. The main purpose of the review was to ensure that the index satisfied key user requirements. Information Paper: Review of the Import Price Index and Export Price Index (cat. no. 6424.0) was released in November 1999 and outlined the key objectives of the review and sought user feedback. The broad outcomes of the review are outlined in an Appendix to the June quarter 2000 issue of the Export Price Index, Australia (cat. no. 6405.0). One of the results of the review was a move to an annually re-weighted chained index, whereby each September quarter the weights of the index are updated to reflect the average value of export items in the previous two financial years, due to the greater volatility associated with the value of export items.
In the June quarter 2001 Export Price Index, Australia (cat. no. 6405.0) was combined with Import Price Index, Australia (cat. no. 6414.0) into a single publication, International Trade Price Indexes, Australia (cat. no 6457.0).
In the September quarter 2012 the EPI was re-referenced to 2011-12 = 100.0.
Import price index
Import price indexes were published by the Reserve Bank of Australia (RBA) from 1928 until September 1982.
The first index of import prices produced by the ABS was introduced in May 1983. Index numbers were published in Import Price Index, Australia (cat. no. 6414.0). This index was compiled quarterly from the September quarter 1981 until the June quarter 1991 and presented with an index reference year of 1981-82 = 100.0.
A re-weighted index of import prices was introduced in September 1991 with index numbers compiled monthly from April 1991 until June 1997. This index was referenced to 1989-90 = 100.0. The source of the weights was the average value of merchandise imports landed in Australia during 1988-89 and 1989-90.
The indexes have been compiled and released on a quarterly basis since the September quarter 1997.
In 1999, a review of the index was undertaken with the findings published in Information Paper: Review of the Import Price Index and Export Price Index (cat. no. 6424.0). One of the results of the review was a move to an annually re-weighted chained index, whereby each September quarter the weights of the index are updated to reflect the average value of merchandise imports landed in Australia in the previous financial year. From the September quarter 2012, the index is referenced to 2011-12=100.0.
In the June quarter 2001 Import Price Index, Australia (cat. no. 6414.0) was combined with Export Price Index, Australia (cat. no. 6405.0) into a single publication International Trade Price Indexes, Australia (cat. no. 6457.0).
In the September quarter 2012 the ITPIs were re-referenced to 2011-12 = 100.0.