Seasonal adjustment for the new complete Monthly Consumer Price Index (CPI)
Understand the seasonal adjustment approach that will be used in the complete Monthly CPI
Summary
The Australian Bureau of Statistics (ABS) is moving from quarterly publications of the Consumer Price Index (CPI) to a complete Monthly CPI from the October 2025 reference month to be published on 26 November 2025. To make this change, the ABS moved to collecting almost all prices monthly from April 2024[1]. Previously, only around a half of the CPI basket of goods and services were collected monthly (with another around one-sixth remaining current because these prices are updated less frequently than monthly). The additional monthly data underpins the shift to a robust, reliable, internationally-comparable, complete Monthly CPI, which will become Australia’s primary measure of headline inflation.
The Monthly CPI will provide a more frequent and timelier read of inflation. The monthly series will also be more volatile than the quarterly because it is more responsive to price changes. The effects of major sales events and other regular yearly price changes (seasonal effects), and short-term irregular price fluctuations, will be captured more clearly in the Monthly CPI.
The ABS will produce seasonally adjusted monthly series to aid users in understanding how month-to-month price changes compare to what usually occurs at that time of year in order to support the interpretation of the Monthly CPI. Seasonally adjusted series also underpin the calculation of the Trimmed mean and Weighted median, which are measures of underlying inflation.
Some series at the Expenditure Class (EC) level will be too short to enable them to be seasonally adjusted using the ABS’ standard methods when the Monthly CPI is first published. This article provides an overview of the methods that will be used to manage strong seasonality that is likely to impact a small share of the CPI (by weight) through to April 2027. While these interventions will remove instances of strong seasonality, there is still likely to be some residual seasonality in the All groups, seasonally adjusted series that will not be accounted for in the short term. Over time, seasonal adjustment quality will improve.
Importantly, ABS analysis, included in this paper, provides evidence that the monthly Trimmed mean may be largely unaffected by any strong seasonality that has not been accounted for in those ECs with a short time series. The paper also includes comparisons between the quarterly average of the unpublished monthly Trimmed mean and the published quarterly Trimmed mean movements for the three quarters for which we have data. This analysis, based on three quarters, demonstrates that the two are within 0.05 percentage points of each other for each of the three quarters.
Background
Seasonal adjustment of the CPI
The Australian CPI is composed of price indexes for 87 ECs. The month-to-month variation of some of these 87 ECs can be affected by strong seasonal price variation at various times of the year, such as the short-term effects of end-of-financial-year sales. Users often wish to understand underlying price changes after removal of these expected seasonal patterns (known as seasonal adjustment). These seasonally adjusted series can help answer the question: ‘how does this price change compare to the price changes that usually occur at this time of year?’
The All groups seasonally adjusted, Trimmed mean and Weighted median are key analytical series built up from seasonally adjusted ECs. The Trimmed mean and Weighted median, as measures of ‘underlying’ inflation, provide an indication of the near-term trajectory of inflation and are based on the distribution of monthly EC movements after seasonal adjustment. The Trimmed mean is calculated using a weighted average of the EC percentage changes in the middle 70 per cent of the distribution. That is, seasonally adjusted ECs with a cumulative total below 15 per cent and above 85 per cent are excluded (trimmed) from the calculation. The Weighted median is simply the seasonally adjusted monthly percentage change of the EC at (or immediately over) the 50th percentile of the distribution. More information on their calculation is here: Underlying Inflation Measures: Explaining the Trimmed Mean and Weighted Median.
Transitioning to a complete Monthly CPI
The ABS was funded to transition to a complete Monthly CPI in the 2023-24 Budget, as part of the Big Data, Timely Insights: Phase 2 (BDTI2) transformation program. The funding has enabled the ABS to replace the old IT systems currently used to produce the CPI with modernised, efficient statistical processing capabilities built in the cloud and to ramp up price collection activities needed to shift from the quarterly to complete Monthly CPI.
In April 2024, the ABS increased the frequency of price collection within 44 of the 87 Expenditure Classes (ECs), transitioning them to a complete monthly collection. As shown in Figure 1 below, the majority of the other ECs were already collected monthly or annually and did not need to be changed for inclusion in the Monthly CPI.
Figure 1 - Change in frequency of data collection for the CPI
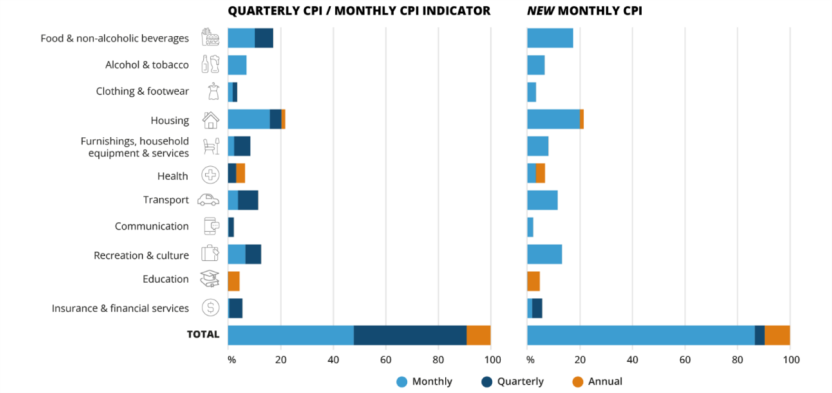
Note: 87% of the CPI by weight will be collected monthly in the complete Monthly CPI. Annual collection will continue for 9% of the CPI, including health insurance, education fees and property rates. Quarterly collection will continue for 4% in Other financial services (items such as stamp duty, real estate services and accounting services), as these prices do not tend to change frequently.
Beginning this additional data collection in April 2024 will enable the ABS to produce comprehensive annual and monthly inflation data from the commencement of publication of the Monthly CPI in November 2025. However, the time series for the 44 ECs that converted from quarterly to monthly data collection will be shorter than the 3 years required for the application of the standard seasonal adjustment methods used by the ABS and other National Statistical Organisations.
As explained in this article, the ABS will be applying some statistical methods to manage seasonality for the ECs with a short time series. Application of the methods described will enable aggregated seasonally adjusted and underlying inflation measures to be published from the commencement of the complete Monthly CPI to support the analytical needs of users.
Seasonally adjusting short time series in the complete Monthly CPI
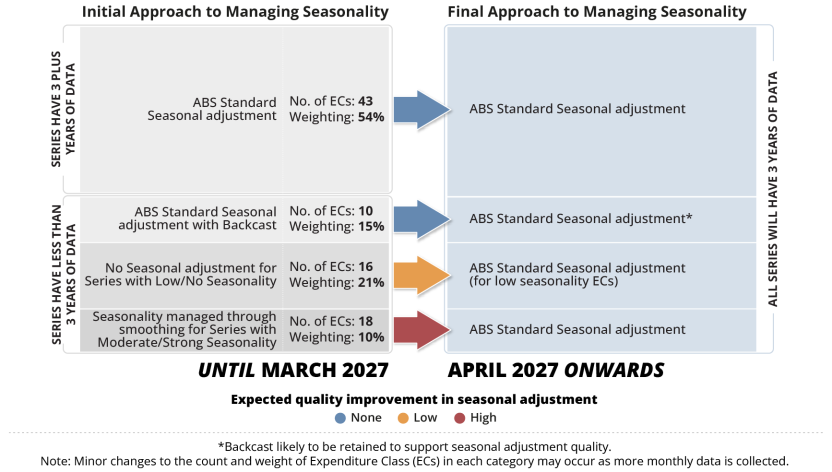
ABS standard practice is to not seasonally adjust short time series and to not produce analytical measures based on them until those series have reached a minimum length, usually 3 to 5 years. However, for the new Monthly CPI, it is appropriate and feasible to apply initial methods to manage seasonality from the beginning of publication. The features that the ABS took into consideration in making this decision included that:
- Over half the weight of the Monthly CPI basket can be reliably seasonally adjusted based on established monthly data for those ECs (43 ECs, or 54% of the CPI).
- ABS has sufficient objective information and data, including the quarterly history and in some cases partial monthly history, to support the creation of backcasts to enable seasonal adjustment via standard methods, for a further 10 of the new monthly ECs (15% of the weight of the CPI). See appendix A for more information on this approach.
- ABS’ expectation, based on knowledge of the series and their quarterly history, is that another 16 ECs (21% of the weight of the CPI) will likely have low or no identifiable seasonality on a monthly basis.
- For the remaining 18 ECs (10% of the weight of the CPI), it will be possible to smooth out large movements to prevent them from distorting the monthly All groups seasonally adjusted, Trimmed mean and Weighted median series. These ECs are expected to display moderate to strong seasonality which cannot be removed via standard methods. An understanding of known sales periods and other seasonal price influences will instead be used to determine when large movements in particular months will be smoothed out. See Appendix B for more information on this approach.
Figure 2 – Approach to managing seasonality for the Monthly CPI
The application of these initial methods will enable ABS to ultimately remove most of the seasonal effects from the Monthly CPI basket from the time of first publication. This will support the production of the All groups seasonally adjusted measure of sufficient quality to usefully improve interpretation and understanding of the month-to-month behaviour of the Monthly CPI.
In April 2027, once all ECs have reached 3 years in length, standard seasonal adjustment methods will be used for all ECs, improving seasonal adjustment quality. This may lead to larger than usual revisions to the 3-year history of the All groups Seasonally adjusted, Trimmed mean, Weighted median, affected ECs and any calculated aggregates that include these ECs at this time. The quality of seasonal adjustment will continue to improve as the EC series grow beyond this minimum 3-year length.
What impact could the ECs with short time series have on the quality of key measures?
Seasonal adjustment and quality of the Trimmed mean
The Trimmed mean is calculated using seasonally adjusted ECs which improves the quality of this measure. The use of seasonally adjusted series helps ensure that the Trimmed mean can better reflect, over time, the rate of underlying inflation looking through seasonal movements occurring in some ECs. As noted above, there may be some residual seasonality in some ECs up until standard seasonal adjustment techniques can be applied from April 2027, which could affect the monthly Trimmed mean. ABS analysis below indicates that moderate to strong seasonality remaining in a small portion of the basket in particular months should have only a small effect on the Trimmed mean. For more information see: Underlying Inflation Measures: Explaining the Trimmed Mean and Weighted Median | Australian Bureau of Statistics.
Figure 3 indicates that whether large seasonal monthly movements in approximately 10% of the basket are smoothed (removed) or not before trimming has little influence on the Trimmed mean index. What Figure 3 below demonstrates is that using Monthly CPI data from April 2024 to March 2025, applying the smoothing approach outlined above results in no more than a 0.05 percentage point difference between the Trimmed mean monthly movements in any month, and less than 0.01 percentage point cumulative difference between April 2024 and March 2025.
Figure 3 – Monthly Trimmed mean index impact of smoothing
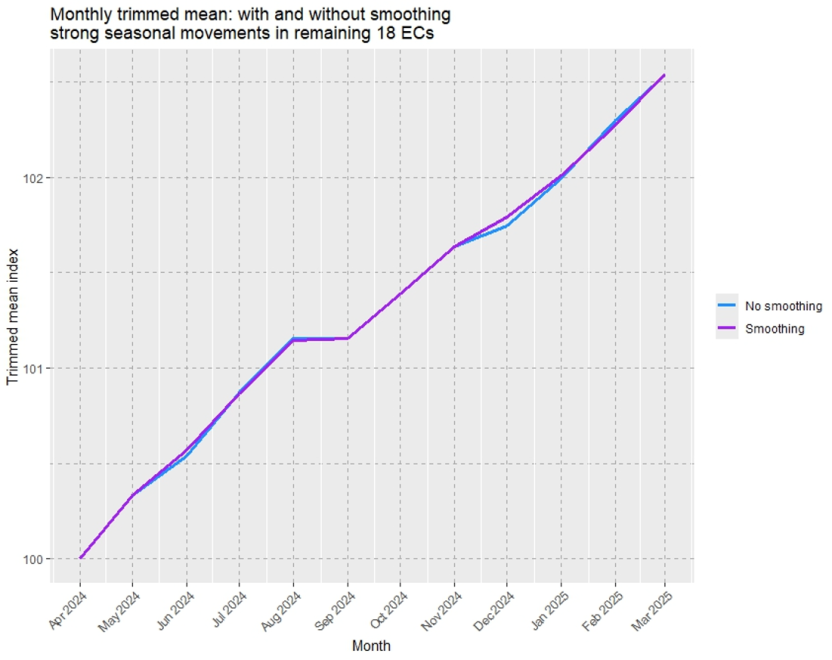
*Note that the above analysis is based on preliminary data used for analysis purposes, and final published figures may vary slightly from the data presented here.
In addition, ABS analysis shows that in each of the 3 quarters of data available – September Quarter 2024 to March Quarter 2025 – there is at most a 0.05 percentage point difference between the quarterly Trimmed means published and quarterly Trimmed means derived from the new monthly Trimmed mean series.
| Quarter | Quarterly average of the monthly Trimmed mean series | Quarterly Trimmed mean published in March quarter 2025 CPI | Difference (percentage point)* |
|---|---|---|---|
| September Qtr 2024 | 0.75% | 0.81% | 0.05 |
| December Qtr 2024 | 0.54% | 0.54% | -0.01 |
| March Qtr 2025 | 0.66% | 0.68% | 0.02 |
*Note that there may be slight differences in the percentage point difference and the total in the first two columns due to rounding.
Like all measures produced based on seasonal adjustment, Trimmed mean measures are routinely revised. However, the revisions are expected to be relatively small in size once standard seasonal adjustment methods are able to be applied in April 2027.
Seasonal adjustment and quality of headline Monthly CPI
Headline CPI measures of inflation are published in original terms (i.e. they are not seasonally adjusted) and are therefore not affected by seasonal adjustment quality. The ABS has never revised the headline CPI and, as stated on the ABS’ website, would only do so in “exceptional circumstances, such as to correct a significant error”. Monthly and quarterly measures of change in original terms will contain seasonal effects.
Seasonal adjustment and quality of annual inflation measures
Annual CPI inflation is based on making comparisons between index values in original terms at the same time of the year, one year apart, such as from January 2025 to January 2024. This annual comparison inherently accounts for seasonal patterns, as it compares like months. As a result, no additional seasonal adjustment is applied. Seasonal effects that occur in the same month each year effectively net out when calculating annual movements, so do not affect annual measures of inflation, including the monthly Trimmed mean.
Quality of Seasonally adjusted measures
At the time of first publication of the Monthly CPI, ABS will be able to remove material seasonal effects from up to 90% of the basket. Within the remaining 10%, ABS will initially manage seasonality using a smoothing approach. This will enable production of seasonally adjusted measures of sufficient overall quality to usefully improve interpretation and understanding of the month-to-month behaviour of the complete Monthly CPI.
ABS will provide commentary on which series may be affected by some residual seasonality. Unlike headline CPI annual inflation, all seasonally adjusted series are routinely revised by ABS. Over time, seasonal adjustment quality will improve, and this will be reflected in the revisions to seasonally adjusted series.
Quarterly seasonally adjusted and underlying inflation series will continue to be published for a period of time
When the complete Monthly CPI is first introduced, the ABS will also continue to produce seasonally adjusted quarterly data for the All groups CPI, quarterly Trimmed mean, Weighted median and seasonally adjusted ECs based on their pre-October 2025 compilation approach. This information will complement the monthly measures by enabling the complete monthly CPI to be understood in the context of the longer history of the quarterly series, which maintains historically consistent statistical properties and standard seasonal adjustment.
During this initial period, an appendix with selected quarterly seasonally adjusted and underlying inflation measures will be published with the December, March, June, and September monthly publications. This appendix will include:
| Quarterly series to be retained on pre-October 2025 compilation basis during transition period |
|---|
| ECs Seasonally adjusted (87 ECs) |
| All groups EC points contribution |
| All groups, seasonally adjusted |
| Seasonal factors |
| Trimmed mean |
| Weighted median |
These quarterly seasonally adjusted series will be compiled in a manner consistent with their history of price collection, so that their pre-October 2025 seasonal patterns and seasonal adjustment quality will be maintained (see Appendix C for additional information).
In comparison with the Monthly CPI key analytical measures, the quarterly analytical measures will not make full use of the complete monthly data to improve quality. Instead these measures will discard price data from 8 of 12 months in the year within the 44 short time series ECs. On the other hand, up until April 2027, the quarterly seasonally adjusted data will likely include less residual seasonality than the monthly series.
There are also different approaches to seasonal adjustment involved in the two measures being compared:
- averaging 3 months of a monthly index series to give a quarterly series, and then applying seasonal adjustment, versus
- seasonally adjusting a monthly series, then averaging the seasonally adjusted index series over every quarter.
The monthly and quarterly Trimmed mean series will also be constructed from different distributions, potentially leading to differences between the values.
- The monthly Trimmed mean will use the trim of the monthly distribution of price changes
- The quarterly Trimmed mean uses the quarterly distribution of price changes.
It is possible that the different frequency of trimming could lead to differences in these series, independent of any variation in the frequency of price collection or seasonal adjustment method.
The two approaches are expected to produce similar outcomes.
Differences will therefore occur between the quarterly change in All groups seasonally adjusted and underlying inflation measures produced on the pre-October 2025 basis and measures of quarterly change that could be derived from these series on the new monthly basis. However, ABS analysis on data to date indicates that the Trimmed mean compiled using the pre-October 2025 quarterly method, and measures of quarterly change which could be derived from the new monthly Trimmed mean, will be largely coherent. This analysis shows that there is at most 0.05 percentage point difference between the quarterly movements in the Trimmed mean published for Sept 2024, December 2024 and March 2025 quarters, and comparable movements derived from averaging the 3 months of inflation rates for each quarter from the new monthly Trimmed mean (see table 1 above). Over these three quarters, there was less than a 0.1 percentage point cumulative difference between each approach.
The ABS will produce these legacy quarterly series for at least 18 months, which is when sufficient monthly data will exist for standard seasonal adjustment approaches to be applied to the entire Monthly CPI.
Conclusion
In preparation for publication of a complete Monthly CPI, in late 2023, the ABS conducted an external consultation process to better understand users’ needs. Amongst other feedback, a consistent message from users was how important it was for them to have monthly seasonally adjusted and underlying inflation series. Application of the methods described in this article, will allow the ABS to produce seasonally adjusted and underlying measures of sufficient overall quality to usefully improve interpretation of the month-to-month behaviour of the complete Monthly CPI and provide valuable information on underlying inflation.
ABS approaches to seasonally adjusting the Monthly CPI are sound and based on best practice. ABS will draw on established complete monthly history for many series, plus administrative data, the quarterly history for some series, and ABS understanding of the nature of the price changes, to produce the best feasible seasonal adjustment quality from commencement of the publication of the Monthly CPI. The soundness of ABS approaches explained in this article has been supported by a recent review by Professor Rodney Strachan from the University of Queensland. ABS has conducted extensive investigations to underpin the approach selected.
Seasonally adjusted measures will usefully support interpretation and understanding of the behaviour of the complete monthly CPI. Over time, seasonal adjustment quality will improve, and this will be reflected in the revisions to seasonally adjusted series.
Appendix A: Using alternative data sources to backcast series to enable seasonal adjustment
For 10 ECs, comprising 15% of the weight of the CPI, there is sufficient historical available data to produce a close approximation to the history of the monthly series prior to April 2024. The approximate monthly series values for these earlier months are referred to as backcasts. The backcast values will be spliced on to the start of the collected monthly index series during the seasonal adjustment process enabling the standard seasonal adjustment method to be applied to the extended series. Using backcasts is consistent with relevant international best practice guidelines for seasonal adjustment of short time series in situations when a backcast series can be produced.
Table 2 summarises four methods that will be used to produce backcasts as follows:
1. In some ECs, monthly price data has historically been collected for most products, with only a small component being collected quarterly. To produce backcasts for these series, the following assumptions will be made about the seasonality of the remaining small component. For women’s garments, the components collected quarterly will be assumed to have similar seasonality to the components which have been collected monthly. In the case of men’s garments, wine and preschool & primary education, it will be assumed that there was no monthly seasonal variation for the components that were collected quarterly.
2. In some ECs, price changes relate to services provided by State and Territory Governments, so the months of major price changes are known. The backcast monthly series for these ECs will be produced using the data that has been collected quarterly alongside knowledge of the regular annual timing of price changes for these services.
3. & 4. For the two ECs, Medical & hospital services and Pharmaceutical products, administrative monthly data on the Medical Benefits Schedule (MBS) and the Pharmaceutical Benefits Schedule (PBS) will be used to backcast components of the EC affected by the MBS and PBS. These datasets inform how average out-of-pocket costs for relevant items change within a quarter due to changes in the size of rebates paid during the quarter. For Telecommunication equipment and services EC, a recently acquired data source has been used to derive the backcasts.
| Approach | ECs |
|---|---|
|
|
|
|
|
|
|
|
Appendix B. Targeted smoothing to manage seasonality
When producing the All groups seasonally adjusted, Trimmed mean and Weighted median measures, ABS will smooth short time series ECs that cannot be seasonally adjusted where:
- information exists to confidently predict that strong price changes in some months of the year are largely being driven by seasonal effects, and
- the data collected to date is consistent with these expectations.
As noted in the paper above, ABS expect to apply this treatment, in months where the above criteria are met, to 18 short time series ECs (10% of the weight of the CPI) which are expected to display moderate to strong seasonality. This smoothing will ensure strong price change behaviour, which is apparently seasonal, will not affect the aggregated seasonally adjusted index or the measures of underlying inflation. It will not remove more subtle or complex seasonality from the series and will not produce a true seasonally adjusted EC index for the relevant ECs. While this is not a standard seasonal adjustment approach, it is being applied by the ABS based on carefully considering the underlying data, relevant methodological principles, and to meet a clear user need.
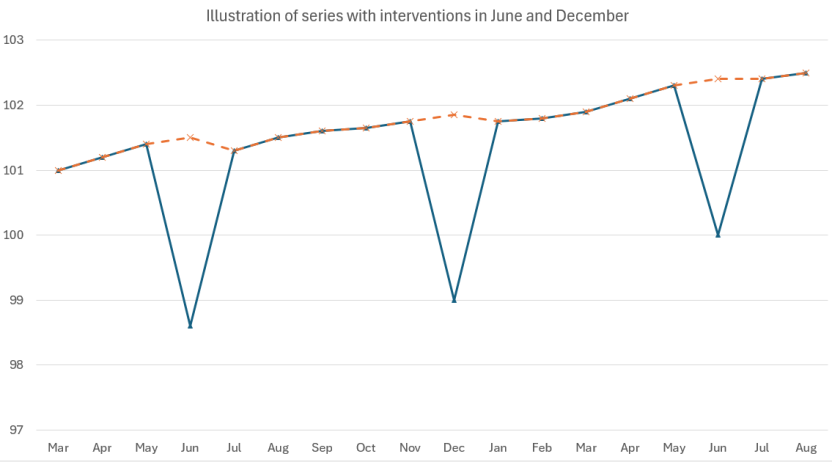
Figure 4 illustrates how the smoothing replaces the measured price index value with a value close to that of the previous month to create the smoothed series. For instances where recent data suggests a clear underlying trend for the EC, the replacement value will produce a smoothed price change estimate which is consistent with this trend behaviour. For instances where the series does not display a clear trend, the replacement value will result in a zero movement in the smoothed series. Smoothing will only be applied in consecutive months for an EC if the seasonal effect is understood to strongly influence the level of the index in consecutive months.
It should be noted that this smoothing may remove short-term movements in series which are not seasonal, such as an unusually large overall reduction in prices in a sales period. This may be subsequently identified and corrected in series revisions once the usual seasonal behaviour of the series is better understood.
Applying this smoothing also carries some risk of over-correcting and removing underlying non-seasonal price changes. This risk will, however, be mitigated by limiting the intervention to selected months, thereby ensuring that series return to their underlying trajectory in the months following the intervention. ABS analysis indicates that applying this smoothing will result in better overall quality in the new monthly All groups seasonally adjusted series, than if large cumulative apparently seasonal price changes in known sales periods in ECs are allowed to distort this series. Information on where and how the smoothing approach has been applied will be provided in the monthly publications.
Figure 4: Illustration of series with smoothing interventions in June and December
Appendix C: Compiling quarterly seasonally adjusted series, including the Trimmed mean using pre-October 2025 methods
As explained in this paper, there are some monthly series where the time series will be too short to enable them to be seasonally adjusted using standard ABS methods. From the time that publication of the complete Monthly CPI starts for at least 18 months, the ABS will continue to produce quarterly seasonally adjusted series, including All groups CPI, ECs, Trimmed mean and Weighted median series, using historic methods. This appendix explains these methods in more detail.
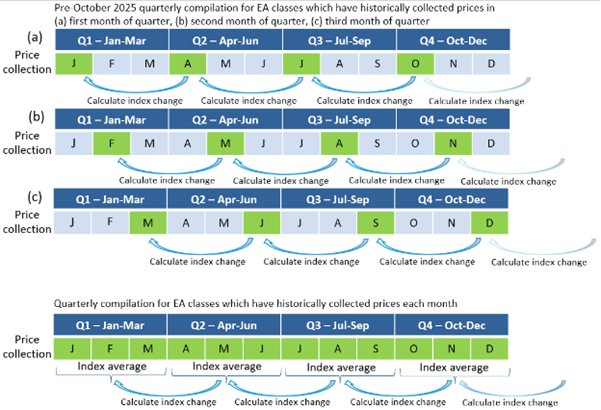
The pre-October 2025 compilation method for the 44 ECs collecting quarterly prices is based on collecting prices in a particular month of the quarter (i.e. first, second or third month of the quarter) and measuring the price change between this and the same month in the previous quarter. Quarterly prices in a particular EC might be measured in month 1 of each quarter (January, April, July, and October), OR month 2 (February, May, August, and November), OR month 3 (March, June, September, and December). For some ECs, the collection month may vary for different Expenditure Aggregates (EA) making up the EC, so that some EAs are measured in month 1, some in month 2, and/or some in month 3 of each quarter.
To recreate this compilation method from the full monthly data for that EC, only prices from the historic collection months within that EC will be used to derive quarterly price movements, for the purpose of producing the seasonally adjusted quarterly EC series. Long-standing quarterly seasonal patterns will therefore be maintained and underpin maintaining existing seasonal adjustment approaches and quality for all the quarterly EC series.
Figure 5: Illustration of the pre-October 2025 quarterly price compilation
The series generated from this approach will be combined with the rest of the 87 ECs to produce quarterly seasonally adjusted series, including estimates of Trimmed mean and Weighted median using methods explained in the article: Underlying Inflation Measures: Explaining the Trimmed Mean and Weighted Median.
Appendix D: Classification of Expenditure Classes
Table 3 Expenditure Class metrics and classification for seasonal adjustment approach
Note classifications of each EC are current as at June 2025 and are subject to change.
| Expenditure Class | CPI weight | Time series length as at October 2025* | Seasonality strength | Seasonal adjustment method until April 2027 | |
|---|---|---|---|---|---|
| Food and Non-alcoholic beverages | |||||
| Bread | 0.62% | Long | Seasonal | Standard | |
| Cakes and biscuits | 0.66% | Long | Seasonal | Standard | |
| Breakfast cereals | 0.10% | Long | Seasonal | Standard | |
| Other cereal products | 0.19% | Long | Seasonal | Standard | |
| Beef and veal | 0.42% | Long | Seasonal | Standard | |
| Pork | 0.27% | Long | Seasonal | Standard | |
| Lamb and goat | 0.24% | Long | Seasonal | Standard | |
| Poultry | 0.43% | Long | Seasonal | Standard | |
| Other meats | 0.40% | Long | Seasonal | Standard | |
| Fish and other seafood | 0.38% | Long | Seasonal | Standard | |
| Milk | 0.42% | Long | Seasonal | Standard | |
| Cheese | 0.34% | Long | Non-seasonal | ||
| Ice cream and other dairy products | 0.32% | Long | Seasonal | Standard | |
| Fruit | 0.92% | Long | Seasonal | Standard | |
| Vegetables | 1.11% | Long | Seasonal | Standard | |
| Eggs | 0.14% | Long | Seasonal | Standard | |
| Jams, honey and spreads | 0.12% | Long | Seasonal | Standard | |
| Food additives and condiments | 0.32% | Long | Seasonal | Standard | |
| Oils and fats | 0.27% | Long | Non-seasonal | ||
| Snacks and confectionery | 0.93% | Long | Seasonal | Standard | |
| Other food products n.e.c. | 0.53% | Long | Seasonal | Standard | |
| Coffee, tea and cocoa | 0.26% | Long | Seasonal | Standard | |
| Waters, soft drinks and juices | 0.95% | Long | Seasonal | Standard | |
| Restaurant meals | 3.95% | Short | Anticipated Low/No identifiable | No adjustments | |
| Take away and fast foods | 3.19% | Short | Anticipated Low/No identifiable | No adjustments | |
| Alcohol and Tobacco | |||||
| Spirits | 0.93% | Long | Seasonal | Standard | |
| Wine | 1.69% | Short | Anticipated Moderate/Strong | Backcast | |
| Beer | 2.08% | Long | Seasonal | Standard | |
| Tobacco | 1.87% | Long | Seasonal | Standard | |
| Clothing and Footwear | |||||
| Garments for men | 0.54% | Short | Anticipated Moderate/Strong | Backcast | |
| Garments for women | 1.11% | Short | Anticipated Moderate/Strong | Backcast | |
| Garments for infants and children | 0.34% | Short | Anticipated Moderate/Strong | Managed by interventions | |
| Footwear for men | 0.12% | Short | Anticipated Moderate/Strong | Managed by interventions | |
| Footwear for women | 0.28% | Short | Anticipated Moderate/Strong | Managed by interventions | |
| Footwear for infants and children | 0.07% | Short | Anticipated Moderate/Strong | Managed by interventions | |
| Accessories | 0.73% | Short | Anticipated Moderate/Strong | Managed by interventions | |
| Cleaning, repair and hire of clothing and footwear | 0.07% | Short | Anticipated Low/No identifiable | No adjustments | |
| Housing | |||||
| Rents | 6.61% | Long | Non-seasonal | ||
| New dwelling purchase by owner-occupiers | 7.59% | Long | Non-seasonal | ||
| Maintenance and repair of the dwelling | 2.05% | Short | Anticipated Low/No identifiable | No adjustments | |
| Property rates and charges | 1.46% | Long | Seasonal | Standard | |
| Water and sewerage | 0.87% | Short | Anticipated Moderate/Strong | Backcast | |
| Electricity | 1.84% | Long | Seasonal | Standard | |
| Gas and other household fuels | 0.96% | Long | Seasonal | Standard | |
| Furnishings, Household Equipment and Services | |||||
| Furniture | 1.24% | Short | Anticipated Moderate/Strong | Managed by interventions | |
| Carpets and other floor coverings | 0.26% | Short | Anticipated Moderate/Strong | Managed by interventions | |
| Household textiles | 0.46% | Short | Anticipated Moderate/Strong | Managed by interventions | |
| Major household appliances | 0.35% | Short | Anticipated Moderate/Strong | Managed by interventions | |
| Small electric household appliances | 0.27% | Short | Anticipated Moderate/Strong | Managed by interventions | |
| Glassware, tableware and household utensils | 0.37% | Short | Anticipated Moderate/Strong | Managed by interventions | |
| Tools and equipment for house and garden | 0.36% | Short | Anticipated Low/No identifiable | No adjustments | |
| Cleaning and maintenance products | 0.22% | Long | Seasonal | Standard | |
| Personal care products | 0.80% | Long | Non-seasonal | Standard | |
| Other non-durable household products | 1.19% | Long | Seasonal | Standard | |
| Child care | 0.74% | Short | Anticipated Low/No identifiable | No adjustments | |
| Hairdressing and personal grooming services | 1.05% | Short | Anticipated Low/No identifiable | No adjustments | |
| Other household services | 0.72% | Short | Anticipated Low/No identifiable | No adjustments | |
| Health | |||||
| Pharmaceutical products | 0.95% | Short | Anticipated Moderate/Strong | Backcast | |
| Therapeutic appliances and equipment | 0.14% | Short | Anticipated Low/No identifiable | No adjustments | |
| Medical and hospital services | 5.03% | Short | Anticipated Moderate/Strong | Backcast | |
| Dental services | 0.60% | Short | Anticipated Low/No identifiable | No adjustments | |
| Transport | |||||
| Motor vehicles | 3.51% | Short | Anticipated Low/No identifiable | No adjustments | |
| Spare parts and accessories for motor vehicles | 0.89% | Short | Anticipated Moderate/Strong | Managed by interventions | |
| Automotive fuel | 3.35% | Long | Non-seasonal | ||
| Maintenance and repair of motor vehicles | 2.05% | Short | Anticipated Low/No identifiable | No adjustments | |
| Other services in respect of motor vehicles | 1.30% | Short | Anticipated Moderate/Strong | Backcast | |
| Urban transport fares | 0.35% | Short | Anticipated Moderate/Strong | Backcast | |
| Communication | |||||
| Postal services | 0.10% | Long | Non-seasonal | ||
| Telecommunication equipment and services | 2.03% | Short | Anticipated Moderate/Strong | Backcast | |
| Recreation and Culture | |||||
| Audio, visual and computing equipment | 1.02% | Short | Anticipated Moderate/Strong | Managed by interventions | |
| Audio, visual and computing media and services | 0.89% | Short | Anticipated Low/No identifiable | No adjustments | |
| Books | 0.13% | Short | Anticipated Moderate/Strong | Managed by interventions | |
| Newspapers, magazines and stationery | 0.34% | Short | Anticipated Low/No identifiable | No adjustments | |
| Domestic holiday travel and accommodation | 3.16% | Long | Seasonal | Standard | |
| International holiday travel and accommodation | 3.10% | Long | Seasonal | Standard | |
| Equipment for sports, camping and open-air recreation | 0.48% | Short | Anticipated Moderate/Strong | Managed by interventions | |
| Games, toys and hobbies | 0.63% | Short | Anticipated Moderate/Strong | Managed by interventions | |
| Pets and related products | 0.50% | Long | Seasonal | Standard | |
| Veterinary and other services for pets | 0.51% | Short | Anticipated Low/No identifiable | No adjustments | |
| Sports participation | 1.06% | Short | Anticipated Moderate/Strong | Managed by interventions | |
| Other recreational, sporting and cultural services | 0.93% | Short | Anticipated Moderate/Strong | Managed by interventions | |
| Education | |||||
| Preschool and primary education | 0.95% | Short | Anticipated Moderate/Strong | Backcast | |
| Secondary education | 2.01% | Long | Seasonal | Standard | |
| Tertiary education | 1.73% | Long | Seasonal | Standard | |
| Insurance and Financial Services | |||||
| Insurance | 1.36% | Short | Anticipated Low/No identifiable | No adjustments | |
| Deposit and loan facilities (direct charges) | 0.40% | Long | Non-seasonal | ||
| Other financial services | 3.82% | Long | Seasonal Anticipated Low/No identifiable | Standard | |
* Short time series are those ECs where monthly data has been collected for less than 3 years and therefore cannot be seasonally adjusted using standard methods. Long time series are those where monthly data has been collected for 3 years or more.
Footnotes
- Annual collection will continue for education fees, health insurance and property rates which tend to change once a year. Prices will continue to be collected quarterly for Other financial services as items such as stamp duty, real estate services and accounting services, which do not tend to change price frequently.