Overseas Arrivals and Departures, Australia

This is not the latest release View the latest release

Statistics on international travel arriving in and departing from Australia.

Reference period
October 2022
Released
13/12/2022

Key statistics

In October 2022:

  • Arrivals: 1,212,850 – a monthly increase of 141,330 trips. 
  • Departures: 1,014,820 – a monthly decrease of 25,730 trips. 

These statistics report on the number of international border crossings rather than the number of people. Most data in this release are rounded to the nearest 10. As a result, sums of components may not add exactly to totals.

Overseas Migration Statistics

This release presents statistics on all overseas arrivals and departures, which is not the same as overseas migration statistics.

If you are looking for ABS statistics on overseas migration, please refer to:

Arrivals and departures

  1. Provisional data for the most recent month has not had the full quality assurance methods applied as is done for the earlier months. Provisional data will be revised in the next issue of this publication.
  1. Provisional data for the most recent month has not had the full quality assurance methods applied as is done for the earlier months. Provisional data will be revised in the next issue of this publication.

Provisional Estimates

To provide more timely travel data in response to COVID-19, provisional estimates for total overseas arrivals and total overseas departures are included in Graphs 1.1, 1.2 and 1.3. Additional provisional data are available under the Data downloads for State of clearance (Table 13), Country of citizenship (Table 14), and Visa group (Table 15). No further breakdowns of provisional data are available, other than those which appear in this release.

  1. Provisional data for the most recent month has not had the full quality assurance methods applied as is done for the earlier months. Provisional estimates will be revised in the next issue of this publication.
1.4 Arrivals and departures by category of travel - monthly change(a)
 Oct-19Oct-21Sep-22Oct-22Monthly change Sep-22 to Oct-22
Category of travel(no.)(no.)(no.)(no.)(no.)
Permanent arrivals(b)7,2801,9008,6908,350-350
Australian resident returns(c)
    long-term10,7703,34013,27013,060-200
    short-term1,145,9705,070633,790721,86088,080
Overseas visitor arrivals(d)
    long-term41,1401,91043,93039,110-4,820
    short-term774,0204,410371,850430,47058,630
Total Arrivals1,979,19016,6301,071,5201,212,850141,330
Australian resident departures(c)
    long-term19,6106,26014,79017,4902,700
    short-term914,66016,850722,220609,160-113,060
Overseas visitor departures(d)
    long-term20,43010,24028,62027,720-910
    short-term724,0903,490274,920360,46085,550
Total Departures1,678,79036,8301,040,5501,014,820-25,730
  1. Category of travel data is not available from provisional estimates.
  2. Permanent arrivals (settlers) comprise: travellers who hold permanent visas, New Zealand citizens who indicate on their passenger card an intention to migrate permanently, and those who are otherwise identified as eligible to settle.
  3. Australian resident includes Australian citizens, permanent visa holders residing in Australia, and any New Zealand citizens who can be identified as a resident.
  4. An overseas visitor is any traveller arriving to, or departing from, Australia who is not an Australian resident.

NOTE: Long-term are travellers who have been away or in Australia for 12 months or more. Short-term are travellers who have been away or in Australia for less than 12 months.

Visitor arrivals - short-term

Compares international visitor arrivals each month by source country and change at the state and territory level. Analysis in this section is undertaken on short-term trips (less than 1 year).

For visitor arrivals to Australia:

  • A total of 430,470 short-term trips were recorded, an increase of 426,060 compared with the corresponding month of the previous year.
  • The number of trips for October 2022 was 44.4% lower than the pre-COVID level in October 2019.
  • New Zealand was the largest source country, accounting for 23.0% of all visitor arrivals.

Countries where visitors came from

The three leading source countries where visitors came from were:

  • New Zealand (98,600 trips)
  • The UK (47,420)
  • The USA (37,640).

Details

  1. Top 10 source countries based on month ending October 2022.
2.3 Short-term visitor arrivals - Top 10 source countries(a)
Country of ResidenceOct 2019 (no.)Oct 2021 (no.)Sep 2022 (no.)Oct 2022 (no.)Sep 2022 to Oct 2022 change
New Zealand142,97021082,81098,60015,800
UK60,94038033,50047,42013,930
USA60,20023028,63037,6409,010
Singapore39,43018029,69029,680-10
India29,04031026,47028,3101,840
Germany18,960608,50012,0203,520
Canada14,510607,72010,4902,780
Malaysia30,4206012,69010,230-2,460
Philippines14,2003309,6809,940260
Japan39,700407,8409,7101,870
  1. Top 10 source countries based on month ending October 2022.

State or territory of stay

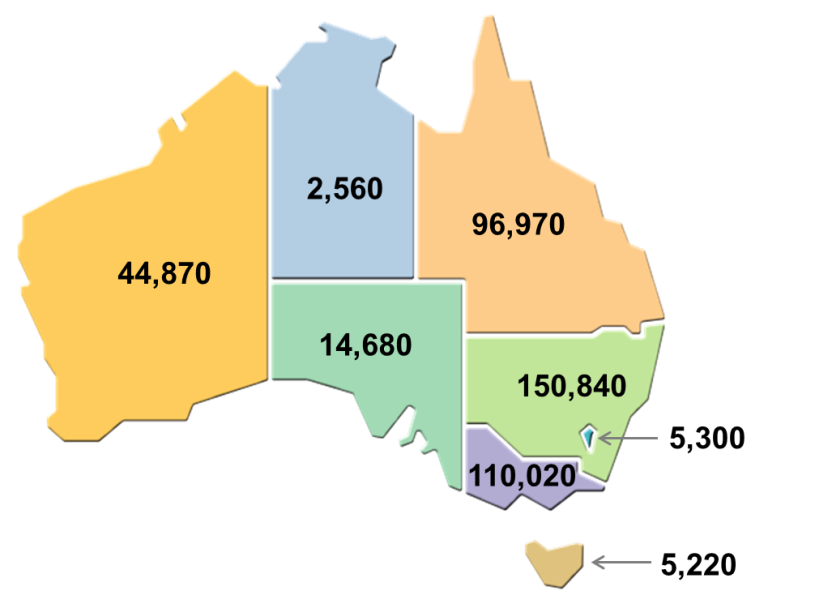
All travellers are asked their intended address in Australia upon arrival. For October 2022, the highest number of visitor arrivals for short-term trips was observed for New South Wales (150,840), whilst the Northern Territory recorded the fewest (2,560).

Details

2.4 Short-term visitor arrivals, State or territory of stay - October 2022

The image is a map of Australia, separated into states. Each state is labelled with the corresponding data for short-term visitor arrivals for October 2022. For statistics for each state, refer to the October 2022 column of Table 2.5.
This map presents the number of short-term visitor arrivals in Australia in October 2022, by their state of intended stay. - New South Wales (150,840) - Victoria (110,020) - Queensland (96,970) - South Australia (14,680) - Western Australia (44,870) - Tasmania (5,220) - Northern Territory (2,560) - Australian Capital Territory (5,300).
2.5 Short-term visitor arrivals, State or territory of stay
State or territory of stayOct 2019 (no.)Oct 2021 (no.)Sep 2022 (no.)Oct 2022 (no.)Sep 2022 to Oct 2022 change
NSW285,200980128,980150,84021,860
Vic.195,58061090,290110,02019,730
Qld169,7201,39086,91096,97010,060
SA23,44017012,02014,6802,660
WA77,63066041,29044,8703,570
Tas.6,8303403,0305,2202,180
NT7,4601903,8602,560-1,300
ACT8,110605,4305,300-120
Australia(a)774,0204,410371,850430,47058,630
  1. Includes Other Territories.
     

Visitor arrivals - short-term - state and territory

Compares international visitor arrivals each month by source country for each state and territory. The additional information is being provided during the COVID-19 pandemic. Analyses in this section are undertaken on short-term trips (less than 1 year) unless otherwise stated.

New South Wales

For visitor arrivals to New South Wales:

  • There were 150,840 short-term visitor arrivals, an increase of 149,860 compared with the corresponding month of the previous year.
  • The number of trips for October 2022 was 47.1% lower than pre-COVID levels in October 2019.

Countries where visitors came from

The three leading source countries for New South Wales were:

  • New Zealand (27,750 trips)
  • The USA (18,740)
  • The UK (16,750).
  1. Top 10 source countries based on month ending October 2022.
3.3 Short-term visitor arrivals, NSW - Top 10 source countries(a)
Country of ResidenceOct 2019 (no.)Oct 2021 (no.)Sep 2022 (no.)Oct 2022 (no.)Sep 2022 to Oct 2022 change
New Zealand45,6702023,32027,7504,430
USA31,6007014,03018,7404,710
UK22,5107011,33016,7505,420
India9,000408,1708,280110
Singapore9,160306,5507,460920
Philippines6,820404,2704,620350
Canada6,410202,9004,5601,670
Germany7,080203,2204,4901,270
Korea, South12,050103,6303,6200
Vietnam4,000102,7503,500750
  1. Top 10 source countries based on month ending October 2022.

Long-term visitor arrivals

For visitors arriving in New South Wales for a long-term trip (1 year or more):

  • There were 14,590 arrivals, an increase of 14,200 compared with the corresponding month of the previous year.
  • The number of trips for October 2022 was 10.0% lower than pre-COVID levels in October 2019.

Victoria

For visitor arrivals to Victoria:

  • There were 110,020 short-term visitor arrivals, an increase of 109,410 compared with the corresponding month of the previous year.
  • The number of trips for October 2022 was 43.7% lower than pre-COVID levels in October 2019.

Countries where visitors came from

The three leading source countries for Victoria were:

  • New Zealand (22,850 trips)
  • India (12,080)
  • Singapore (9,650).
  1. Top 10 source countries based on month ending October 2022.
  2. Excludes SARs and Taiwan.
4.3 Short-term visitor arrivals, Vic. - Top 10 source countries(a)
Country of ResidenceOct 2019 (no.)Oct 2021 (no.)Sep 2022 (no.)Oct 2022 (no.)Sep 2022 to Oct 2022 change
New Zealand33,2002018,79022,8504,070
India12,2104011,17012,080900
Singapore10,640207,9709,6501,680
UK12,020606,0509,5303,480
USA11,720405,2307,6802,450
Malaysia10,430104,5103,980-530
Vietnam4,47002,8903,180300
Germany4,060101,6002,560960
China(b)35,280402,2602,550290
Indonesia5,10003,2702,510-750
  1. Top 10 source countries based on month ending October 2022.
  2. Excludes SARs and Taiwan.

Long-term visitor arrivals

For visitors arriving in Victoria for a long-term trip (1 year or more):

  • There were 11,240 arrivals, an increase of 10,880 compared with the corresponding month of the previous year.
  • The number of trips for October 2022 was 7.6% lower than pre-COVID levels in October 2019.

Queensland

For visitor arrivals to Queensland:

  • There were 96,970 short-term visitor arrivals, an increase of 95,580 compared with the corresponding month of the previous year.
  • The number of trips for October 2022 was 42.9% lower than pre-COVID levels in October 2019.

Countries where visitors came from

The three leading source countries for Queensland were:

  • New Zealand (37,980 trips)
  • The UK (9,340)
  • The USA (6,520).
  1. Top 10 source countries based on month ending October 2022.


5.3 Short-term visitor arrivals, Qld - Top 10 source countries(a)
Country of ResidenceOct 2019 (no.)Oct 2021 (no.)Sep 2022 (no.)Oct 2022 (no.)Sep 2022 to Oct 2022 change
New Zealand51,12013032,40037,9805,570
UK12,580908,4209,340920
USA9,320305,5606,520960
Japan16,900102,6003,380780
Singapore5,450304,6803,270-1,410
India3,5001502,6302,72090
Canada2,860102,1402,440300
Germany3,800201,9002,400500
New Caledonia1,76007801,760980
PNG2,980402,0401,720-320
  1. Top 10 source countries based on month ending October 2022.

Long-term visitor arrivals

For visitors arriving in Queensland for a long-term trip (1 year or more):

  • There were 5,610 arrivals, an increase of 5,040 compared with the corresponding month of the previous year.
  • The number of trips for October 2022 was 3.8% lower than pre-COVID levels in October 2019.

South Australia

For visitor arrivals to South Australia:

  • There were 14,680 short-term visitor arrivals, an increase of 14,510 compared with the corresponding month of the previous year.
  • The number of trips for October 2022 was 37.3% lower than pre-COVID levels in October 2019.


Countries where visitors came from

The three leading source countries for South Australia were:

  • New Zealand (2,260 trips)
  • The UK (2,150)
  • India (1,610).
  1. Top 10 source countries based on month ending October 2022.
6.3 Short-term visitor arrivals, SA- Top 10 source countries(a)
Country of ResidenceOct 2019 (no.)Oct 2021 (no.)Sep 2022 (no.)Oct 2022 (no.)Sep 2022 to Oct 2022 change
New Zealand3,01001,7302,260530
UK2,900501,2702,150880
India1,460301,4201,610190
USA1,570108901,390500
Malaysia86010760660-100
Singapore9701056059030
Germany7900310430130
Vietnam4400290410120
Canada5400490370-120
Indonesia2900200350160
  1. Top 10 source countries based on month ending October 2022.

Long-term visitor arrivals

For visitors arriving in South Australia for a long-term trip (1 year or more):

  • There were 1,760 arrivals, an increase of 1,700 compared with the corresponding month of the previous year.
  • The number of trips for October 2022 was 1.8% lower than pre-COVID levels in October 2019.

Western Australia

For visitor arrivals to Western Australia:

  • There were 44,870 short-term visitor arrivals, an increase of 44,210 compared with the corresponding month of the previous year.
  • The number of trips for October 2022 was 42.2% lower than pre-COVID levels in October 2019.

Countries where visitors came from

The three leading source countries for Western Australia were:

  • The UK (8,790 trips)
  • Singapore (7,770)
  • New Zealand (4,990).
  1. Top 10 source countries based on month ending October 2022.
7.3 Short-term visitor arrivals, WA - Top 10 source countries(a)
Country of ResidenceOct 2019 (no.)Oct 2021 (no.)Sep 2022 (no.)Oct 2022 (no.)Sep 2022 to Oct 2022 change
UK9,680805,4408,7903,350
Singapore11,540409,1507,770-1,380
New Zealand6,510304,6104,990380
India2,110502,1202,670550
Malaysia9,520203,1201,890-1,230
USA3,840201,3801,810430
Germany2,500201,1001,650550
Indonesia2,930101,4001,45050
France1,460201,0601,09030
Ireland1,110108701,020150
  1. Top 10 source countries based on month ending October 2022.

Long-term visitor arrivals

For visitors arriving in Western Australia for a long-term trip (1 year or more):

  • There were 4,240 arrivals, an increase of 3,940 compared with the corresponding month of the previous year.
  • The number of trips for October 2022 was 19.2% higher than pre-COVID levels in October 2019.

Tasmania

For visitor arrivals to Tasmania:

  • There were 5,220 short-term visitor arrivals, an increase of 4,880 compared with the corresponding month of the previous year.
  • The number of trips for October 2022 was 23.7% lower than pre-COVID levels in October 2019.

Countries where visitors came from

The three leading source countries for Tasmania were:

  • New Zealand (1,590 trips)
  • Singapore (590)
  • The USA (490).
  1. Top 10 source countries based on month ending October 2022.
8.3 Short-term visitor arrivals, Tas. - Top 10 source countries(a)
Country of ResidenceOct 2019 (no.)Oct 2021 (no.)Sep 2022 (no.)Oct 2022 (no.)Sep 2022 to Oct 2022 change
New Zealand1,200107601,590830
Singapore74010390590200
USA5500280490210
India100018022040
UK400018022030
Timor-Leste20040220170
Vanuatu50300200200
Nepal300190160-40
Germany16004012080
France100603011080
  1. Top 10 source countries based on month ending October 2022.

Long-term visitor arrivals

For visitors arriving in Tasmania for a long-term trip (1 year or more):

  • There were 420 arrivals, an increase of 390 compared with the corresponding month of the previous year.
  • The number of trips for October 2022 was 4.8% higher than pre-COVID levels in October 2019.

Northern Territory

For visitor arrivals to the Northern Territory:

  • There were 2,560 short-term visitor arrivals, an increase of 2,360 compared with the corresponding month of the previous year.
  • The number of trips for October 2022 was 65.7% lower than pre-COVID levels in October 2019.

Countries where visitors came from

The three leading source countries for the Northern Territory were:

  • New Zealand (370 trips)
  • Germany (270)
  • The USA (270).
  1. Top 10 source countries based on month ending October 2022.
9.3 Short-term visitor arrivals, NT - Top 10 source countries(a)
Country of ResidenceOct 2019 (no.)Oct 2021 (no.)Sep 2022 (no.)Oct 2022 (no.)Sep 2022 to Oct 2022 change
New Zealand7100510370-140
Germany48002702700
USA61050500270-230
UK49010390220-180
Timor-Leste1900250140-110
Indonesia2600150100-50
Netherlands210010090-10
Singapore6406018090-100
France220016080-80
Switzerland180011080-40
  1. Top 10 source countries based on month ending October 2022.

Long-term visitor arrivals

For visitors arriving in the Northern Territory for a long-term trip (1 year or more):

  • There were 380 arrivals, an increase of 290 compared with the corresponding month of the previous year.
  • The number of trips for October 2022 was 7.6% lower than pre-COVID levels in October 2019.

Australian Capital Territory

For visitor arrivals to the Australian Capital Territory:

  • There were 5,300 short-term visitor arrivals, an increase of 5,240 compared with the corresponding month of the previous year.
  • The number of trips for October 2022 was 34.7% lower than pre-COVID levels in October 2019.

Countries where visitors came from

The three leading source countries for the Australian Capital Territory were:

  • New Zealand (800 trips)
  • The USA (740)
  • India (700).
  1. Top 10 source countries based on month ending October 2022.
10.3 Short-term visitor arrivals, ACT- Top 10 source countries(a)
Country of ResidenceOct 2019 (no.)Oct 2021 (no.)Sep 2022 (no.)Oct 2022 (no.)Sep 2022 to Oct 2022 change
New Zealand1,5500700800100
USA990107407400
India470068070020
UK3601041043020
Singapore290022028060
Nepal40023026030
Philippines1800220160-50
Canada2000170140-40
Indonesia2100160130-30
Vietnam10001301300
  1. Top 10 source countries based on month ending October 2022.

Long-term visitor arrivals

For visitors arriving in the Australian Capital Territory for a long-term trip (1 year or more):

  • There were 890 arrivals, an increase of 770 compared with the corresponding month of the previous year.
  • The number of trips for October 2022 was 12.6% higher than pre-COVID levels in October 2019.

Visitor arrivals - short-term - Financial year 2021-22

Compares annual international travel arrivals over time by source country, by state and territory, by age and sex, by main reason for journey and by median duration of trip. All analysis in this section is done on short-term trips (less than 1 year).

For the most recent analysis by calendar year see the March 2022 issue of OAD.

Visitors arriving in Australia in 2021-22:

  • There were 1,191,830 visitor arrivals, almost 8 times higher than the previous year
  • New Zealand was the largest source country, accounting for 16% of visitors
  • The most popular reason for travel was 'Visiting friends/relatives' (55.9%)
  • The median duration of stay in Australia was 26 days.

Annual visitor arrivals

The COVID-19 pandemic resulted in substantial declines in travel movements since the introduction of border restrictions in March 2020. These restrictions have been progressively lifted from November 2021 to February 2022 resulting in increased visitor arrivals particularly in the second half of the 2021-22 year. 

There were 1,191,830 visitor arrivals in 2021-22. This is an increase of more than 1 million on the previous year, up from 150,880, with 97.2% of movements occurring from November 2021.

11.1 Short-term visitor arrivals by month
2021-22'000Change ('000)(a)
Jul18.7215.20
Aug6.393.36
Sep4.430.71
Oct4.41-1.66
Nov20.8613.29
Dec73.2964.47
Jan60.7652.78
Feb90.4684.20
Mar170.25161.94
Apr235.46212.85
May231.48195.29
Jun275.30238.53
Annual Total1,191.831,040.96
  1. Numerical change when compared to the same period of the previous year.


Visitor arrivals to Australia have generally been increasing over recent decades, with a continuous increase in the ten years up to 2019. However, due to the impact of COVID-19, a substantial decline was observed from February 2020 onwards. Since November 2021, visitor arrivals have been increasing as border restrictions have eased.

Peaks were seen during the:

  • Brisbane Expo in 1988
  • Sydney Olympics in 2000.

Decreases were experienced during the:

  • Asian financial crisis in 1998
  • 2001 September 11 attacks in the USA
  • Severe Acute Respiratory Syndrome (SARS) outbreak in 2003
  • Global Financial Crisis (GFC) in 2008
  • global COVID-19 pandemic starting in 2020. 

Countries where visitors came from

Travel restrictions have resulted in a change in the source countries of visitors to Australia.

In 2021-22:

  • Short-term visitor arrivals for all top 5 source countries are higher when compared with the previous year, due to the easing of international travel restrictions
  • New Zealand (191,640 visits) was the largest source country for visitor arrivals
  • India (134,470) was the second largest and has replaced China in the top 5 source countries.

In 2020-21, New Zealand was the largest and the UK the second largest.

  1. Top 5 source countries based on year ending June 2022.

Among the top 10 source countries, there was strong growth from Asian countries in particular over the last decade. Low volumes for all countries over the past two years were due to the impact of the COVID-19 pandemic, with recent increases being seen since the easing of travel restrictions from November 2021.

Annual arrivals of visitors travelling for a short-term trip increased by 1 million since 2020-21. India has seen the largest increase since 2020-21 of 131,250. 

11.4 Short-term visitor arrivals, Australia — Top 10 source countries(a) — 2021-22
Country of Residence'0002020-21 to 2021-22 change ('000)2011-12 to 2021-22 change ('000)
New Zealand191.64107.93-992.41
India134.47131.25-19.68
UK133.85125.74-492.93
Singapore121.06117.20-144.98
USA100.1089.90-383.84
China(b)35.5632.16-548.24
Canada27.3425.84-107.59
Indonesia26.8925.46-110.13
Germany22.1220.79-134.97
Malaysia20.9820.03-209.04
All countries1191.831040.96-4799.54
  1. Top 10 source countries based on year ending June 2022.
  2. Excludes SARs and Taiwan.

State or territory of stay

All travellers are asked their intended address in Australia upon arrival. 

The COVID-19 pandemic saw different periods where state borders and airports were closed to international visitors at different times.

The proportion of Australia's short-term visitor arrivals by intended state or territory in 2021-22 were as follows:

  • NSW (36.6% of all short-term visitors)
  • Vic. (28.4%)
  • Qld (18.7%)
  • SA (3.6%)
  • WA (9.1%)
  • Tas. (1.1%)
  • NT (0.8%)
  • ACT (1.6%). 

All states recorded growth in international visitors in the ten year period up to early 2020. In comparison, the territories experienced fluctuations in visitor numbers, particularly the Northern Territory. All states and territories observed a considerable drop in visitor numbers during the COVID-19 pandemic. Since the easing of travel restrictions in November 2021, increases in visitor arrivals in all states and territories have been observed.

At the state and territory level, the mix of source countries varies from that at the national level. During 2021-22:

  • New Zealand was the largest source country for visitors to NSW and Qld
  • India was the largest source country for Vic., SA and ACT
  • Singapore was the largest source country for WA and Tas
  • The USA was the largest source country of visitors to the NT.

Ten years earlier in 2011-12, New Zealand was the leading source country for NSW, Vic., Qld, SA, and Tas. However, the USA was the leading source country for the NT and ACT, and the UK was the leading source country for WA.

Age and sex

There were more visits to Australia by women than men in 2021-22 (588,190 men compared with 603,650 women). In 2011-12, however, there were more male short term visitor arrivals than female (3,116,790 men and 2,874,590 women).

In 2021-22 male visitors had a median age of 43 years, whereas female visitors had a median age of 46 years. The largest group of visitor arrivals was aged between 25 and 29 years, with the largest source country for this age group being New Zealand. In 2011-12, the median age for male visitors was 40 and female visitors had a median age of 39.

Main reason for journey

In 2021-22, the most frequently stated main reason for journey by short-term visitors to Australia was:

  • Visiting friends/relatives (55.9%)
  • Holiday (17.8%)
  • Business (7.8%)
  1. As a percentage of all short-term visitor arrivals.

Female visitors were more likely than males to record their main reason for journey as ‘visiting friends or relatives’ or ‘holiday’. Male visitors were more likely to record ‘business’ or ‘employment’ than female visitors.

During the pandemic and associated travel restrictions there has been an increase in travellers recording ‘Other’ as their main reason for journey and a decrease in travellers recording 'Holiday'. In 2021-22 the proportion of travellers recording 'Holiday' as their main reason for travel was higher than in 2020-21 and has been increasing since November 2021.

11.8 Short-term visitor arrivals, Australia — Main reason for journey and Sex — 2021-22
Males (%)Females (%)
Visiting friends/relatives48.463.3
Holiday17.118.4
Business12.33.5
Employment7.03.4
Education6.96.5
Convention/conference2.61.6
Exhibition0.20.1
Other5.43.4
Total100.0100.0

Duration of stay

Visitors are asked their intended duration in Australia upon arrival.

During 2021-22, the median duration of stay in Australia was 26 days. This is a decrease compared to the 2020-21 financial year which had a median duration of 27 days . The median duration of short-term visitor trips in 2019-20 was 12 days, noting most of the travel in this time period occurred prior to the pandemic. The median duration of trip has been reducing as Australian border restrictions eased with short-term visitor arrivals in June 2022 having a median duration of stay of 17 days. This is similar to pre-COVID travel behaviour.

The median duration varied between the states and territories and between the numerous source countries.

11.9 Short-term visitor arrivals, Australia — Top 10 source countries(a) by State/Territory of stay — Median duration of stay (days) — 2021-22
NSWVic.QldSAWATas.NTACTAust.(b)
China(c)146182178180109182151182156
India9292919291122929292
Germany303030303031263130
Malaysia293130302430313030
UK272528302927312728
Canada232726303123302726
Indonesia212122312621312122
USA151918222121311717
Singapore111111131012121411
New Zealand9911121812151010
All countries253021362230313326
  1. Top 10 source countries have been calculated at the Australia level.
  2. Includes Other Territories.
  3. Excludes SARs and Taiwan.

In 2021-22, among the states and territories the median duration was the:

  • highest in SA at 36 days 
  • lowest for Qld at 21 days.

Those from China (with a median duration of stay of 156 days) stated much longer intended durations of stay than most others. This is up from 92 days recorded from the year before.

Those from New Zealand only visited for 10 days on average, this was down from 11 days recorded from the year before.

The median duration of stay of short-term visitors to Australia varied according to reason for journey. Those travelling for:

  • education (183 days) stayed the longest
  • employment (153 days)
  • visiting friends/relatives (30 days)
  • a holiday (12 days)
  • exhibition (11 days)
  • convention/conference and business stayed the shortest (both 9 days).

Arrivals - international students

Compares international student arrivals each month by visa type.

  • In October 2022 there were 28,690 international student arrivals to Australia, an increase of 28,520 students compared with the corresponding month of the previous year.
  • The number of student arrivals in October 2022 was 43.6% lower than the pre-COVID levels in October 2019.
  1. International student visa holders whether it be for a short-term (less than 1 year) or long-term (1 year or more) duration. This is not the same as when a traveller self reports 'education' as their main reason for journey.
  2. English Language Intensive Courses for Overseas Students.

Changes to international students arrivals section

The format for publishing international student arrivals by state in this publication has changed. Graphs comparing student arrivals by state from one year earlier have been removed and a new download “Table 16: Total Arrivals - State of Residence/Stay by Visa Group” has been added. This download contains time series data on arrivals by state of residence/stay by visa group, including data for the individual types of international student arrivals. This can be found in the data downloads section of this publication.

Resident returns - short-term

Compares international resident returns each month by destination country and change at the state and territory level. Analysis in this section is undertaken on short-term trips (less than 1 year).

For residents returning from overseas:

  • A total of 721,860 short-term trips were recorded, an increase of 716,790 compared with the corresponding month of the previous year.
  • The number of trips for October 2022 was 37.0% lower than the pre-COVID level in October 2019.
  • Indonesia was the most popular destination country, accounting for 14.0% of all resident returns.

Destination countries

The three leading destination countries residents returned from were:

  • Indonesia (98,100 trips)
  • New Zealand (89,870)
  • The USA (64,160).

Details

  1. Top 10 source countries based on month ending October 2022.
13.3 Short-term resident returns - Top 10 destination countries(a)
Country of StayOct 2019 (no.)Oct 2021 (no.)Sep 2022 (no.)Oct 2022 (no.)Sep 2022 to Oct 2022 change
Indonesia142,5105090,39098,1007,710
New Zealand125,28043090,40089,870-530
USA116,96064052,33064,16011,830
UK78,45056055,02057,3602,340
Singapore39,07010025,46038,01012,550
India29,09028020,99035,01014,020
Fiji33,0902032,47034,3301,860
Thailand53,1808025,47033,1207,650
Italy41,5508023,55026,4702,920
Vietnam27,4902016,03018,5702,540
  1. Top 10 source countries based on month ending October 2022.

State or territory of residence

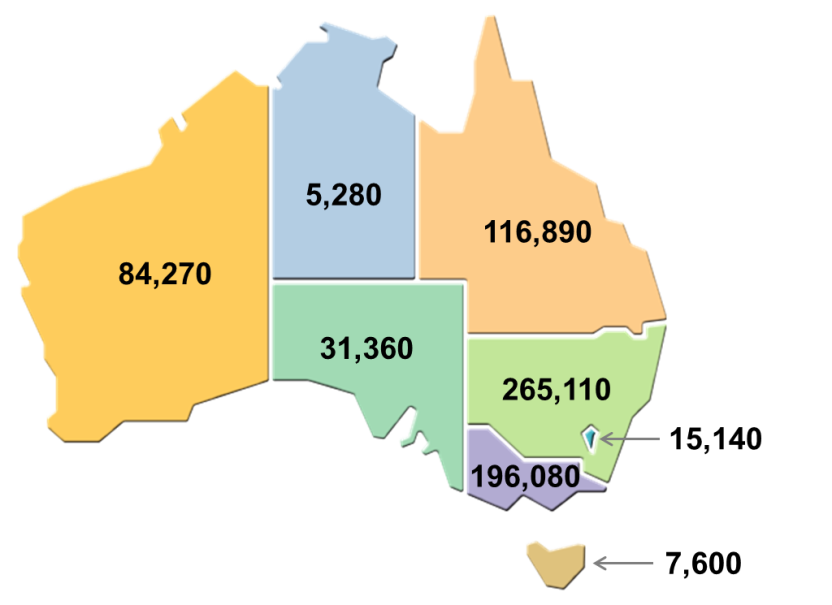
All travellers are asked their intended address in Australia upon arrival. For October 2022, the highest number of resident returns from short-term trips was observed for New South Wales (265,110), whilst the Northern Territory recorded the fewest (5,280).

Details

13.4 Short-term resident returns, State or territory of residence - October 2022

The image is a map of Australia, separated into states. Each state is labelled with the corresponding data for short-term resident returns for October 2022. For statistics for each state, refer to the October 2022 column of Table 13.5.
This map presents the number of short-term resident returns in Australia in October 2022, by their state of intended residence. - New South Wales (265,110) - Victoria (196,080) - Queensland (116,890) - South Australia (31,360) - Western Australia (84,270) - Tasmania (7,600) - Northern Territory (5,280) - Australian Capital Territory (15,140).
13.5 Short-term resident returns, State or territory of residence
State or territory of residenceOct 2019 (no.)Oct 2021 (no.)Sep 2022 (no.)Oct 2022 (no.)Sep 2022 to Oct 2022 change
NSW391,8101,210212,180265,11052,930
Vic.308,6101,030192,520196,0803,560
Qld204,0501,220110,540116,8906,350
SA57,83023024,48031,3606,880
WA139,60093071,01084,27013,270
Tas.14,070806,8307,600770
NT8,5802504,2405,2801,030
ACT21,33013011,89015,1403,250
Australia(a)1,145,9705,070633,790721,86088,080
  1. Includes Other Territories.
     

Resident returns - short-term - Financial year 2021-22

Compares annual international travel for resident returns over time by destination country, by state and territory, by age and sex, by main reason for journey and by median duration of trip. All analysis in this section is done on short-term trips (less than 1 year).

For the most recent analysis by calendar year see the March 2022 issue of OAD.

Australian residents returning to Australia in 2021-22:

  • There were 1,590,910 resident returns from overseas, a 611% increase on the previous year
  • New Zealand continued to be the leading destination country for Australians travelling overseas, accounting for 195,370 trips
  • The most popular reason for travel was 'visiting friends/relatives' (48.2%)
  • The median duration of trips away was 19 days.

Annual resident returns

The COVID-19 pandemic resulted in substantial declines in travel movements since the introduction of border restrictions in March 2020. These restrictions have eased progressively from November 2021 to February 2022, resulting in increased travel in the latter half of 2021-22.

In 2021-22 1,590,910 residents returned from overseas trips. This was an increase of 1,367,080 trips overseas on the previous financial year when 223,830 trips were taken. 96% of the 2021-22 resident returns occurred from November 2021 to June 2022.

14.1 Short-term resident returns by month
2021-22'000Change ('000)(a)
Jul41.8331.55
Aug10.312.24
Sep6.04-2.12
Oct5.07-6.09
Nov25.9112.91
Dec52.8338.53
Jan151.57140.22
Feb116.86108.47
Mar146.34137.08
Apr282.63265.64
May360.61298.25
Jun390.89340.39
Annual Total1,590.911,367.08
  1. Numerical change when compared to the same period of the previous year


The number of Australian residents travelling overseas has generally been increasing over recent decades, with the general trend interrupted by various historical events such as the: 

  • Early 1990s recession in Australia
  • September 11 terrorist attacks in 2001
  • Bali bombings in 2002
  • Severe Acute Respiratory Syndrome (SARS) outbreak in 2003
  • Global Financial Crisis (GFC) in 2008
  • global COVID-19 pandemic starting in 2020.


A substantial decline was observed in late March 2020 due to the impact of COVID-19. Prior to the pandemic, there were 11,352,800 million resident trips overseas in the year ending February 2020. More recently, we have seen travel by Australian residents has been increasing as border restrictions have been eased.

Destination countries

In 2021-22: 

  • Short-term resident returns for all top 5 destination countries have risen due to the easing of international travel restrictions from November 2021
  • New Zealand (195,370 trips) was the leading destination country
  • The USA (169,710) was the second most popular destination
  • India (157,500) was the third most popular destination.
  1. Top 5 destination countries based on year ending June 2022.

Among the top 10 destination countries, the strongest growth over the last decade was for Australians visiting Asian countries. Declines for these countries from 2020 were due to the impact of the COVID-19 pandemic, with increases now being seen in resident travel due to the easing of international travel restrictions.

14.4 Short-term resident returns, Australia — Top 10 destination countries(a) — 2021-22
Destination country'0002020-21 to 2021-22 change ('000)2011-12 to 2021-22 change ('000)
New Zealand195.3772.63-907.69
USA169.71159.12-673.05
India157.50150.17-51.02
UK129.64119.20-403.18
Fiji127.29126.64-210.83
Indonesia93.4090.65-829.02
Singapore71.7767.79-212.58
Thailand66.9965.32-521.79
Philippines33.8732.36-118.69
Pakistan31.8229.2116.29
All countries1590.911367.08-6424.67
  1. Top 10 source countries based on year ending June 2022.

State or territory of residence

All travellers are asked their intended address in Australia upon arrival.

During the COVID-19 pandemic, different state borders and airports were closed to international visitors at different times.

The proportions of residents returning to Australia after a short trip by their state or territory of residence in 2021-22 were as follows:

  • NSW (40.6% of all short-term resident returns)
  • Vic. (30.4%)
  • Qld (15.0%)
  • SA (3.2%)
  • WA (7.5%)
  • Tas. (0.7%)
  • NT (0.5%)
  • ACT (2.1%)

Most states and territories recorded growth in residents taking overseas trips in the ten year period up to early 2020. Western Australia remained steady from 2014 until the impact of the pandemic, while the Northern Territory fluctuated during the decade including a decline in the year before COVID-19. There was, however, a considerable drop for all states and territories from March 2020 due to the COVID-19 pandemic. The easing of travel restrictions from November 2021 has resulted in an increase of international travel from residents of all states.

At the state and territory level, the top destination country differed between states.

  • The USA was the lead destination for residents from NSW and ACT
  • India was the top destination for Vic
  • New Zealand was the most popular travel destination for Qld and Tas
  • India was the top destination for SA residents
  • Indonesia was the most popular travel destination for WA and NT.

Ten years earlier in 2011-12, New Zealand was the leading destination for residents of NSW, Vic, Qld and Tas. Indonesia was the leading destination for residents from SA, WA and NT and the USA was the lead destination for residents of ACT. 

Age and sex


There were more trips taken overseas by Australian men than women in 2021-22 (856,970 men compared with 733,940 women). Ten years earlier in 2011-12, there were also more trips taken by men than women (4,240,030 men compared with 3,775,550 women).

In 2021-22, Australian men and women travelling overseas had a similar median age (41 years and 38 years respectively). When broken down into five-year age groups, more women than men travelled in the age range of 15 to 29 and there were more men than women in all other age groups under 100 years of age.


Main reason for journey

In 2021-22, the most frequently stated main reason for journey by Australian residents returning home after a short-term trip was:

  • Visiting friends/relatives (48.2%)
  • Holiday (33.5%)
  • Business (8.1%).
  1. As a percentage of all short-term resident returns.

Female residents returning to Australia were more likely than males to record their main reason for journey as ‘visiting friends/relatives’ or ‘holiday’. Male residents were more likely to record ‘business’ or ‘employment’ than female residents.

During the pandemic and associated travel restrictions there was an increase in travellers recording 'Other' as their main reason for journey. 

14.8 Short-term resident returns, Australia — Main reason for journey and Sex — 2021-22
Main reason for journeyMales (%)Females (%)
Visiting friends/relatives44.252.8
Holiday32.534.6
Business11.73.9
Employment4.01.8
Convention/conference2.41.4
Education0.70.7
Exhibition0.10.1
Other4.44.6
Total100.0100.0

Duration of stay

For Australian residents returning from overseas their exact duration away is measured.

During 2021-22, the median duration away for Australian residents on a short-term trip was 19 days. This is a decrease compared to the 2020-21 financial year which had a median duration of 29 days. In 2019-20, when the majority of travel occurred prior to the pandemic (March 2020), the median duration was 15 days.

During the COVID period, the median duration away for short term resident returns was generally much higher than pre-pandemic travel, peaking in December 2020 at 258 days. Since the removal of travel restrictions, the duration of stay has been decreasing with June 2022 having a median duration of 16 days (reflecting pre-pandemic durations).

The median duration varied between the states and territories and between the numerous destination countries.

14.9 Short-term resident returns, Australia — Top 10 destination countries(a) by State/Territory of Residence — Median duration of stay (days) — 2021-22
NSWVic.QldSAWATas.NTACTAust.(b)
Pakistan424543424645544043
India313331313030333032
UK242424262428292324
Philippines222323242325191923
USA161718202318311617
Thailand161518181720231616
New Zealand101112121614181311
Indonesia1211101091191311
Singapore910910810999
Fiji898912101088
All countries192018231922222019
  1. Top 10 source countries have been calculated at the Australia level.
  2. Includes Other Territories.

In 2021-22, among the states and territories the median duration away overseas was the:

  • highest for those who lived in SA at 23 days
  • lowest for Qld residents at 18 days.

Residents visiting Pakistan (with a median duration of 43 days) stayed away the longest compared to other top 10 destination countries. 

Those residents travelling to Fiji only visited for 8 days on average, this was shorter than the other top 10 destinations.

The duration of stay of short-term trips by Australian residents going overseas varied according to reason for journey. Those travelling for:

  • education stayed away the longest (45 days)
  • employment (41 days)
  • visiting friends/relatives (26 days)
  • exhibition (13 days)
  • holiday (12 days)
  • business (11 days)
  • a convention/conference stayed the shortest (10 days).

Recent changes

Total Arrivals - State of Residence/Stay by Visa Group table added to Data downloads section

The format for publishing international student arrivals by state in this publication has changed. Graphs comparing student arrivals by state from one year earlier have been removed and a new download “Table 16: Total Arrivals - State of Residence/Stay by Visa Group” has been added. This download contains time series data on arrivals by state of residence/stay by visa group, including data for the individual types of international student arrivals. This can be found in the data downloads section of this publication.

Data downloads

I-notes

1. Due to improvements made to the quality of the imputations used to estimate duration of stay, OAD data from January to March 2022 has been revised and released in the April 2022 issue.  These imputations use historical data and have been impacted by changed travel behaviour during the COVID-19 travel restrictions period. For further information see Methodology page in the History of changes section for the year 2022.

2. The ABS identified a data quality issue with the source data which affected the state and territory of stay/residence data.  As a result, Overseas Arrivals and Departures data from July 2021 to February 2022 was revised and released in the March 2022 issue. For further information see Methodology page in the History of changes section for the year 2022.

3. For all Short-term Visitor Arrivals (STVA) and Short-term Resident Returns (STRR) series, the trend estimates have been suspended from February 2020 and the seasonally adjusted estimates have been suspended from April 2020 due to the impact of the COVID-19 pandemic on international travel. For more information, see the Seasonally adjusted and trend estimates section in the Methodology page associated with this release.

4. The quality of the imputation used to estimate duration of stay for some resident departures was impacted by changed travel behaviour during COVID-19 travel restrictions. The proportional split between short-term resident departures and long-term resident departures was impacted from April 2020 to December 2021. Where possible, instead of departure volumes, we recommend clients use short-term resident returns and long-term resident returns for greater accuracy. For more information on how this variable is imputed, please see paragraph 28 of the Imputations and derivations section of the Methodology page.

5. Occasionally situations occur that necessitate breaks being applied to the trend series. For an overview of the breaks currently included in the trend series, see paragraph 14 of the Seasonally adjusted and trend estimates section in the Methodology.

6. For further information about the data, including updates or changes, see the Methodology page.

Time series spreadsheets

Data files

Data Explorer datasets

Two Overseas Arrivals and Departures datasets are available in Data Explorer.

Caution: Data in Data Explorer is currently released after the 11:30am release on the ABS website. Please check the reference period when using Data Explorer.

For information on Data Explorer and how it works, see the Data Explorer user guide.

Data notes

This release contains overseas movement data which should not be interpreted as 'persons'. See the Scope section, paragraph 1 in the Methodology for more detail.

The statistics in this release have been rounded. See the Confidentiality section in the Methodology for more detail.

Enquiries

For enquiries about these and related statistics, contact the Customer Assistance Service via the ABS website Contact Us page. The ABS Privacy Policy outlines how the ABS will handle any personal information that you provide to the ABS.

Previous catalogue number

This release previously used catalogue number 3401.0

Back to top of the page