Australian National Accounts: National Income, Expenditure and Product

This is not the latest release View the latest release

Quarterly estimates of key economic flows in Australia, including gross domestic product (GDP), consumption, investment, income and saving

Reference period
December 2021
Released
2/03/2022

Key statistics

  • The Australian economy rose 3.4% in seasonally adjusted chain volume measures
  • Real net national disposable income rose 1.7%
  • The terms of trade fell 5.1%
  • Household saving ratio decreased to 13.6% from 19.8%

In this release

For a breakdown of key information from this and other recent economic releases, see ‘The Australian Economy: 12 things you need to know about the December quarter 2021’.

This quarter's National Accounts includes the following article:

Economic overview

Unless otherwise stated all figures are in seasonally adjusted, chain volume measures.

The reference year for chain volume measures is 2019-20.

For more information about the changes in this issue, please see revisions and changes on this page.

December key figures, percentage changes (a)

 Sep 20 to Dec 20Dec 20 to Mar 21Mar 21 to Jun 21Jun 21 to Sep 21Sep 21 to Dec 21Dec 20 to Dec 21
Chain volume GDP and related measures (b)
 GDP3.21.90.8-1.93.44.2
 GDP per capita (c)3.12.00.6-1.93.44.0
 Gross value added market sector (d)3.42.01.2-1.83.65.0
 Real net national disposable income5.53.52.4-3.81.73.7
Productivity
 GDP per hour worked-0.9-1.23.0-0.81.9
 Real unit labour costs6.60.3-0.1-0.7-0.3
Prices
 GDP chain price index (original)1.43.13.40.2-0.66.3
 Terms of trade5.37.87.60.2-5.110.2
Current price measures
 GDP4.33.83.2-0.63.410.2
 Household saving ratio14.213.611.819.813.6na

na not available
a. Change on preceding quarter, except for the last column which shows the change between the current quarter and the corresponding quarter of the previous year. Excludes Household saving ratio.
b. Reference year for chain volume measures and real income measures is 2019-20.
c. Population estimates are as published in the National, state and territory population (cat. no. 3101.0) and ABS projections.
d. ANZSIC divisions A to N, R and S. See Glossary - Market sector.

Australian economy rebounded 3.4% in the December quarter 2021

Gross Domestic Product (GDP) rose 3.4% this quarter as NSW, Victoria and the ACT came out of extended lockdowns in October 2021. This rise followed a fall of 1.9% in the previous quarter. GDP in the December quarter 2021 was 3.4% above December 2019 pre-pandemic levels. 

The emergence of the Omicron variant over the second half of December 2021 did not have a material impact on activity this quarter.

Private demand drives the rise in economic activity

Domestic final demand contributed 2.9 percentage points to GDP growth. Household final consumption expenditure contributed 3.2 percentage points, as restrictions on households and businesses were lifted. This was partly offset by investment, with both private (-0.3pp) and public (-0.1pp) investment detracting from growth. There was no contribution from government consumption this quarter, following a strong rise in September quarter 2021.

a. Contributions may not be additive due to rounding.

Household spending recovers as lockdown restrictions ease

Household spending rose 6.3% this quarter, recovering from the 4.8% fall in September and exceeding pre-pandemic levels for the first time.

Spending on services rose 6.3%. Hotels, cafes and restaurants (+24.3%), recreation and culture (+17.1%) and health (+7.9%) rose strongly as movement and trading restrictions lifted. Spending on services remains 3.9% below pre-pandemic levels, reflecting continued limitations on certain expenditure items such as travel.

Spending on goods rose 6.3%. This reflects the pent-up demand for items such as clothing and footwear, furnishings and recreational goods over the lockdown period where non-essential retail stores were closed. Spending on goods was 8.8% above pre-pandemic levels.

Jurisdictions coming out of lockdowns drive growth in domestic final demand

Domestic final demand was driven by NSW, Victoria and the ACT as they emerged from extended lockdowns. State final demand in these states rose 5.2%, compared to a fall of 0.1% for the rest of Australia. NSW recorded the strongest growth in state final demand (+6.7%), after spending the entirety of September quarter in lockdown.

Household spending was the main contributor to growth in the states coming out of lockdowns. Household spending in NSW, Victoria and the ACT increased 9.6%, compared to a 1.6% rise for the rest of Australia.

Domestic price pressures build

Supply chain disruptions and materials shortages continue to place upward pressure on domestic prices. The domestic final demand implicit price deflator rose 1.1%, the fastest rate since September 2008.

The terms of trade fell 5.1% this quarter, driven by strong growth in import prices (+5.8%) while export prices increased 0.4%. Upward pressure on import prices was driven by elevated global demand for goods and supply disruptions.

Operating surplus mixed across Mining and non-Mining industries

Gross operating surplus plus gross mixed income (GOSMI) rose 0.9%. Non-Mining operating surplus rose 2.9%, reflecting increased activity and price pressures across industries such as Manufacturing, Professional, Scientific and Technical Services and Agriculture, Forestry and Fishing. The rise was tempered by a decline in COVID-19 related subsidies paid to businesses.

Mining operating surplus fell 5.1% this quarter, partly reflecting lower prices for iron ore. Exports of mining commodities fell 2.9% in current price terms. 

Services industries drive an increase in gross value added

Gross value added rose 3.2%. Hospitality and other service-related industries recorded strong rises as lockdown restrictions wound down.

A bumper grain harvest drove a 9.0% rise in Agriculture, Forestry and Fishing gross value added. The impacts of this flowed through the supply chain, including in Wholesale Trade (+3.5%) and Transport, Postal and Warehousing (+3.0%).

Activity in 7 of the 19 industries remained below pre-pandemic levels.

Improvements in the labour market support growth in COE

COE rose 2.0% this quarter, reflecting both increased hours worked and employment.

Private COE rose 2.2%, rebounding from last quarter's 0.4% fall as trading and movement restrictions ended in several states.

Public COE rose 1.5%, reflecting the continued public sector COVID-19 response through vaccinations, hospitalisations and testing. Public COE is up 4.2% through the year.

Household saving ratio declines following reductions in government assistance

The household saving ratio declined from 19.8% to 13.6%, remaining above pre-pandemic levels.

The fall in household saving was driven by increased household spending, coupled with a decline in household income. Household gross disposable income fell 0.5%, driven by a decline in support payments from government following the end of lockdowns. This was partly offset by the rise in compensation of employees.

Expenditure

 % Change% Change% points contribution to growth in GDP
Sep 21 to Dec 21Dec 20 to Dec 21Sep 21 to Dec 21
Final consumption expenditure   
 General government0.15.1-
 Households6.33.53.2
 Total final consumption expenditure4.44.03.2
Gross fixed capital formation   
 Private   
  Dwellings-2.25.3-0.1
  Ownership transfer costs-3.721.5-0.1
  Non-dwelling construction-1.23.3-0.1
  Machinery and equipment-1.58.8-0.1
  Cultivated biological resources8.36.6-
  Intellectual property products2.19.4-
 Public-2.05.4-0.1
 Total gross fixed capital formation-1.57.0-0.4
Changes in inventoriesnana0.9
Gross national expenditure3.85.03.7
Exports of goods and services-1.5-2.6-0.3
Imports of goods and services-0.91.00.2
Statistical discrepancy (E)nana-0.1
Gross domestic product3.44.23.4

- nil or rounded to zero (including null cells)
na not available

Final consumption expenditure (FCE) 4.4%

Household FCE rose 6.3%, driven by a:

  • 17.1% rise in recreation and culture
  • 41.6% rise in clothing and footwear
  • 24.3% rise in hotels, cafes and restaurants
  • 13.9% rise in operation of vehicles
  • 7.9% rise in health

The increase was partly offset by a:

  • 2.3% fall in food
  • 2.5% fall in purchase of vehicles
  • 3.0% fall in cigarettes and tobacco
  • 2.0% fall in alcoholic beverages
  • 1.4% fall in electricity, gas and other fuel

General government FCE rose 0.1%, driven by a:

  • 1.2% rise in state and local

The increase was partly offset by a:

  • 4.9% fall in national defence
  • 0.4% fall in national non-defence

Gross fixed capital formation (GFCF) -1.5%

Private investment decreased 1.4%, driven by a:

  • 2.2% decrease in dwellings
  • 3.7% decrease in ownership transfer costs
  • 1.5% decrease in machinery and equipment

Public investment decreased 2.0%, driven by a:

  • 24.9% decrease in national defence
  • 7.9% decrease in national non-defence

The decrease was partly offset by a:

  • 1.9% increase in state and local general government
  • 2.8% increase in public corporations

Changes in inventories

Total inventories rose $1,502m following a fall of $2,872m in the September quarter. The largest contributors to the rise were a:

  • $2,736m rise in wholesale trade
  • $692m rise in public authorities
  • $459m rise in manufacturing

The rise was partly offset by a:

  • $1,106m fall in farm 
  • $883m fall in retail trade
  • $258m fall in mining

Exports and imports of goods and services

Exports of goods and services fell 1.5%, driven by a:

  • 5.3% fall in other mineral fuels
  • 4.9% fall in coal
  • 9.1% fall in travel services
  • 13.5% fall in metals and metal manufacturing

The fall was partly offset by a:

  • 23.8% rise in cereals
  • 8.8% rise in non-monetary gold
  • 0.7% rise in mineral ores

Imports of goods and services fell 0.9%, driven by a:

  • 34.5% fall in capital goods nes
  • 10.3% fall in non-industrial transport equipment
  • 7.3% fall in machinery and industrial equipment
  • 5.0% fall in other services

The fall was partly offset by a:

  • 7.7% rise in processed industrial supplies nes
  • 61.5% rise in civil aircraft and confidential items

Income

Income estimates are in seasonally adjusted current prices

 % Change% Change% points contribution to growth in GDP
Sep 21 to Dec 21Dec 20 to Dec 21Sep 21 to Dec 21
Compensation of employees2.05.30.9
Gross operating surplus   
 Private non-financial corporations0.49.60.1
 Other (a)0.53.70.1
Gross mixed income3.011.70.3
Taxes less subsidies on production and imports29.273.72.0
Statistical discrepancy (I)nana-
Gross domestic product3.410.23.4

- nil or rounded to zero (including null cells)
na not available
a. Includes Public non-financial corporations, Financial corporations, General government and Dwellings owned by persons.

Compensation of employees (COE) 2.0%

Compensation of employees rose 2.0%, private sector COE rose 2.2% and public sector COE rose 1.5%. Hours worked rose 4.3% in the quarter.

Six states and territories recorded quarterly rises. The largest increases were:

  • 3.4% rise in NSW
  • 1.5% rise in VIC

Partly offset by a:

  • 4.0% fall in NT
  • 0.3% fall in TAS

Gross operating surplus (GOS) 0.4%

Private non-financial corporations GOS increased 0.4%, driven by a:

  • rise in Manufacturing reflecting broad-based increases in prices for manufactured goods
  • rise in Professional, Scientific and Technical Services driven by professional services to support pre-construction work and IT services

Partly offset by a:

  • fall in Mining reflecting a significant fall in the price of iron ore
  • fall in Retail Trade, Wholesale Trade and Accommodation and Food Services as businesses partially absorbed the rise in input costs resulting in decline in profits

Other sectors GOS rose 0.5%, driven by a:

  • 1.2% rise in financial corporations
  • 0.3% rise in dwellings owned by persons

Partly offset by a:

  • 2.7% fall in public non-financial corporations

Taxes less subsidies on production and imports 29.2%

Taxes less subsidies on production and imports rose 29.2%. Taxes on production and imports rose 9.8% driven by GST, gambling tax and payroll tax as economic activity rebounded from lockdowns in the previous quarter. Subsidies on production fell, reflecting a reduction in various state and local support payments for businesses during COVID-19 related trading restrictions. 

Production

 % Change% Change% points contribution to growth in GDP
Sep 21 to Dec 21Dec 20 to Dec 21Sep 21 to Dec 21
Agriculture, Forestry and Fishing9.019.40.2
Mining-1.0-0.1-0.1
Manufacturing1.84.50.1
Electricity, Gas, Water and Waste Services-1.0-0.1-
Construction1.97.40.1
Wholesale Trade3.51.80.1
Retail Trade7.43.50.3
Accommodation and Food Services26.11.70.4
Transport, Postal and Warehousing3.07.40.1
Information Media and Telecommunications3.44.80.1
Financial and Insurance Services1.13.60.1
Rental, Hiring and Real Estate Services2.99.80.1
Professional, Scientific and Technical Services5.35.50.4
Administrative and Support Services5.111.60.2
Public Administration and Safety1.62.00.1
Education and Training0.41.4-
Health Care and Social Assistance5.87.10.4
Arts and Recreation Services8.26.70.1
Other Services15.47.40.2
Ownership of dwellings0.51.8-
Taxes less subsidies on products4.3-1.20.3
Statistical discrepancy (P)nana0.2
Gross domestic product3.44.23.4

- nil or rounded to zero (including null cells)
na not available

Agriculture, Forestry and Fishing 9.0%

This increase was driven by a:

  • 10.9% rise in Agriculture driven by a record grain harvest. Exports of cereal products rose 23.8%.

This was partly offset by a:

  • 0.8% fall in Forestry and Fishing

Mining -1.0%

This decrease was driven by a:

  • 4.5% fall in Coal Mining driven by heavy rainfall and labour constraints affecting mine operations
  • 1.5% fall in Oil and Gas Extraction driven by maintenance activities, natural field decline, and adverse weather
  • 4.5% fall in Other Mining driven by planned and unplanned maintenance activities impacting copper production, partly offset by increased gold production

This was partly offset by a:

  • 0.7% rise in Iron Ore Mining following disruptions to production due to mine upgrades during the September quarter 2021

Manufacturing 1.8%

This increase was driven by a: 

  • 4.7% rise in Other Manufacturing driven by strong demand for textiles, clothing, and furniture products with the easing of COVID-19 lockdown restrictions in NSW, Victoria and the ACT
  • 1.9% rise in Food, Beverage and Tobacco Products driven by beverage manufacturing
  • 2.0% rise in Petroleum, Coal, Chemical and Rubber Products reflecting increased demand for fertilisers, as well as fuels and lubricants

Electricity, Gas, Water and Waste Services -1.0%

This decrease was driven by a:

  • 1.5% fall in Water Supply and Waste Services driven by reduced demand for water supply services following heavy rainfall, partly offset by increased recycling activity
  • 3.6% fall in Gas Supply driven by falls in industrial usage
  • 0.3% fall in Electricity Supply due to mild weather conditions resulting in reduced demand for cooling

Construction 1.9%

This increase was driven by a: 

  • 2.9% rise in Construction Services as activity rebounded after restrictions affected small scale projects on residential homes in the previous quarter
  • 2.6% rise in Heavy and Civil Engineering Construction reflecting increased work done on public infrastructure projects

This was partly offset by a:

  • 0.9% fall in Building Construction as material and labour shortages impacted construction activity. Building Construction GVA is up 4.8% through the year.

Wholesale Trade 3.5%

This increase was driven by:

  • Basic Material Wholesaling following a record grain harvest and increased demand for fuel and lubricants as lockdown restrictions eased
  • Machinery & Equipment Wholesaling with increased demand for agricultural machinery and telecommunications equipment
  • Grocery, Liquor and Tobacco Wholesaling due to increased demand for alcohol and specialised food

Retail Trade 7.4%

This increase was driven by:

  • Other Store Based Retailing as stores reopened across NSW, Victoria and the ACT as COVID-19 restrictions were eased
  • Motor Vehicle and Motor Vehicle Parts Retailing due to increased fuel retailing and vehicle operations as extended lockdown restrictions ended. Purchase of motor vehicles fell due to supply chain disruptions.

This was partly offset by:

  • Food Retailing as households were able to dine out with the easing of trading restrictions, reducing food consumption at home

Accommodation and Food Services 26.1%

This increase was driven by:  

  • Food and Beverage Services following the re-opening of cafes, hotels and restaurants due to easing of COVID-19 restrictions in NSW, Victoria and the ACT
  • Accommodation Services rose as regional and interstate travel were reintroduced in NSW, Victoria and the ACT

Transport, Postal and Warehousing 3.0%

This increase was driven by a:

  • 2.6% rise in Transport, Postal and Storage Services with continued demand for Postal, Courier and Other Services driven by online shopping and delivery services. The rise in Warehousing and Storage Services was driven by high demand from the agriculture industry.
  • 3.2% rise in Road Transport with increased demand for road freight from the agricultural sector and increased passenger transport as lockdown restrictions eased
  • 56.5% rise in Air and Space Transport with the easing of COVID-19 restrictions on domestic and international travel

This was partly offset by a:

  • 2.1% fall in Rail, Pipeline and Other Transport due to supply chain and logistics interruptions for Water, Pipeline, and Other Transport

Information Media and Telecommunications 3.4%

This increase was driven by a:

  • 7.4% rise in Other Information and Media Services driven by increases in Publishing and Motion Picture and Sound Recording Activities and Broadcasting and Internet Service Providers (ISP)

This was partly offset by a:

  • 1.1% fall in Telecommunication Services as data usage fell following a rise in the previous quarter

Financial and Insurance Services 1.1%

This increase was driven by a:

  • 1.1% rise in Finance, reflecting a rise in dwelling loan balances with improved housing market activity and strength in personal deposit balances as household saving remained elevated. Business loans and deposits also contributed to the increase.
  • 1.1% rise in Other Financial and Insurance Services reflecting an increase in superannuation with a rise in personal and employer contributions. Financial auxiliary services also contributed to the rise.

Rental, Hiring and Real Estate Services 2.9%

This increase was driven by a:

  • 2.2% rise in Property Operators and Real Estate Services driven by strength in non-residential property operators and increased real estate activity
  • 7.4% rise in Rental and Hiring Services with a rebound in demand for car hire and other tourism-related rental services

Professional, Scientific and Technical Services 5.3%

This increase was driven by a:

  • 5.0% rise in Other Professional, Scientific, and Technical Services with strong demand for marketing analytics, consulting services and pre-construction activity
  • 6.1% rise in Computer System Design and Related Services due to a continued demand for IT and software consultants

Administrative and Support Services 5.1%

  • Administrative Services rose due to increased demand for employment and recruitment services, and travel agency services as restrictions were lifted.

Health Care and Social Assistance 5.8%

  • Health Care and Social Assistance rose driven by private health as the demand for allied health and dental services increased. Public health with increased testing and vaccination programs, as the COVID-19 health response continued in the quarter.

Arts and Recreation Services 8.2%

  • Arts and Recreation Services rose in line with easing COVID-19 restrictions in NSW, Victoria and the ACT resulting in re-opening of theme parks, theatres and casinos.

Other Services 15.4%

  • Personal and Other Services rose reflecting increased demand for personal care services. Repair and Maintenance rose driven by car servicing activity as lockdown restrictions were lifted.

State and territory final demand

 Percentage change from Sep 21 to Dec 21
NSWVic.QldSAWATas.NTACTAust.(a)
Final consumption expenditure         
 General government-0.61.6-0.51.31.0-1.8-3.6-1.70.1
 Households11.47.52.01.41.50.5-0.28.46.3
Gross fixed capital formation         
 Private4.1-3.0-3.3-3.0-2.8-9.2-0.70.7-1.4
 Public0.1-0.5-6.1-4.8-4.12.7-5.70.9-2.0
State final demand6.73.70.00.30.1-1.5-1.81.92.9

- nil or rounded to zero (including null cells)
a. Australia estimates relate to Domestic final demand.

Quarterly volume measures, seasonally adjusted

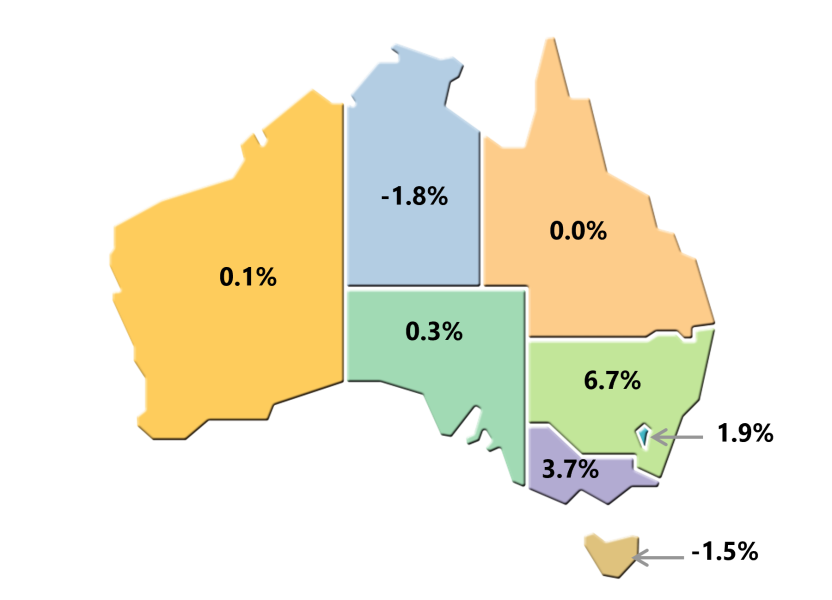
This image is a map of Australia by state/territory showing state final demand in quarterly volume terms..
This image is of a map of Australia showing quarterly volume measures of state final demand by state/territory. New South Wales' state final demand increased 6.7% for the quarter. Victoria's state final demand increased 3.7% for the quarter. Queensland's state final demand was unchanged for the quarter. South Australia's state final demand increased 0.3% for the quarter. Western Australia's state final demand increased 0.1% for the quarter. Tasmania's state final demand decreased 1.5% for the quarter. Northern Territory's state final demand decreased 1.8% for the quarter. Australian Capital Territory's state final demand increased 1.9% for the quarter.

New South Wales 6.7%

Total final consumption expenditure increased 7.8%, driven by a:

  • 11.4% increase in household consumption, as restrictions were eased following lockdown in the previous quarter. Spending on recreation and culture, clothing and footwear and hotels, cafes and restaurants led the rise.

Partially offset by a: 

  • 0.6% decrease in government consumption led by weakness in national defence expenditure

Private gross fixed capital formation increased 4.1%, due to a:

  • 8.3% increase in machinery and equipment investment, led by a rebound in purchases of equipment within the Accommodation and food services industry following lockdown
  • 5.0% rise in non-dwelling construction reflecting strength in new buildings as construction activity returned following the lifting of restrictions
  • 3.3% increase in total dwellings led by strength in other residential dwellings following restrictions on building activity in the previous quarter

Public gross fixed capital formation increased 0.1%, driven by a:

  • 4.3% increase in state and local general government in line with the recovery in construction activity
  • 10.3% increase in Commonwealth public non-financial corporations due to on-going investment in utility and transport infrastructure

Partially offset by a:

  • 17.1% decrease in national general government investment following large purchases of assets in the prior quarter

Victoria 3.7%

Total final consumption expenditure increased 5.7%, due to a:

  • 7.5% increase in household final consumption expenditure due to eased lockdown restrictions. Recreation and culture, clothing and footwear and hotels, cafes and restaurants expenditure led the rises.
  • 1.6% increase in government consumption led by an increase in state and local expenditure. Expenditure on health related use of goods and services continued to grow in due to the ongoing response to the COVID-19 pandemic.

Private gross fixed capital formation decreased 3.0%, driven by a:

  • 11.1% decrease in non-dwelling construction following elevated investment in renewable energy projects in the prior quarter
  • 2.3% fall in total dwellings reflecting project delays due to constraints on materials and labour

Partially offset by a:

  • 3.0% increase in machinery and equipment reflecting a rise in spending on new assets in the Transport, Postal and Warehousing, and Construction industries. 

Public gross fixed capital formation decreased 0.5%, driven by a:

  • 20.2% decrease in national general government investment following large purchases of assets in the prior quarter

Partially offset by:

  • 4.5% increase in state and local general government driven by investment in health facilities

Queensland 0.0%

Total final consumption expenditure increased 1.2%, driven by a: 

  • 2.0% increase in household consumption expenditure led by strength in the discretionary categories including recreation and culture, clothing and footwear and hotels, cafes and restaurants. Purchase of vehicles experienced a large fall due to supply shortages.

Partially offset by a:

  • 0.5% decrease in government expenditure led by weakness in national defence expenditure and falls in state and local government spending

Private gross fixed capital formation decreased 3.3%, due to a:

  • 6.1% decrease in total non-dwelling construction following two quarters of strong growth led by renewable energy projects and the completion of new buildings
  • 4.4% decrease in total dwellings led by decreases in houses and alterations and additions as construction material and labour shortages caused project delays

Public gross fixed capital formation decreased 6.1%, due to a:

  • 23.3% decrease in National general government investment following large purchases of assets in the prior quarter
  • 3.0% fall in state and local general government driven by the education sector

Partly offset by a:

  • 0.4% rise in public non-financial corporations.

South Australia 0.3%

Total final consumption expenditure increased 1.4%, due to a:

  • 1.4% increase in household consumption driven by strength in hotels, cafes and restaurants, operations of vehicles and recreation and culture
  • 1.3% increase in government final consumption driven by a rise in state and local spending on health, education and transport. This was partially offset by weakness in national government consumption expenditure following elevated defence spending in the prior quarter. 

Private gross fixed capital formation decreased 3.0%, driven by a:

  • 15.3% decrease in machinery and equipment investment following a number of large purchases in the previous quarter
  • 6.6% fall in total dwellings reflecting weakness across houses, other residential and alterations and additions

Partly offset by a:

  • 4.7% increase in non-dwelling construction led by strength in mining investment

Public gross fixed capital formation decreased 4.8%, driven by a:

  • 17.4% decrease in national general government investment following large purchases of assets in the prior quarter
  • 15.0% decrease in Commonwealth public non-financial corporations driven by a fall in investment in buildings

Partly offset by a:

  • 1.6% rise in state and local general government, reflecting strength in education structures and buildings investment

Western Australia 0.1%

Total final consumption expenditure increased 1.4%, due to a:

  • 1.5% increase in household consumption driven by strength across most goods and services. This was partially offset by weakness in purchases of vehicles.
  • 1.0% increase in government consumption driven by increases in both health employee expenses and use of goods and services. This was partially offset by a fall in national consumption expenditure following a strong spending on defence the previous quarter. 

Private gross fixed capital formation decreased 2.8%, due to a:

  • 10.0% decrease in machinery and equipment, with the fall following elevated equipment spend from mining businesses over the last year
  • 2.9% decrease in total dwellings led by a fall in new houses

Partially offset by a:

  • 2.7% increase in total non-dwelling construction led by an increase in new building investment across industries

Public gross fixed capital formation decreased 4.1%, driven by a:

  • 21.8% decrease in National general government  following large purchases of assets in the prior quarter
  • 3.7% decrease in state and local general government

Partially offset by a:

  • 6.0% increase in state and local public non-financial corporations due to increased investment on infrastructure

Tasmania -1.5%

Total final consumption expenditure decreased 0.2%, due to a:

  • 1.8% decrease in government consumption expenditure driven by a fall in social benefits to households. Commonwealth defence consumption expenditure was also weaker after a strong rise in the September quarter.

Partially offset by a:

  • 0.5% increase in household consumption reflecting the strength in hotels, cafes and restaurants, operation of vehicles and transportation services

Private gross fixed capital formation decreased 9.2%, driven by a:

  • 18.9% decrease in total machinery and equipment following a strong rise in the previous quarter
  • 8.2% fall in total dwellings led by weakness in houses and alterations and additions, reflecting the impact of material and labour supply shortages

Public gross fixed capital formation increased 2.7%, driven by a:

  • 7.9% increase in state and local general government investment in new buildings

Northern Territory -1.8%

Total final consumption expenditure decreased 1.7%, driven by a:

  • 3.6% decrease in government final consumption expenditure, with falls at both the national and state and local level
  • 0.2% decrease in household final consumption expenditure reflecting the impacts of a series of local lockdowns throughout the quarter

Private gross fixed capital formation decreased 0.7%, due to a: 

  • 14.9% fall in total machinery and equipment due to fewer vehicle and construction equipment purchases
  • 10.5% decrease in ownership transfer costs due to lower stamp duty transfers

Partially offset by a:

  • 7.0% increase in non-dwelling construction due to increases in engineering construction

Public gross fixed capital formation decreased 5.7%, driven by a:

  • 30.8% decrease in state and local public non-financial corporations led by falls in structures following the completion of projects in prior quarters
  • 3.3% decrease in state and local general government

Australian Capital Territory 1.9%

Total final consumption expenditure increased 2.1% driven by a:

  • 8.4% increase in household consumption expenditure reflecting the easing of lockdown measures and the recovery across discretionary components including recreation and culture, clothing and footwear and hotels, cafes and restaurants

Partially offset by a:

  • 1.7% decrease in government consumption expenditure led by a decrease in national consumption expenditure following elevated defence expenditure in the September quarter. State and local expenditure partially offset the fall led by a rise in social benefits to households.

Private gross fixed capital formation increased 0.7%, driven by a:

  • 16.1% rise in total non-dwelling construction as construction activity recovered following lockdowns in the previous quarter
  • 3.3% increase in total dwellings reflecting led by strength in houses as restrictions on construction activity were lifted

Partially offset by a:

  • 29.3% decrease in ownership transfer costs following consecutive quarters of elevated growth

Public gross fixed capital formation increased 0.9%, driven by a:

  • 85.6% increase in state and local public non-financial corporations driven by increased work on structures

Partially offset by a:

  • 2.9% decrease in National general government following large purchases of assets in the prior quarter

Key tables

Key national accounts aggregates

  Sep 20 to Dec 20Dec 20 to Mar 21Mar 21 to Jun 21Jun 21 to Sep 21Sep 21 to Dec 21Through the year, Dec 20 to Dec 21
Percentage change (a)
Chain volume GDP and related measures (b)
 GDP3.21.90.8-1.93.44.2
 GDP per capita (c)3.12.00.6-1.93.44.0
 Gross value added market sector (d)3.42.01.2-1.83.65.0
 Net domestic product3.82.10.9-2.44.14.6
Real income measures (b)
 Real gross domestic income4.43.62.4-1.71.96.4
 Real gross national income4.63.02.3-3.21.53.4
 Real net national disposable income5.53.52.4-3.81.73.7
 Real net national disposable income per capita (c)5.43.72.2-3.81.63.5
Current price measures
 GDP4.33.83.2-0.63.410.2
Productivity
 Hours worked3.20.92.0-4.84.32.2
 Hours worked market sector (d)3.61.22.5-6.15.62.9
 GDP per hour worked-0.9-1.23.0-0.81.9
 Gross value added per hour worked market sector (d)-0.10.7-1.24.6-1.92.1
 Real unit labour costs6.60.30.00.1-0.7-0.3
 Real unit labour costs - non-farm7.10.20.30.3-0.10.7
Prices
 GDP implicit price deflator1.01.92.41.30.05.7
 Domestic final demand implicit price deflator0.40.40.80.71.13.0
 Terms of trade5.37.87.60.2-5.110.2
Levels
Chain volume GDP and related measures (b)
 GDP ($m)500 907510 212514 273504 638521 931. .
 GDP per capita (c) ($)19 48819 87019 98319 60820 274. .
 Gross value added market sector (d) ($m)333 908340 529344 658338 558350 710. .
 Net domestic product ($m)411 863420 698424 275414 154430 968. .
Real income measures (b)
 Real gross domestic income ($m)506 756525 249538 082529 026539 255. .
 Real gross national income ($m)504 552519 463531 247514 140521 833. .
 Real net national disposable income ($m)414 767429 484439 889422 983430 023. .
 Real net national disposable income per capita (c) ($)16 13716 72617 09316 43516 704. .
Current price measures
 GDP ($m)508 008527 286544 361541 260559 659. .
 GDP per capita (c) ($)19 76420 53521 15221 03121 739. .
 Gross national income ($m)505 813521 504537 762527 332543 129. .
 National net saving ($m)38 38848 94756 97253 79749 199. .
 Household saving ratio14.213.611.819.813.6. .
Prices
 Terms of trade (index) (e)105.3113.5122.1122.3116.1. .

. . not applicable
- nil or rounded to zero
a. Change on preceding quarter; last column shows the change between the current quarter and the corresponding quarter of the previous year.
b. Reference year for chain volume measures and real income measures is 2019-20.
c. Population estimates are as published in the National, state and territory population (cat. no. 3101.0) and ABS projections.
d. ANZSIC divisions A to N, R and S. See Glossary - Market sector.
e. Reference year for indexes is 2019-20 = 100.0.

Revisions to percentage changes (a)

  Sep 20 to Dec 20Dec 20 to Mar 21Mar 21 to Jun 21Jun 21 to Sep 21
Percentage change (a)
Chain volume GDP and related measures (b)
 GDP-0.10.10.1-
 GDP per capita (c)-0.10.10.10.1
 Gross value added market sector (d)-0.20.10.10.1
 Net domestic product-0.1-0.2-
Real income measures (b)
 Real gross domestic income--0.1--
 Real gross national income-0.10.1--0.1
 Real net national disposable income-0.1--0.1-
 Real net national disposable income per capita (c)-0.20.2--
Current price measures
 GDP-0.20.1-0.1-
 Household saving ratio (e)--0.1--
Productivity
 Hours worked-0.5-0.7-0.50.6
 Hours worked market sector (d)-0.3-0.6-0.40.7
 GDP per hour worked0.40.70.5-0.7
 Gross value added per hour worked market sector (d)0.30.60.6-0.7
 Real unit labour costs0.1---
 Real unit labour costs - non-farm----
Prices
 Terms of trade0.1-0.4-0.1-0.2

- nil or rounded to zero
a. Change on preceding quarter.
b. Reference year for chain volume measures and real income measures is 2019-20.
c. Population estimates are as published in the National, state and territory population (cat. no. 3101.0) and ABS projections.
d. ANZSIC divisions A to N, R and S. See Glossary - Market sector.
e. Revisions to levels.

Analytical expenditure aggregates

Percentage changes

 Sep 20 to Dec 20Dec 20 to Mar 21Mar 21 to Jun 21Jun 21 to Sep 21Sep 21 to Dec 21Through the year, Dec 20 to Dec 21Contribution to growth, Sep 21 to Dec 21
Final consumption expenditure
 General government0.80.01.23.80.15.1-
 Households4.51.21.1-4.86.33.53.2
  Goods2.9-0.70.7-3.26.32.81.3
  Services5.62.51.3-5.86.33.91.9
  Essential1.30.10.7-0.91.91.80.6
  Discretionary10.53.11.6-11.214.26.22.6
Gross fixed capital formation  
 Private3.46.11.90.7-1.47.4-0.3
  Mining3.21.1-1.9-1.1-0.4-2.2-
  Non-mining2.06.52.50.9-0.69.4-0.1
  Total private business investment2.35.11.40.4-0.56.4-0.1
 Public4.01.67.6-1.7-2.05.4-0.1
Final demand       
 Public 1.40.32.42.7-0.35.2-0.1
 Private 4.32.41.3-3.44.24.43.0

- nil or rounded to zero

Revisions to percentage changes

 Sep 20 to Dec 20Dec 20 to Mar 21Mar 21 to Jun 21Jun 21 to Sep 21
Final consumption expenditure
 General government---0.10.2
 Households-0.1-0.1-
  Goods---0.1
  Services-0.1---
  Essential----
  Discretionary-0.20.1-0.1
Gross fixed capital formation
 Private-0.30.1--0.1
  Mining-0.20.1-0.60.4
  Non-mining--0.10.3-0.5
  Total private business investment--0.10.1-0.3
 Public0.2-0.1--
Final demand    
 Public ---0.10.2
 Private -0.1---

- nil or rounded to zero

Expenditure aggregates

Contributions to growth

 Sep 20 to Dec 20Dec 20 to Mar 21Mar 21 to Jun 21Jun 21 to Sep 21Sep 21 to Dec 21
Final consumption expenditure
 General government0.2-0.30.8-
 Households2.40.60.6-2.53.2
Gross fixed capital formation
 Private0.61.10.30.1-0.3
 Public0.20.10.4-0.1-0.1
Domestic final demand3.31.81.6-1.72.9
Changes in inventories-0.10.8-0.1-1.20.9
Exports of goods and services1.00.1-0.70.3-0.3
Imports of goods and services-0.9-0.7-0.20.50.2
Statistical discrepancy (E)-0.1-0.20.30.2-0.1
Gross domestic product3.21.90.8-1.93.4

- nil or rounded to zero

Expenditure on GDP

Percentage changes

 Sep 20 to Dec 20Dec 20 to Mar 21Mar 21 to Jun 21Jun 21 to Sep 21Sep 21 to Dec 21Through the year, Dec 20 to Dec 21Contribution to growth, Sep 21 to Dec 21
Final consumption expenditure
 General government0.80.01.23.80.15.1-
 Households4.51.21.1-4.86.33.53.2
 Total final consumption expenditure3.40.81.1-2.34.44.03.2
Private gross fixed capital formation
 Dwellings3.16.70.50.4-2.25.3-0.1
 Ownership transfer costs 12.811.29.93.1-3.721.5-0.1
 Non-dwelling construction -2.51.20.13.3-1.23.3-0.1
 Machinery and equipment 9.511.61.9-2.8-1.58.8-0.1
 Cultivated biological resources 0.74.94.4-10.28.36.6-
 Intellectual property products 2.32.73.11.22.19.4-
 Total private gross fixed capital formation 3.46.11.90.7-1.47.4-0.3
Public gross fixed capital formation
 Public corporations-2.1-0.82.5-2.12.82.5-
 General government5.82.38.9-1.6-3.26.2-0.1
 Total public gross fixed capital formation 4.01.67.6-1.7-2.05.4-0.1
Total gross fixed capital formation3.65.13.20.1-1.57.0-0.4
Domestic final demand3.41.81.6-1.72.94.72.9
Changes in inventories. .. .. .. .. .. .0.9
Exports of goods and services4.80.6-3.11.5-1.5-2.6-0.3
Imports of goods and services5.03.51.2-2.8-0.91.00.2
Statistical discrepancy (E). .. .. .. .. .. .-0.1
Gross domestic product3.21.90.8-1.93.44.23.4

. . not applicable
- nil or rounded to zero

Revisions to percentage changes

 Sep 20 to Dec 20Dec 20 to Mar 21Mar 21 to Jun 21Jun 21 to Sep 21
Final consumption expenditure
 General government---0.10.2
 Households-0.1-0.1-
 Total final consumption expenditure-0.1--0.1
Private gross fixed capital formation
 Dwellings-0.90.3-0.10.3
 Ownership transfer costs 0.20.7-0.1-
 Non-dwelling construction --0.30.2-0.6
 Machinery and equipment -0.2-0.20.1
 Cultivated biological resources 0.81.34.8-2.6
 Intellectual property products -0.1-0.1-
 Total private gross fixed capital formation -0.30.1--0.1
Public gross fixed capital formation
 Public corporations-0.30.30.10.3
 General government0.3-0.2-0.1-0.1
 Total public gross fixed capital formation 0.2-0.1--
Total gross fixed capital formation-0.10.1--0.1
Domestic final demand-0.1--0.1
Gross national expenditure-0.20.1-0.2
Exports of goods and services--0.30.30.3
Imports of goods and services-0.40.10.11.2
Gross domestic product-0.10.10.1-

- nil or rounded to zero

Household final consumption expenditure

Percentage changes

 Sep 20 to Dec 20Dec 20 to Mar 21Mar 21 to Jun 21Jun 21 to Sep 21Sep 21 to Dec 21Through the year, Dec 20 to Dec 21Contribution to growth, Sep 21 to Dec 21
Food-1.7-1.5-0.75.3-2.30.6-0.3
Cigarettes and tobacco-5.1-1.4-1.0-1.0-3.0-6.3-0.1
Alcoholic beverages-0.9-3.9-1.38.0-2.00.4-
Clothing and footwear15.8-0.60.7-21.941.610.61.3
Rent and other dwelling services0.40.40.40.40.41.70.1
Electricity, gas and other fuel-8.0-4.010.2-0.9-1.43.5-
Furnishings and household equipment1.1-0.1-0.2-4.57.72.50.4
Health6.2-0.21.7-7.17.91.70.6
Purchase of vehicles32.2-2.87.3-8.8-2.5-7.2-0.1
Operation of vehicles12.71.42.0-12.913.92.70.6
Transport services27.911.924.3-44.548.614.60.3
Communications1.02.20.81.30.75.1-
Recreation and culture9.43.1-0.6-11.817.15.81.6
Education services1.00.40.50.60.62.0-
Hotels, cafes and restaurants16.814.42.4-20.724.315.51.3
Insurance and other financial services1.31.40.61.00.94.00.1
Other goods and services12.42.90.9-6.29.06.20.5
Total4.51.21.1-4.86.33.56.3

- nil or rounded to zero

Industry gross value added

Percentage changes

 Sep 20 to Dec 20Dec 20 to Mar 21Mar 21 to Jun 21Jun 21 to Sep 21Sep 21 to Dec 21Through the year, Dec 20 to Dec 21Contribution to growth, Sep 21 to Dec 21
Agriculture, Forestry and Fishing28.52.03.83.49.019.40.2
Mining-0.4-0.1-0.61.6-1.0-0.1-0.1
Manufacturing1.03.00.9-1.21.84.50.1
Electricity, Gas, Water and Waste Services0.2-0.71.7-0.1-1.0-0.1-
Construction0.24.61.8-1.01.97.40.1
Wholesale Trade3.73.20.8-5.53.51.80.1
Retail Trade3.5-1.00.8-3.47.43.50.3
Accommodation and Food Services7.45.52.7-25.526.11.70.4
Transport, Postal and Warehousing5.64.33.2-3.23.07.40.1
Information Media and Telecommunications5.5-1.21.51.13.44.80.1
Financial and Insurance Services-0.50.71.21.13.60.1
Rental, Hiring and Real Estate Services6.65.31.9-0.62.99.80.1
Professional, Scientific and Technical Services4.11.4-0.7-0.65.35.50.4
Administrative and Support Services8.82.25.7-1.75.111.60.2
Public Administration and Safety0.9-0.60.20.81.62.00.1
Education and Training0.20.30.30.40.41.4-
Health Care and Social Assistance3.01.02.4-2.15.87.10.4
Arts and Recreation Services7.85.00.6-6.68.26.70.1
Other Services8.45.91.7-13.615.47.40.2
Ownership of dwellings0.40.40.50.50.51.8-
Gross value added at basic prices2.81.51.1-1.33.24.53.0
Taxes less subsidies on products7.84.5-0.3-9.04.3-1.20.3
Statistical discrepancy (P). ..  ..  ..  ..  .. .0.2
Gross domestic product3.21.90.8-1.93.44.23.4

. . not applicable
- nil or rounded to zero
a. Excludes ownership of dwellings.

Revisions to percentage changes

 Sep 20 to Dec 20Dec 20 to Mar 21Mar 21 to Jun 21Jun 21 to Sep 21
Agriculture, Forestry and Fishing0.3-0.82.0
Mining0.2-0.10.3-0.1
Manufacturing-0.20.3--0.1
Electricity, Gas, Water and Waste Services-0.20.2-0.10.1
Construction-0.90.40.10.1
Wholesale Trade0.1-0.20.1-0.1
Retail Trade----
Accommodation and Food Services---0.9
Transport, Postal and Warehousing-0.20.1--
Information Media and Telecommunications----0.2
Financial and Insurance Services---0.1-0.1
Rental, Hiring and Real Estate Services---0.6
Professional, Scientific and Technical Services-0.30.1-0.3
Administrative and Support Services---0.4
Public Administration and Safety----
Education and Training----
Health Care and Social Assistance--0.5-
Arts and Recreation Services---0.9
Other Services----1.8
Ownership of dwellings----
Gross value added at basic prices-0.1-0.10.1
Taxes less subsidies on products0.20.1--0.1
Gross domestic product-0.10.10.1-

- nil or rounded to zero
a. Excludes ownership of dwellings.

Income from GDP

Seasonally adjusted current prices, percentage changes

 Sep 20 to Dec 20Dec 20 to Mar 21Mar 21 to Jun 21Jun 21 to Sep 21Sep 21 to Dec 21Through the year, Dec 20 to Dec 21Contribution to growth, Sep 21 to Dec 21
Compensation of employees
 Wages and salaries1.31.61.20.22.05.10.8
 Employers' social contributions (a)1.11.21.02.91.87.00.1
 Total compensation of employees1.31.51.20.52.05.30.9
Gross operating surplus
 Non-financial corporations
  Private non-financial corporations-8.4-2.46.74.80.49.60.1
  Public non-financial corporations9.9-2.58.8-3.7-2.7-0.5-
  Total non-financial corporations-7.7-2.46.84.50.39.20.1
 Financial corporations0.70.81.61.41.25.20.1
 Total corporations-6.4-1.85.93.90.48.50.1
 General government0.50.70.81.00.83.3-
 Dwellings owned by persons0.61.01.10.90.33.4-
 Total gross operating surplus-4.6-1.14.63.20.47.10.2
Gross mixed income-11.6-0.28.23.011.70.3
Total factor income-2.40.32.42.21.56.61.4
Taxes less subsidies on production and imports705.062.112.3-26.129.273.72.0
Statistical discrepancy (I). ..  ..  ..  ..  .. .-
Gross domestic product4.33.83.2-0.63.410.23.4

. . not applicable
- nil or rounded to zero
a. Includes contributions to superannuation made by employers and payments of workers' compensation premiums.

Revisions to percentage changes

 Sep 20 to Dec 20Dec 20 to Mar 21Mar 21 to Jun 21Jun 21 to Sep 21
Compensation of employees
 Wages and salaries-0.10.1--0.1
 Employers' social contributions (a)-0.10.1--
 Total compensation of employees-0.1---
Gross operating surplus
 Non-financial corporations
  Private non-financial corporations---0.1
  Public non-financial corporations-0.8-0.61.8-8.6
  Total non-financial corporations--0.1-0.2
 Financial corporations-0.20.1-0.10.1
 Total corporations-0.1-0.1-0.3
 General government----
 Dwellings owned by persons-0.1--0.10.1
 Total gross operating surplus----0.1
Gross mixed income-0.60.20.70.2
Total factor income-0.1---0.1
Taxes less subsidies on production and imports-3.4-0.30.21.5
Gross domestic product-0.20.1-0.1-

- nil or rounded to zero
a. Includes contributions to superannuation made by employers and payments of workers' compensation premiums.

State final demand

 Percentage change from Sep 21 to Dec 21
NSWVic.QldSAWATas.NTACTAust.(a)
Final consumption expenditure         
 General government-0.61.6-0.51.31.0-1.8-3.6-1.70.1
 Households11.47.52.01.41.50.5-0.28.46.3
Gross fixed capital formation         
 Private4.1-3.0-3.3-3.0-2.8-9.2-0.70.7-1.4
 Public0.1-0.5-6.1-4.8-4.12.7-5.70.9-2.0
State final demand6.73.70.00.30.1-1.5-1.81.92.9

- nil or rounded to zero (including null cells)
a. Australia estimates relate to Domestic final demand.

Related releases

Monthly Household Spending Indicator

The December 2021 issue of Monthly Household Spending Indicator was released on 22 February 2022. This publication provides an experimental monthly indicator of household spending using aggregated, de-identified banks transactions data. The indicator provides early insights into household consumption with approximately 68% coverage. 

Australian National Accounts: Finance and Wealth (cat. no. 5232.0)

The December quarter 2021 issue of Australian National Accounts: Finance and Wealth will be released on 31 March 2022. This publication provides quarterly estimates of the financial flows between sectors of the domestic economy and with the rest of the world. This publication also provides estimates of the financial assets and liabilities owned by each sector and various sub-sectors at the end of each quarter. Other key estimates within the publication include the demand for credit by non-financial domestic institutional sectors during the quarter, and their corresponding levels of credit outstanding.

Australian National Accounts: Input-Output Tables (cat. no. 5209.0.55.001)

The 2019-20 issue of Australian National Accounts: Input-Output Tables will be released on 27 May 2022. This product provides detailed information about the supply and use of products in the Australian economy and the structure of, and inter-relationships between, Australian industries. It presents information on input by industry and output by product group, use of domestic production, imports by industry and final demand categories, taxes and margins on supply by product, and industry and product concordances.

Australian National Accounts: Input-Output Tables (Product Details) (cat. no. 5215.0.55.001)

The 2019-20 issue of Australian National Accounts: Input-Output Tables (Product Details) will be released on 27 May 2022. It provides details regarding Australian production, imports, intermediate usage, final usage, exports, margins and taxes less subsidies on products and margins for each Input-Output product. There are over 900 Input-Output products classified to the industry from which each originates such as agriculture, manufacturing and construction.

Read more

Australian National Accounts: State Accounts (cat. no. 5220.0)

The 2020-21 issue of the Australian National Accounts: State Accounts was released on 19 November 2021. This publication provides detailed annual estimates of gross state product (GSP) for all states and territories. These are estimated using the expenditure, income and production approaches. Also published are estimates of household and agricultural incomes.

Australian National Accounts: Tourism Satellite Account, 2020-21 (cat. no. 5249.0)

The 2020-21 issue of Australian National Accounts: Tourism Satellite Account was released on 10 December 2021. This publication provides estimates of tourism's direct contribution to the economy including GDP, value added, employment and consumption by product and industry. It adopts the basic system of concepts, classifications, definitions, tables and aggregates of the System of National Accounts 2008 (2008 SNA), the international standard for a systematic summary of national economic activity, from a functional perspective.

Estimates of Industry Multifactor Productivity (cat. no. 5260.0.55.002)

The 2020-21 issue of Estimates of Industry Multifactor Productivity was released on 13 December 2021. It provides updated estimates of multifactor productivity (MFP) for the 16 industries defined to comprise the market sector. Longer time series are produced for 12 selected industries. Also included are productivity growth cycles for market sector industries and selected industries aggregates back to 1998-99 and 1973-74, respectively. The release includes experimental estimates of productivity growth cycles for individual industries, sources of aggregate labour productivity growth and its industry origin. Experimental estimates of state productivity back to 1994-95 are also provided.

Revisions and changes

Revisions in this issue

There are revisions in this issue due to the incorporation of more up-to-date data and concurrent seasonal adjustment. 

Suspension of trend estimates

Due to the impacts of COVID-19 on the economy, trend estimates for all series in the National Accounts have been suspended from June 2019 (inclusive). In the short term, this measurement will be significantly affected by changes to regular patterns in economic activity. If trend estimates were to be calculated without fully accounting for this unusual event, they would likely provide a misleading view of the underlying trend in the economy.

Extraordinary Annual Seasonal Review (EASR)

In the March quarter 2020 issue of Australian National Accounts: National Income, Expenditure and Product, the ABS advised that the method used to produce seasonally adjusted estimates would be changed from the ‘concurrent’ method to the ‘forward factors’ method for series with significant and prolonged impacts from COVID-19. 

Given the large changes in the Australian economy during the COVID-19 period and the continuing use of a forward factors approach to seasonal adjustment, the ABS has undertaken an extensive annual review of seasonally adjusted series. This review changed a range of time series treatments to ensure that the seasonal adjustment process continues to be less influenced by the large irregular movements over the past year. Revisions to most seasonally adjusted series are relatively minor, but larger than would be observed on a quarterly basis through the use of concurrent seasonal adjustment. 

For some series, the review has allowed a return to concurrent seasonal adjustment, where economic conditions are assessed to have returned to pre COVID-19 patterns. For the remaining series where this is not the case, forward factors have been calculated for the next 12 months through this annual process.

Data downloads

Changes to Excel file format on the ABS website

As advised last quarter, data downloads in this release have transitioned to .XLSX format. Previously released data has not changed.

Time series spreadsheets

Data files

Data cubes

Experimental food consumption estimates using scanner data

A datacube with experimental estimates of household final consumption expenditure on food compiled using supermarket scanner data has been included in this Data downloads section.

The ABS plans to replace existing estimates of food consumption with scanner data based estimates in September quarter 2022. If you have any questions or feedback about these changes, please contact National Accounts.

Experimental HFCE Food Estimates, current price and volume, COICOP Group, SUPC and IOPC, Original

Previous catalogue number

This release previously used catalogue number 5206.0.
 

Back to top of the page