Financing resources and investment table
Non-financial corps | Financial corps | Government | Households | Total national | Rest of world | |||
---|---|---|---|---|---|---|---|---|
Financing resources | ||||||||
Net saving (a) | 39.1 | 1.5 | 11.2 | -3.8 | 48.0 | -14.0 | ||
plus Consumption of fixed capital | 51.4 | 3.4 | 12.8 | 40.8 | 108.4 | - | ||
Gross saving | 90.4 | 4.9 | 24.0 | 37.0 | 156.4 | -14.0 | ||
plus Net capital transfers | 0.6 | 0.0 | -1.9 | 1.1 | -0.2 | 0.2 | ||
less Statistical discrepancy (b) | - | - | - | - | -13.5 | - | ||
Total financing resources | 91.1 | 4.9 | 22.1 | 38.1 | 169.7 | -13.8 | ||
Uses of financing (investment) | ||||||||
Capital formation | ||||||||
Gross fixed capital formation | 76.8 | 3.4 | 33.3 | 51.9 | 165.4 | - | ||
plus Changes in inventories | -7.7 | 0.0 | 0.4 | -2.1 | -9.4 | - | ||
plus Net acquisition of non-produced non-financial assets | -0.3 | - | 0.4 | - | - | - | ||
Total capital formation | 68.8 | 3.4 | 34.0 | 49.7 | 156.0 | - | ||
plus Financial investment | ||||||||
Acquisition of financial assets | 2.2 | -6.2 | 13.5 | 38.7 | -86.3 | -103.2 | ||
less Incurrence of financial liabilities | 0.5 | -15.8 | 12.1 | 34.6 | -103.2 | -86.3 | ||
Net Financial investment (Net lending (+) / net borrowing (-)) | 1.7 | 9.7 | 1.4 | 4.1 | 16.9 | -16.9 | ||
less Net errors and omissions | -20.5 | 8.2 | 13.3 | 15.7 | 3.2 | -3.2 | ||
Total investment | 91.1 | 4.9 | 22.1 | 38.1 | 169.7 | -13.7 |
- nil or rounded to zero
(a) Net saving for the rest of world is the balance on the external income account.
(b) The statistical discrepancy is not able to be distributed among the sectors.
Financial market summary table
Amounts outstanding, Mar-23 | Transactions, Jun-23 | Other changes, Jun-23 | Amounts outstanding, Jun-23 | ||
---|---|---|---|---|---|
Currency and deposits | |||||
Currency | 106.4 | -1.0 | - | 105.3 | |
Transferable deposits | 2,384.8 | -50.5 | 0.9 | 2,335.3 | |
Other deposits | 1,540.5 | 15.5 | 2.3 | 1,558.3 | |
Short term debt securities | |||||
Bills of exchange | 6.8 | -0.7 | - | 6.1 | |
One name paper | 540.1 | -7.9 | 0.2 | 532.4 | |
Long term debt securities | |||||
Bonds, etc. | 3,286.7 | 29.8 | -64.0 | 3,252.6 | |
Derivatives | |||||
Derivatives | 1,107.2 | -259.5 | 422.7 | 1,270.4 | |
Loans and placements | |||||
Short term | 442.9 | -13.8 | 0.2 | 429.3 | |
Long term | 4,676.8 | 61.5 | 6.2 | 4,744.6 | |
Shares and other equity | |||||
Listed | 2,558.6 | -7.0 | 7.5 | 2,559.1 | |
Unlisted | 5,925.4 | -13.9 | 62.9 | 5,974.4 | |
Insurance technical reserves | |||||
Reserves of pension funds and life | 3,224.8 | 30.5 | 32.1 | 3,287.3 | |
General insurance payments | 156.9 | 2.2 | 0.0 | 159.0 |
- nil or rounded to zero
Flow of funds diagrams
Image
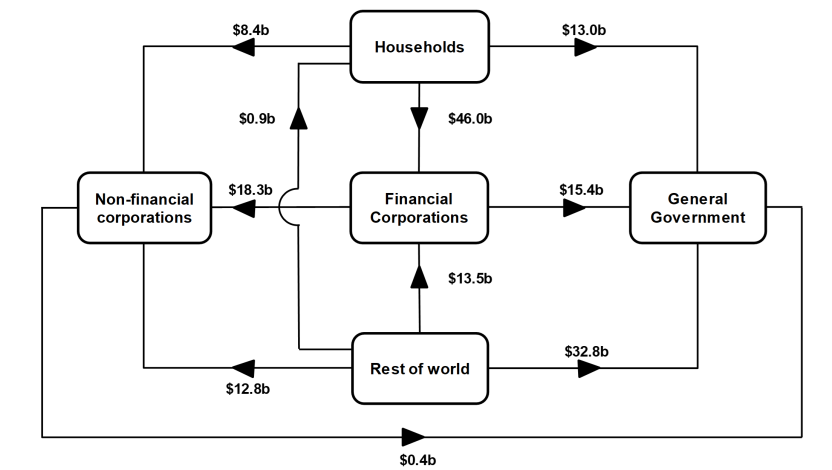
Net transactions during June quarter 2023

Description
Net transactions during June quarter 2023
Financial corporations borrowed $24.0b from general government and $4.4b from rest of the world. They lent $15.9b to households and $14.5b to non-financial corporations.
Rest of the world borrowed $7.6b from general government. They lent $3.1b to non-financial corporations and $0.3b to households.
General government borrowed $4.4b from households and $22.0m from non-financial corporations.
Households lent $4.4b to non-financial corporations.
Image
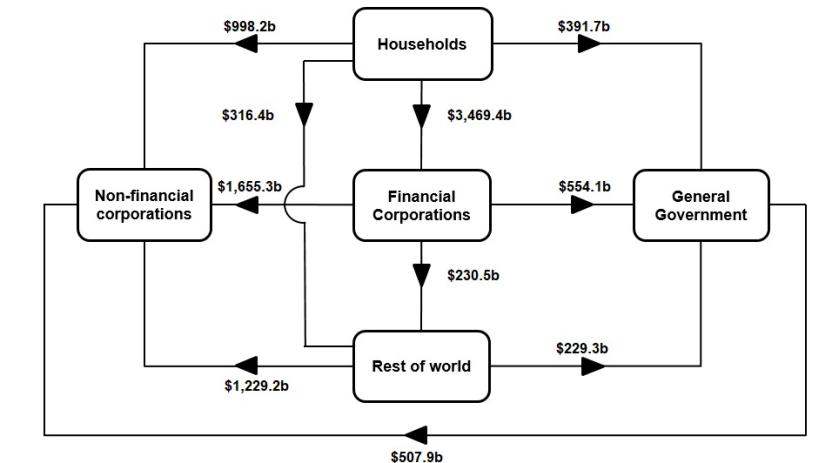
Amounts outstanding at end of June quarter 2023

Description
Amounts outstanding at end of June quarter 2023
Net claims on non-financial corporations were $1,329.9b from financial corporations, $869.8b from households, $1,135.1b from rest of world and $427.2b from general government.
Net claims on general government were $405.2b from financial corporations, $221.4b from rest of world and $391.2b from households.
Net claims on rest of world were $171.4b from financial corporations and $193.0b from households.
Net claims on financial corporations were $2,483.4b from households.
National investment
National investment increased $19.8b to $156.0b in the June quarter
- General government investment increased by $11.4b to $34.0b driven by increases in gross fixed capital formation for both state and local general government and national general government.
- Non-financial corporations' investment increased by $4.3b to $68.8b, driven by increases in gross fixed capital formation for both private non-financial and public non-financial corporations.
- Household investment increased $3.6b to $49.7b, driven by an increase in total gross fixed capital formation.
Financial investment
Australia was a net lender of $16.9b to rest of world (ROW). The main contributors were a:
- $21.9b disposal of equity issued by Australia by ROW
- $19.1b withdrawal of deposits by ROW
- $9.2b acquisition of debt securities issued by ROW by Australia
- Partly offset by $19.2b disposal of ROW equity by Australia; and
- $7.0b acquisition of bonds by ROW, driven mainly by those issued by banks and other private non-financial corporations
An increase in dividends remitted overseas and falling commodity prices resulted in ROW reinvesting lower amounts of profit in foreign owned resource companies. Reductions in deposits reflected funding and liquidity management by Authorised deposit taking institutions and offshore related parties. ROW acquired bonds issued by banks as banks sought additional funding as the Term Funding Facility (TFF) started to mature. Pension funds favoured investment in overseas bonds.
Households
Households $4.1b net lending position was due to a $38.7b acquisition of financial assets, offset by $34.6b incurrence of liabilities. The acquisition of assets was driven by:
- $36.5b in net equity in superannuation
- partly offset by $6.1b withdrawal of deposit assets
While liabilities were driven by:
- $37.8b in loan borrowings
Increased contributions into pension funds reflected additional contributions made by households prior to the end of the financial year. The household sector drew down on deposit assets for the first time since June quarter 2007. The withdrawal of deposits reflected a fall in the household savings ratio as households face high cost of living pressures. Loan borrowing by households reflected renewed activity in the housing market.
General government
General government’s $1.4b net lending position was due to a $13.5b acquisition of financial assets, offset by $12.1b incurrence of liabilities.
The acquisition of assets was driven by:
- $14.3b in deposits
- $6.0b in short-term debt securities
Liabilities were driven by:
- $9.9b in loans
- offset by $11.3b in bond maturities
The national general government built up deposits this quarter as tax receipts remain elevated. The national general government also experienced its largest net maturity of bond liabilities. State and territory governments continued to borrow funds from their respective central borrowing authorities to fund investment into transport and health infrastructure.