The 2020 annual re-weight of the Australian Consumer Price Index

This information paper details the 2020 weight update for the Consumer Price Index and Selected Living Cost Indexes.

Released
16/12/2020

Preface

This information paper presents the 2020 annual re-weight of the Consumer Price Index (CPI) and Selected Living Cost Indexes (SLCIs). The 2020 re-weight will apply from the December 2020 quarter for the CPI, which will be released on 27 January 2021. The SLCIs will be released on 3 February 2021.

The ABS has annually re-weighted the CPI since 2018, predominantly using Household Final Consumption Expenditure (HFCE) data, which is lagged by 18 months. Annually re-weighting the CPI ensures that the CPI basket continues to be representative of spending by Australian households. Further details on annually re-weighting the CPI can be found in the information paper An Implementation Plan to Annually Re-weight the Australian CPI, 2017.

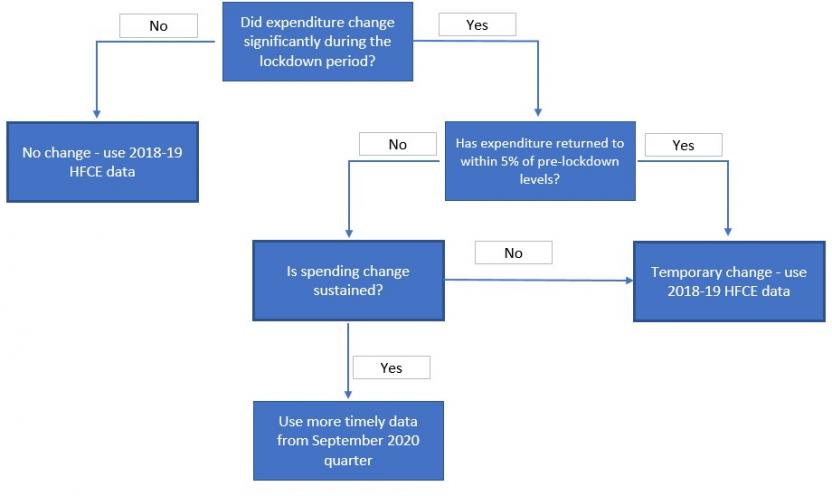
Normally household spending patterns change slowly. The COVID-19 pandemic has caused a sudden, and in some cases, sustained change in household spending patterns. To reflect this, the 2020 annual re-weight uses a range of more timely data sources (e.g. Retail Trade data and scanner data) for approximately 20 per cent of the weight of the CPI.  This ensures that the underlying weighting patterns for the CPI continue to be reflective of spending by Australian households. To guide the re-weight decision-making process, the ABS developed a framework, which has been used to guide the use of more timely data sources.

For 80 per cent of the CPI, the updated weights were derived in the usual way outlined by the 2017 information paper. For the 20 per cent of the CPI where more timely data sources were used, it was for CPI components such as food, alcohol, electricity and domestic and international travel – for more details see appendix 1.

The ABS will continue to monitor expenditure throughout 2021 to ensure that the CPI weights are reflective of spending patterns by Australian households.

This information paper provides an overview of the changes to the CPI and SLCIs that will be introduced with the 2020 re-weight and presents the updated weighting patterns.

For further information contact
prices.statistics@abs.gov.au

Background

Since the introduction of the CPI in 1960, the ABS has periodically reviewed the CPI to ensure that it continues to meet community needs. Traditionally, these reviews have coincided with the release of the ABS’s Household Expenditure Survey (HES), which is conducted every six years. In 2018, the ABS moved to annually re-weighting the CPI using Household Final Consumption Expenditure (HFCE) data to update the CPI expenditure weights. Further details are available in the information paper Increasing the Frequency of CPI Expenditure Class Weight Updates.

HFCE data is a high-quality source to update the CPI weights. It is simple to align to both the CPI concepts and the components measured in the CPI. HFCE data is available for use with a lag of 18 months after the period the data represents. In the case of the 2020 re-weight, HFCE data is available for the 2018-19 financial year.

Typically, changes in consumer spending patterns occurs gradually (see figure 1). Therefore, the 18-month lag is a reasonable amount of time to accurately reflect contemporary spending by Australian households.

However, in 2020 Australian households responded to the COVID-19 lockdowns, business restrictions and social distancing, with significant changes in their spending across a range of goods and services. Figure 2 shows the sudden and significant change in retail trade activity following the outbreak of the pandemic.

To ensure an accurate measure of inflation, the CPI expenditure weights need to capture recent changes in spending by Australian households. In response, the ABS has made use of more timely data to supplement the 2018-19 HFCE data.

Spending components impacted by COVID-19

Figure 2 shows how consumer spending patterns for a range of goods and services changed significantly in response to the COVID-19 pandemic. In some cases, expenditure returned to pre-COVID levels. For example, clothing expenditure was considerably lower in mid-2020, but has since returned to pre-COVID levels. In other cases, the change in expenditure has been sustained and spending remains significantly above or below 2019 levels, such as spending at cafes and restaurants.

The sustained change in spending is underpinned by a number of real-world changes brought about by COVID-19, for example:

  • Increased working from home;
  • Domestic and international travel restrictions;
  • Social distancing requirements; and
  • Changed economic landscape e.g. higher unemployment

The ABS has developed a framework to guide decision making of when it’s appropriate to use more timely data to update the weight.

Figure 3: CPI data source decision-making framework

CPI data source decision-making framework

The ABS adopted this framework to guide decisions on the most appropriate data source to re-weight each component of the CPI. The framework was used for the following scenarios:

  1. If spending returned close to pre-COVID levels, 2018-19 HFCE data would continue to be used.
  2. If spending hadn’t returned close to pre-COVID levels, a determination was made using more timely data as to whether the change in spending was temporary or permanent.

Where the change in spending was temporary, 2018-19 HFCE data has been used. Where the change in spending was more permanent, data available from the September 2020 quarter has been used.

The outcome from the use of this framework are weights which reflect contemporary spending patterns and ensures that the CPI remains an accurate measure of inflation.

Case study – international holiday travel

The weights used in the CPI represent annual consumer spending. In 2020, the largest change in weight was for international holiday travel, following the closure of Australia’s borders. For the 2019 re-weight, international holiday travel had a weight of 3.38%, which represented about $18.7 billion in spending by Australian households. Following the 2020 re-weight, the updated weight is 0.08%, representing about $0.4 billion of spending.

If 2018-19 HFCE data was used to update the weight for international travel, its weight in the CPI would have been 3.43%, representing $19.8 billion of spending in 2021. With Australia’s borders remaining closed, this would have led to international travel having too high a weight in the CPI and the CPI basket being unrepresentative of spending by Australian households.

Table 1: International holiday travel weights under different approaches
ApproachCPI weight (%)Approximate spending
2019 re-weight3.38$18.7 billion
2020 re-weight0.08$0.4 billion
2018-19 HFCE data3.43$19.8 billion

Future changes to household spending patterns

With the uncertainty around the future impacts of COVID-19, the ABS will continue to monitor the spending patterns of Australian households throughout 2021. As part of the 2020 re-weight, the ABS investigated a range of possible scenarios for spending patterns and developed a set of CPI weights for each scenario. Appendix 2 lists the re-weight approach used for each scenario.

Should spending patterns unexpectedly and significantly change, the ABS is well positioned to respond. Where possible the ABS will consult extensively with users and announce any response prior to their implementation.

Description of data sources and methods

Data sources

Every six years, the Household Expenditure Survey (HES) is used to provide information on the expenditure weights of Australian households.  In 2018, the ABS moved to annually re-weighting the CPI using National Accounts Household Final Consumption Expenditure (HFCE) data in the intervening HES years. HES expenditure data is next available in 2023.

The main data source for the 2020 CPI and SLCI weight update is 2018-19 HFCE data. Conceptually, the measurement of HFCE closely aligns with the HES. HFCE data captures household expenditure by Australian households only and excludes expenditure by non-residents in Australia.

While HFCE is the main data source for updating the CPI weights for the inter-HES years, weights for some of the components of the CPI and SLCIs are derived from alternative data sources. These components are:

  • New dwelling purchase by owner-occupiers;
  • Other financial services; and
  • Mortgage interest charges (only included in the SLCIs).
     

For more information on the data sources used for these components see the information papers: Introduction of the 17th Series Australian Consumer Price Index and An Update on the Annual Re-weighting of the Australian CPI and Living Cost Indexes.

Data sources for COVID-19 impacted expenditures

For CPI components where expenditure has returned to within five per cent of the pre-COVID level, the weights have been updated using the normal re-weight approach of 2018-19 HFCE data. This represents approximately 80 per cent of the CPI by weight.

For CPI components where the change in expenditure is more sustained and not within five per cent of pre-COVID levels, more up-to-date data sources have been used. This approach represents approximately 20 per cent of the CPI by weight.

The main data sources used to provide up-to-date expenditure information for those CPI components were:

  • September 2020 quarter HFCE data;
  • Quarterly Business Indicator Survey; and
  • Supermarket scanner data.

A full list of data sources for each CPI expenditure class is provided in appendix 1.

Annual method for re-weighting the CPI

The use of HFCE data for CPI weights has many benefits for inflation statistics. The primary benefit is that more up-to-date weights enhance the CPI in its principal purpose as a macro-economic indicator of household inflation. However, there are challenges with using HFCE data for CPI weighting purposes. These challenges were investigated by the ABS and detailed in the information paper Increasing the Frequency of CPI Expenditure Class Weight Updates.

For the 2020 update, movements in the HFCE data for the years 2017-2018 to 2018-2019 were used. The approach for the 2020 update to re-weight the CPI and SLCIs can be summarised as follows:

  1. Align the HFCE data with the scope and classifications of the CPI and SLCIs at a detailed product level. This requires the removal of some components of HFCE (e.g. expenditure by Non-Profit Institutions Serving Households (NPISH)).
  2. Produce a concordance of the HFCE data to the Consumer Price Index Commodity Classification (CPICC). This provides HFCE data for each CPI expenditure class (EC) for the CPI and SLCIs. These first two steps result in HFCE data aligned to the same concepts and scope of the CPI and SLCIs.
  3. Calculate movements from 2017-18 to 2018-19 for the HFCE data from step 2, and apply these movements to each CPI EC to update the expenditure values.
  4. Price update the 2018-19 expenditure values for each CPI EC to the September 2020 quarter.
  5. Re-scale the price updated expenditure values across all CPI ECs so they sum to 100 (i.e. expenditure shares).

For CPI components that have had a sustained change in spending pattern and   have not returned to within five per cent of their pre-COVID expenditure, more up-to-date data sources were used and additional steps taken:

  1. Align the data source with CPI and SLCIs at the lowest possible level and produce a concordance with the CPICC.
  2. Calculate a movement from 2017-18 up to the September 2020 quarter.
  3. Re-scale the price updated expenditure values across all CPI ECs so they sum to 100 (i.e. expenditure shares). This is done in conjunction with ECs updated with annual HFCE data.

Expenditure weights update, 2020

The CPI and SLCI weights reflect the relative expenditures of the CPI population group and SLCI population subgroups as a whole. The weights reflect average expenditure of households and not the expenditure of an 'average household'. The CPI weights for the CPI groups are shown in figure 4.

  1. Any discrepancies between totals and sums of components in this table are due to rounding.
  2. The weight for international holiday travel is included in the Recreation and culture group.

Analysis of changes in weights

One thing to note when comparing the weights between 2019 and 2020 is that the weights are relative. The weight of a component of the CPI depends on how expenditure on that component compares to total expenditure (i.e. expenditure shares), rather than the absolute change in expenditure.

For example, if the increase in expenditure for a particular EC is greater than the increase in total expenditure (in percentage terms), the weight for that EC will increase. Conversely, if the increase in expenditure for a particular EC is less than the increase in total expenditure, the weight for that EC will decrease.

This is particularly notable for the 2020 re-weight due to the large fall in the expenditure share for the Recreation and culture group driven by international holiday travel.

For the CPI, households spend the most on Housing (24.05%), followed by Food and non-alcoholic beverages (17.35%) and Transport (10.19%).

Changes in the CPI weights are discussed in more detail below. All analysis refers to the weighted average of the eight capital cities.

Recreation and culture

The Recreation and culture group recorded a significant fall of 4.08 percentage points (pp) to 8.73%, dropping from the third to sixth largest expenditure group in the CPI. The main contributor to this fall was international holiday travel, falling 3.30pp to 0.08%.

International borders remain closed for all holiday travellers in an attempt to reduce the spread of COVID-19. According to ABS Overseas Arrivals and Departures data, overseas arrivals in 2020 were down 99.5% compared to 2019.

Domestic holiday travel and accommodation Expenditure also fell 0.87pp to 2.08%. Domestic travel has made a partial recovery since State and Territory borders re-opened, however interstate travel was still lower than pre-COVID levels reflected in lower levels of domestic airline travel.

Food and non-alcoholic beverages

The weight for the Food and non-alcoholic beverage group rose by 1.60pp to 17.35%.

After lockdown restrictions in March 2020, some social and personal habits changed with restaurant closures forcing consumers to prepare more meals at home. Working from home arrangements remain prevalent, which has maintained elevated levels of grocery spending. This can be seen in  increased spending on food in the Retail Trade data presented in figure 2 of this paper.

To reflect the changes in expenditures for grocery expenditure, weekly supermarket scanner data was used to update the weight.

Alcohol and tobacco

The Alcohol and tobacco group rose 1.20pp to 8.91%. The main contributor to the increase was tobacco, which increased 0.43pp to 3.60%. The continued rise in the tobacco excise tax rate resulted in higher prices and subsequently a higher expenditure share.

Alcohol expenditure rose across all alcohol types, with elevated spending on takeaway alcohol driving the increase. Social distancing restrictions saw a shift in alcohol consumption to takeaway alcohol, which more than offset the fall in alcohol consumed in bars and restaurants. As restrictions eased expenditure on takeaway alcohol remained at elevated levels even while expenditure on drinking in venues returned to pre-COVID levels.

Housing

The Housing group remained the largest component of household spending, with a weight of 24.05%, increasing by 1.12pp.

The New dwelling purchases by owner-occupiers EC remains the largest component of housing costs and was still the most heavily weighted EC in the CPI. This EC increased by 0.65pp to 8.49% as dwelling prices recovered and construction activity remained buoyant. 

Rents was the only component to fall in weight in the Housing group, down by 0.04pp to 6.80%. In recent times there has been low inflation in rents and even falls in rents in some cities as vacancy rates rose and population growth slowed in response to the pandemic.

Electricity rose by 0.17pp to 2.80% as an increase in the number of people working and entertaining at home drove higher usage of residential electricity.

Furnishings, household equipment and services

The weight for the Furnishings, household equipment and services group rose 0.20pp to 8.76%. Most components rose modestly using the 2018-19 HFCE data. Expenditure in these categories remains elevated (see Retail Trade data) but are declining to pre-COVID levels as backorders are completed.

Child care was the main offsetting fall, falling 0.23pp to 0.94%. This fall was driven by price impacts from the return from free childcare offered during 2020.

Transport

The weight for the Transport group fell 0.49pp to 10.19%. The main driver was automotive fuel, which recorded a decrease in weight of 0.41pp to 3.16%. Heavily reduced global demand due to the pandemic, as well as high supply from oil producing nations led to strong falls in the fuel price.

Urban transport also fell 0.21pp to 0.48%, reflecting the strong decline in public transport usage during the peak lockdown period, which was slowly recovering.

Appendix 1

Data sources

Data sourceWeight reference periodNo. of ECs (a)
Household Final Consumption Expenditure (HFCE) 2018-192018-19 Financial Year52
Supermarket Scanner DataSeptember 2020 quarter23
Household Final Consumption Expenditure (HFCE) September 2020 quarterSeptember 2020 quarter8
Government Finance Statistics (GFS)2018-19 Financial Year2
Building And Construction Survey (BACS)2018-19 Financial Year1
Gross Fixed Capital Formation (GFCF)2018-19 Financial Year1
Quarterly Business Indicators Survey (QBIS)September 2020 quarter1

a. Other Financial Services uses both HFCE and GFCF data so this total adds to 88 ECs rather than 87

Expenditure class

Expenditure classData source for 2020 re-weightWeight reference periodReason
BreadSupermarket scanner dataSeptember 2020 quarter

Consistent and elevated expenditure seen across all grocery products due to increased time spent at home such as working from home arrangements, reduced work hours and fewer social gatherings. This has led to more meals being prepared at home.

Quarterly HFCE and monthly Retail Trade data support the increased level of expenditure.

Cakes and biscuitsSupermarket scanner dataSeptember 2020 quarter
Breakfast cerealsSupermarket scanner dataSeptember 2020 quarter
Other cereal productsSupermarket scanner dataSeptember 2020 quarter
Beef and vealSupermarket scanner dataSeptember 2020 quarter
PorkSupermarket scanner dataSeptember 2020 quarter
Lamb and goatSupermarket scanner dataSeptember 2020 quarter
PoultrySupermarket scanner dataSeptember 2020 quarter
Other meatsSupermarket scanner dataSeptember 2020 quarter
Fish and other seafoodSupermarket scanner dataSeptember 2020 quarter
MilkSupermarket scanner dataSeptember 2020 quarter
CheeseSupermarket scanner dataSeptember 2020 quarter
Ice cream & other dairy prodSupermarket scanner dataSeptember 2020 quarter
FruitSupermarket scanner dataSeptember 2020 quarter
VegetablesSupermarket scanner dataSeptember 2020 quarter
EggsSupermarket scanner dataSeptember 2020 quarter
Jams, honey and spreadsSupermarket scanner dataSeptember 2020 quarter
Food additives & condimentsSupermarket scanner dataSeptember 2020 quarter
Oils and fatsSupermarket scanner dataSeptember 2020 quarter
Snacks and confectionerySupermarket scanner dataSeptember 2020 quarter
Other food products n.e.c.Supermarket scanner dataSeptember 2020 quarter
Coffee, tea and cocoaSupermarket scanner dataSeptember 2020 quarter
Waters soft drinks & juicesSupermarket scanner dataSeptember 2020 quarter
Restaurant meals2018-19 HFCE2018-19 Financial Year 
Takeaway and fast foods2018-19 HFCE2018-19 Financial Year 
SpiritsQuarterly HFCESeptember 2020 quarter

Strong elevated expenditure for takeaway alcohol as consumers shifted away from on-premises consumption to takeaway alcohol due to the closure of many drinking venues during the lockdown.

Following the removal of the lockdowns, expenditure for takeaway alcohol remained elevated while expenditure returned for alcohol consumed on premises.

WineQuarterly HFCESeptember 2020 quarter
BeerQuarterly HFCESeptember 2020 quarter
Tobacco2018-19 HFCE2018-19 Financial Year 
Garments for men2018-19 HFCE2018-19 Financial Year 
Garments for women2018-19 HFCE2018-19 Financial Year 
Garments for infant & child2018-19 HFCE2018-19 Financial Year 
Footwear for men2018-19 HFCE2018-19 Financial Year 
Footwear for women2018-19 HFCE2018-19 Financial Year 
Footwear for infant & child2018-19 HFCE2018-19 Financial Year 
Accessories2018-19 HFCE2018-19 Financial Year 
Cleaning, repair & hire2018-19 HFCE2018-19 Financial Year 
Rents2018-19 HFCE2018-19 Financial Year 
New dwelling purchaseBACS2018-19 Financial YearNormal alternative data source
Maintenance & repair of dwelling2018-19 HFCE2018-19 Financial Year 
Property rates and chargesGFS2018-19 Financial YearNormal alternative data source
Water and sewerage2018-19 HFCE2018-19 Financial Year 
ElectricityQBIS SQ20 dataSeptember 2020 quarter

Sustained higher levels of expenditure seen in the QBIS data due to increased working from home arrangements and time spent at home post the lockdown restrictions.

This is also supported by quarterly HFCE data.

Gas and other household fuels2018-19 HFCE2018-19 Financial Year 
Furniture2018-19 HFCE2018-19 Financial Year 
Carpets & other floor cover2018-19 HFCE2018-19 Financial Year 
Household textiles2018-19 HFCE2018-19 Financial Year 
Major household appliances2018-19 HFCE2018-19 Financial Year 
Small electrical household appliances2018-19 HFCE2018-19 Financial Year 
Glassware & tableware2018-19 HFCE2018-19 Financial Year 
Tools & equipment2018-19 HFCE2018-19 Financial Year 
Cleaning & maintenance prod2018-19 HFCE2018-19 Financial Year 
Personal care products2018-19 HFCE2018-19 Financial Year 
Other non-durable household prods2018-19 HFCE2018-19 Financial Year 
Child care2018-19 HFCE2018-19 Financial Year 
Hairdressing & personal grooming service2018-19 HFCE2018-19 Financial Year 
Other household services2018-19 HFCE2018-19 Financial Year 
Pharmaceutical products2018-19 HFCE2018-19 Financial Year 
Therapeutic app & equip2018-19 HFCE2018-19 Financial Year 
Medical & hospital services2018-19 HFCE2018-19 Financial Year 
Dental services2018-19 HFCE2018-19 Financial Year 
Motor vehicles2018-19 HFCE2018-19 Financial Year 
Spare parts & accessories2018-19 HFCE2018-19 Financial Year 
Automotive fuel2018-19 HFCE2018-19 Financial Year 
Maintenance & repair of vehicle2018-19 HFCE2018-19 Financial Year 
Other services in respect of motor vehiclesGFS2018-19 Financial YearNormal alternative data source
Urban transport faresQuarterly HFCESeptember 2020 quarter

Strong fall in expenditure on public transport seen in the quarterly HFCE data due to commuters choosing to avoid confined spaces by driving or working from home.

Google mobility data and patronage numbers from State governments support the decrease.
Postal servicesQuarterly HFCESeptember 2020 quarter

Elevated and sustained expenditure was seen for online shopping due to bricks and mortar shops being forced to close during the lockdown, causing consumers to shift to online purchases. This behaviour remained after the lockdown period as consumers became used to shopping online.

Online Retail Trade data and Australia Post data support the elevated expenditure.
Telecom equip & services2018-19 HFCE2018-19 Financial Year 
Audio, visual & computing equip2018-19 HFCE2018-19 Financial Year 
Audio, visual & media services2018-19 HFCE2018-19 Financial Year 
Books2018-19 HFCE2018-19 Financial Year 
Newspaper magazine &station2018-19 HFCE2018-19 Financial Year 
Domestic holiday travel & accommodationQuarterly HFCESeptember 2020 quarterSignificant falls seen in expenditure for both domestic and international travel due to travel restrictions and less airline travel for domestic holidays.
Intern holiday travel & accommodationQuarterly HFCESeptember 2020 quarter
Equipment for sports & camping2018-19 HFCE2018-19 Financial Year 
Games, toys and hobbies2018-19 HFCE2018-19 Financial Year 
Pets and related products2018-19 HFCE2018-19 Financial Year 
Vet & other pet services2018-19 HFCE2018-19 Financial Year 
Sports participation2018-19 HFCE2018-19 Financial Year 
Other recreational, sports & cultural servicesQuarterly HFCESeptember 2020 quarter

Strong fall in expenditure during the lockdown due to cancellations and lower capacity. As lockdown restrictions have eased expenditure on these services have gradually returned and is still well down on 2019 levels.

This is supported by monthly Retail Trade data.
Preschool & primary education2018-19 HFCE2018-19 Financial Year 
Secondary education2018-19 HFCE2018-19 Financial Year 
Tertiary education2018-19 HFCE2018-19 Financial Year 
Insurance2018-19 HFCE2018-19 Financial Year 
D&L Facilities (direct)2018-19 HFCE2018-19 Financial Year 
Other financial servicesTaxation revenue GFCG + 2018-19 HFCE2018-19 Financial YearNormal alternative data source

Appendix 2

CPI re-weight scenarios

The following scenarios were investigated by the ABS.

Re-weight approachDescription
Actual weighting pattern - continued moderate COVID impactDeveloped and used a framework to include more timely data sources where lagged HFCE data would not have been appropriate
Return to normal – no COVID impactUsed normal re-weight methods, primarily using the 2018-19 HFCE data
Further lockdowns – major COVID impactRelied predominantly on June 2020 quarter HFCE data to represent expenditure patterns during national lockdown
September 2020 quarter onlyRelies predominantly on September 2020 quarter HFCE data to represent expenditure patterns if the current COVID impact was maintained for all ECs
Moderate COVID impact + forward lookingUsed timely data sources based on the developed framework and adjusted expenditure in some cases to account for expected expenditure during 2021 (eg international travel)
Moderate COVID impact + exclude Melbourne data for timely sourcesUsed timely data sources based on the developed framework and removed Melbourne data where possible to adjust for the fact that September 2020 quarter involved a lockdown in Melbourne.

Appendix 3

Comparison between the 2019 and 2020 CPI weights, weighted average of eight capital cities (a)

Group2020 weights2019 weights
 Sub-groupPercentage contribution to the All groups CPI in September quarter 2020Percentage contribution to the All groups CPI in September quarter 2019
  Expenditure class%%
Food and non–alcoholic beverages17.35  15.75  
 Bread and cereal products 1.55  1.45 
  Bread  0.57  0.54
  Cakes and biscuits  0.66  0.62
  Breakfast cereals  0.13  0.13
  Other cereal products  0.19  0.16
 Meat and seafoods 2.54  2.23 
  Beef and veal  0.53  0.48
  Pork  0.34  0.29
  Lamb and goat  0.31  0.26
  Poultry  0.48  0.44
  Other meats  0.42  0.37
  Fish and other seafood  0.46  0.39
 Dairy and related products 1.10  0.99 
  Milk  0.42  0.37
  Cheese  0.34  0.29
  Ice cream and other dairy products  0.34  0.33
 Fruit and vegetables 2.48  2.14 
  Fruit  1.10  0.98
  Vegetables  1.38  1.16
 Food products n.e.c. 2.28  2.01 
  Eggs  0.14  0.12
  Jams, honey and spreads  0.14  0.12
  Food additives and condiments  0.32  0.26
  Oils and fats  0.21  0.18
  Snacks and confectionery  0.90  0.83
  Other food products n.e.c.  0.57  0.50
 Non-alcoholic beverages 1.10  0.96 
  Coffee, tea and cocoa  0.26  0.21
  Waters, soft drinks and juices  0.84  0.75
 Meals out and take away foods 6.30  5.97 
  Restaurant meals  3.47  3.30
  Take away and fast foods  2.83  2.67
Alcohol and tobacco8.91  7.71  
 Alcoholic beverages 5.31  4.54 
  Spirits  1.00  0.85
  Wine  2.01  1.72
  Beer  2.30  1.97
 Tobacco 3.60  3.17 
  Tobacco  3.60  3.17
Clothing and footwear3.34  3.23  
 Garments 2.06  1.98 
  Garments for men  0.56  0.54
  Garments for women  1.17  1.12
  Garments for infants and children  0.33  0.32
 Footwear 0.49  0.47 
  Footwear for men  0.12  0.12
  Footwear for women  0.30  0.28
  Footwear for infants and children  0.07  0.07
 Accessories and clothing services 0.79  0.78 
  Accessories  0.68  0.66
  Cleaning, repair and hire of clothing and footwear  0.11  0.12
Housing24.05  22.93  
 Rents 6.80  6.84 
  Rents  6.80  6.84
 New dwelling purchase by owner-occupiers 8.49  7.84 
  New dwelling purchase by owner-occupiers  8.49  7.84
 Other housing 3.96  3.62 
  Maintenance and repair of the dwelling  2.33  2.08
  Property rates and charges  1.63  1.54
 Utilities 4.80  4.63 
  Water and sewerage  1.03  1.03
  Electricity  2.80  2.63
  Gas and other household fuels  0.97  0.97
Furnishings, household equipment and services8.76  8.56  
 Furniture and furnishings 1.68  1.59 
  Furniture  1.38  1.30
  Carpets and other floor coverings  0.30  0.29
 Household textiles 0.45  0.41 
  Household textiles  0.45  0.41
 Household appliances, utensils and tools 1.50  1.40 
  Major household appliances  0.41  0.38
  Small electric household appliances  0.31  0.29
  Glassware, tableware and household utensils  0.40  0.38
  Tools and equipment for house and garden  0.38  0.35
 Non-durable household products 2.46  2.37 
  Cleaning and maintenance products  0.24  0.23
  Personal care products  0.92  0.93
  Other non-durable household products  1.30  1.21
 Domestic and household services 2.67  2.79 
  Child care  0.94  1.17
  Hairdressing and personal grooming services  1.00  0.91
  Other household services  0.73  0.71
Health6.3  5.88  
 Medical products, appliances and equipment 1.26  1.16 
  Pharmaceutical products  1.10  1.01
  Therapeutic appliances and equipment  0.16  0.15
 Medical, dental and hospital services 5.04  4.72 
  Medical and hospital services  4.44  4.16
  Dental services  0.60  0.56
Transport10.19  10.68  
 Private motoring 9.71  9.99 
  Motor vehicles  2.45  2.46
  Spare parts and accessories for motor vehicles  0.76  0.73
  Automotive fuel  3.16  3.57
  Maintenance and repair of motor vehicles  1.91  1.82
  Other services in respect of motor vehicles  1.43  1.41
 Urban transport fares 0.48  0.69 
  Urban transport fares  0.48  0.69
Communication2.50  2.41  
 Communication 2.50  2.41 
  Postal services  0.11  0.09
  Telecommunication equipment and services  2.39  2.32
Recreation and culture8.73  12.81  
 Audio, visual and computing equipment and services 1.90  1.76 
  Audio, visual and computing equipment  1.25  1.08
  Audio, visual and computing media and services  0.65  0.68
 Newspapers, books and stationery 0.63  0.63 
  Books  0.20  0.20
  Newspapers, magazines and stationery  0.43  0.43
 Holiday travel and accommodation 2.16  6.33 
  Domestic holiday travel and accommodation  2.08  2.95
  International holiday travel and accommodation  0.08  3.38
 Other recreation, sport and culture 4.04  4.09 
  Equipment for sports, camping and open-air recreation  0.59  0.57
  Games, toys and hobbies  0.65  0.67
  Pets and related products  0.49  0.44
  Veterinary and other services for pets  0.41  0.39
  Sports participation  0.99  0.95
  Other recreational, sporting and cultural services  0.91  1.07
Education4.71  4.44  
 Education 4.71  4.44 
  Preschool and primary education  0.99  0.98
  Secondary education  2.04  1.86
  Tertiary education  1.68  1.60
Insurance and financial services5.13  5.59  
 Insurance 1.24  1.24 
  Insurance  1.24  1.24
 Financial services 3.89  4.35 
  Deposit and loan facilities (direct charges)  0.47  0.51
  Other financial services  3.42  3.84
         
All groups100100100100100100

a. Any discrepancies between totals and sums of components in this Appendix are due to rounding.

Abbreviations

Show all

 
ABSAustralian Bureau of Statistics
ALCIAnalytical Living Cost Index
COICOPClassification of Individual Consumption According to Purpose
CPIConsumer Price Index
CPICCConsumer Price Index Commodity Classification
ECExpenditure Class
FHOGFirst Home Owners' Grants
HESHousehold Expenditure Survey
HFCEHousehold Final Consumption Expenditure
n.e.c.not elsewhere classified
PBLCIPensioner and Beneficiary Living Cost Index
PPPercentage Point
SLCISelected Living Cost Index

Data downloads

Data files
Back to top of the page