Cell counts, mesh blocks, sorting, totals and other table options
Cell counts, sorting, totals, labels, codes , zero suppression, displaying percentages and RSEs
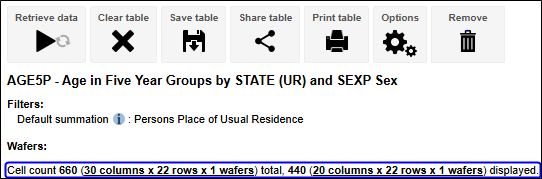
Cell count
To see how large your table is, check the cell count above the table. This shows the number of rows, columns and wafers for all cells (total) and displayed cells. The displayed cell count may differ from the total cell count if row or column totals are not displayed. The largest table (including totals and wafers) that can be built in TableBuilder is 40 million cells.
Using mesh blocks
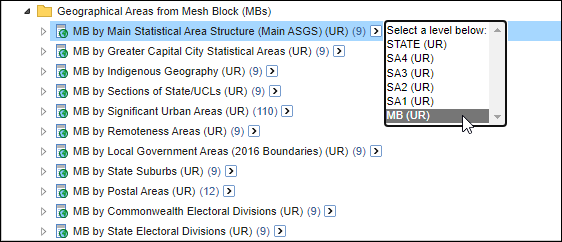
Some Census TableBuilder Pro 2016 and 2021 databases include mesh block level detail, the smallest geographical unit used in TableBuilder. Mesh blocks to enable you to build your own custom geographic areas. If you want to display a geography in a table that is not already provided in TableBuilder, you can use mesh blocks to accurately approximate a large range of other statistical regions. See the Custom data section and Census mesh block counts for help in customising your own geographies and using mesh blocks.
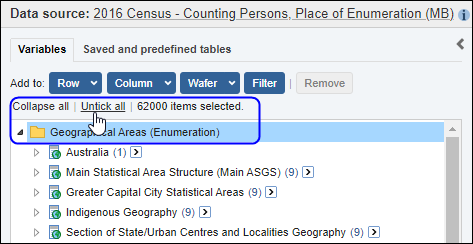
Mesh blocks are ideal for building custom geographic areas. However, you may also want to add mesh blocks directly to your table. TableBuilder has a limit of adding 62,000 categories from any one variable to a table. As there are more than 62,000 mesh blocks in each of Australia, New South Wales, Victoria and Queensland you need to select a smaller geographic area when using mesh blocks. Because of the very detailed information, you may need to build a number of tables if you want to include mesh blocks as a variable in your table.
1. If you try to add all mesh blocks to your table, an error message is displayed indicating 'A maximum of 62,000 categories can be added to a table. 'Untick all' at the top of the variable panel and select fewer categories'.
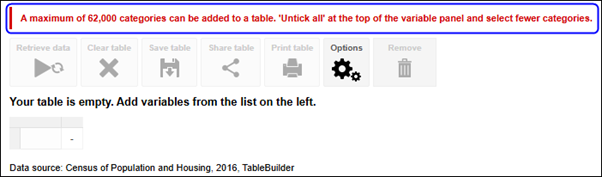
2. The number of items you currently have selected is displayed at the top of the left panel. TableBuilder stops selecting categories when it reaches the 62,000 limit. Before continuing, clear your current selection by clicking on Untick All.
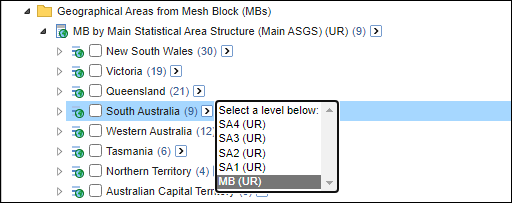
3. You can then select a smaller number of categories to build a table. This example shows all mesh blocks in South Australia being successfully selected.
Mesh blocks are restricted from cross-tabulation with certain other variables, see Confidentiality for more information.
Sort table rows
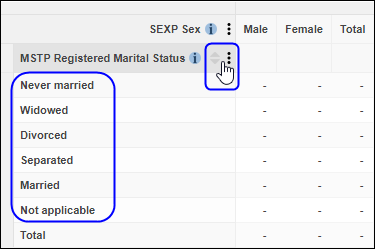
Rows can be sorted using the double arrow next to the variable names. Rows are sorted alphabetically by the variable labels. If row categories are removed and then re-added to a table, they appear in the order they have been added, not their original order. Categories can be re-ordered by using the sort option. Row variables can be sorted either by their category labels or codes.
Use the double arrows shown against the row variable label to sort based on the row labels.
Clicking the double arrow on row headings sorts based on the category names for that variable. You can toggle between:
- ascending order
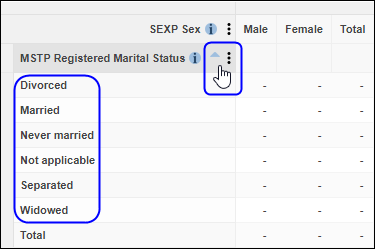
- descending order
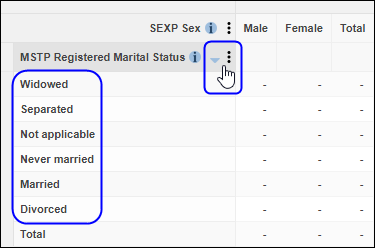
- default order
Show or hide totals in a table
Hide totals
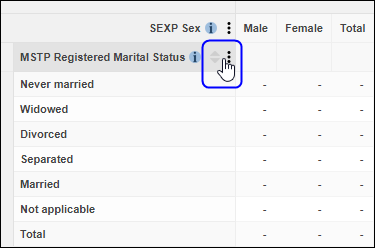
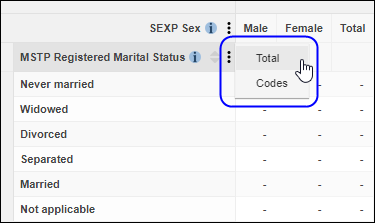
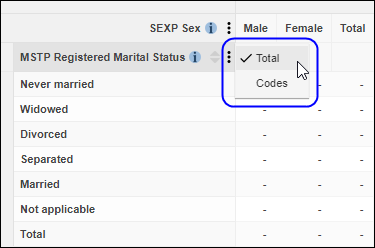
TableBuilder can automatically add totals to tables. Click on the three vertical dots menu next to the variable name to show or hide the total for the variable.
For certain variables it may not make sense to add totals, in which case the Totals option does not appear.
If you remove totals for very large tables this can improve the time taken to retrieve the data. However, if you plan to use totals, it is better to use the totals generated by TableBuilder rather than summing the interior cells after downloading your table. See Totals on the Confidentiality page.
Show totals
Hide totals
Category labels and codes
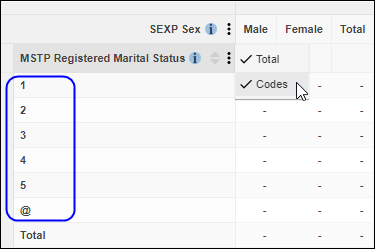
By default, the category labels show the names of the categories (such as Divorced, Separated, Married for the variable Marital Status). By clicking the three vertical dots menu next to the variable name, you can choose to display the numeric category codes instead. This can be a useful option for large classifications or variables with long category labels, such as the Australian Statistical Geography Standard (ASGS).
Table displaying category labels
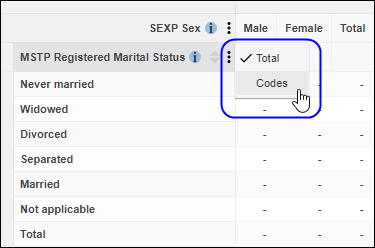
Table displaying numeric category codes instead of labels
Zero suppression
Zero suppression helps you reduce noise in tables to focus on the most relevant cells of the table. When zero suppression is enabled, TableBuilder automatically removes rows and columns that contain only zeros. This can be useful for large tables with many small and zero values, as it can reduce the size of the table significantly, making it easier to focus on the results.
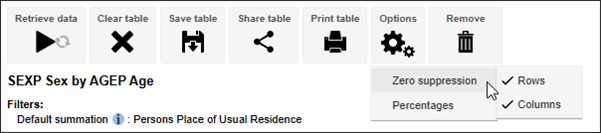
To enable zero suppression, go to the Options menu at the top of the table and select from the Rows and/or Columns options.
If wafers are included in a table, then TableBuilder determines whether to suppress a row or column by looking at the entire cube, not just the currently visible wafer. A row or column is only suppressed if it contains only zeros on all of the wafers. This means that rows and columns with all zero values still appear in the table if a row or column only contains zeros on the current wafer, but has values on at least one of the other wafers.
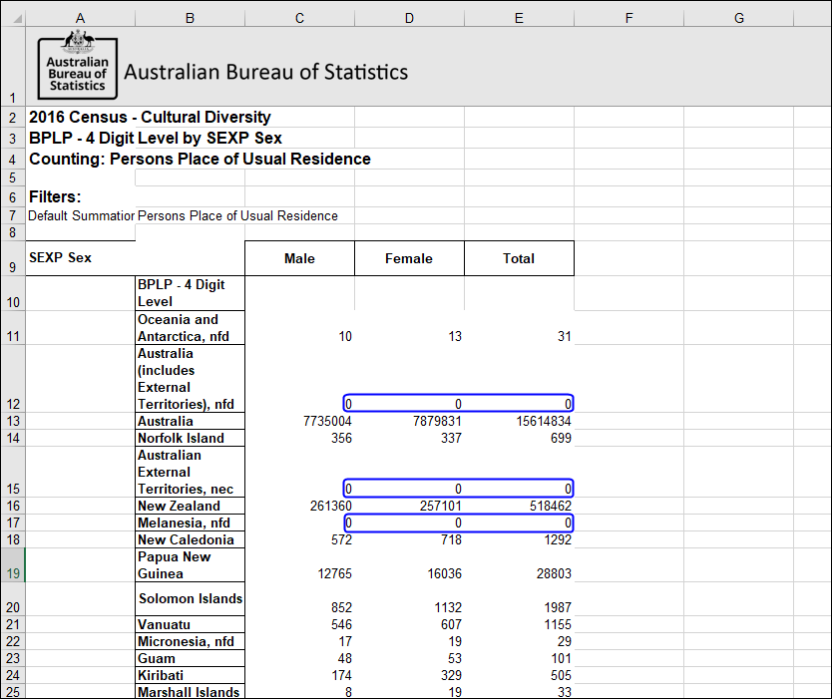
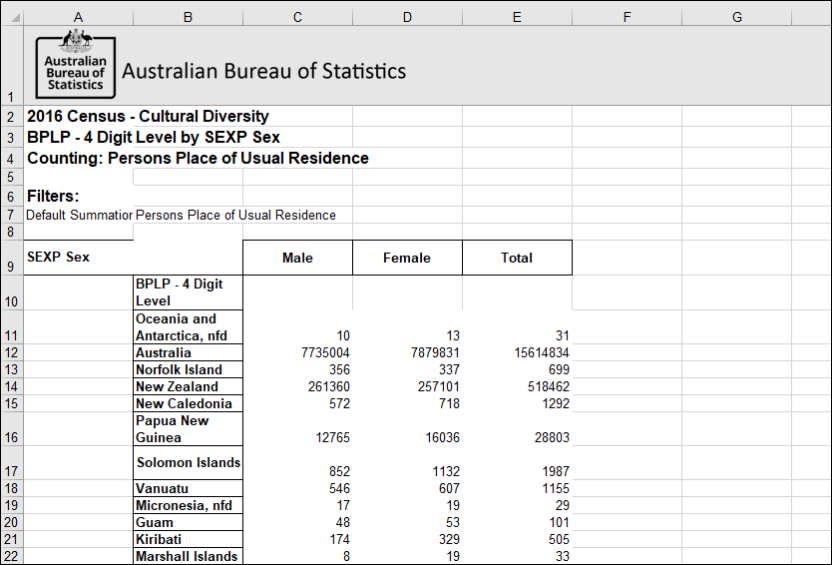
For example, this table can be reduced by enabling zero suppression for rows. TableBuilder automatically removes all the rows that have only zeros in them.
Zero suppression turned off
Zero suppression turned on
Percentages
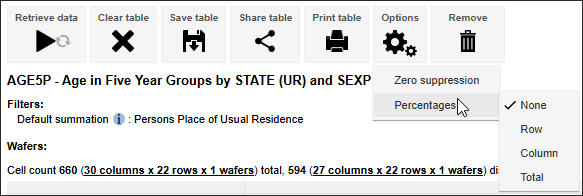
Use the Option menu above the table to change the counts in the table to percentages. The percentages option can be set to show percentages for:
- rows
- columns
- totals
- no percentages (none)
Percentages are calculated differently based on the option selected.
Percentages are not supported when opening certain predefined tables that contain grand totals.
When downloading tables containing percentages, the percentage symbol is only displayed in Excel format downloads. Other formats such as CSV include the percentage value but do not show the percent symbol (%) after the value.
Row percentages
Replaces the values in the table with a percentage of the total in each row.

Column percentages
Replaces the values in the table with a percentage of the total in each column.

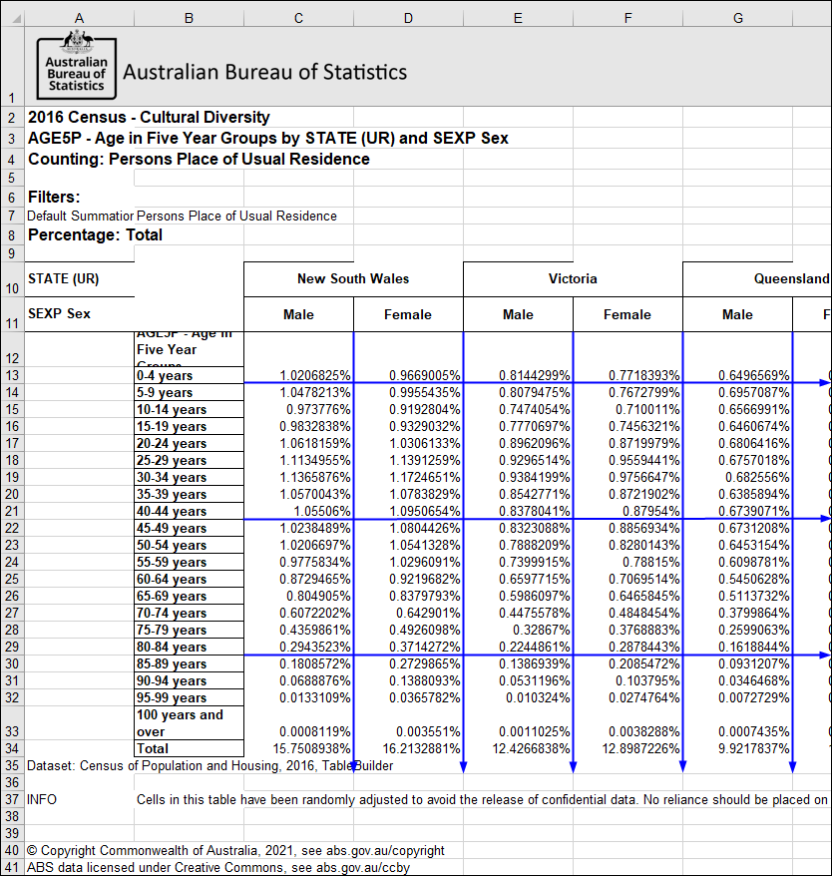
Total percentages
Replaces the values with a percentage of the grand total. If you are using wafers then this shows the total percentage across all the wafers.
No percentages
Selecting none removes percentages from the table and reverts back to counts.

Relative standard error
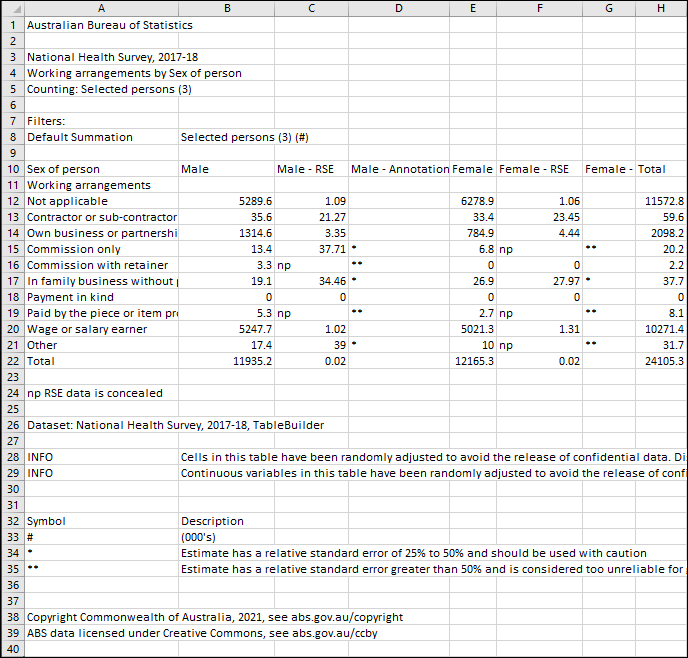
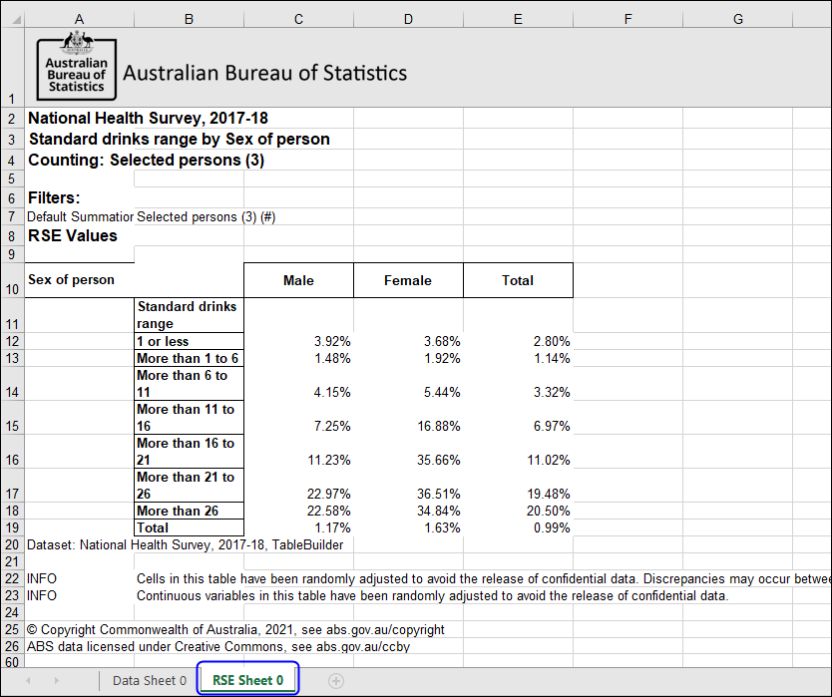
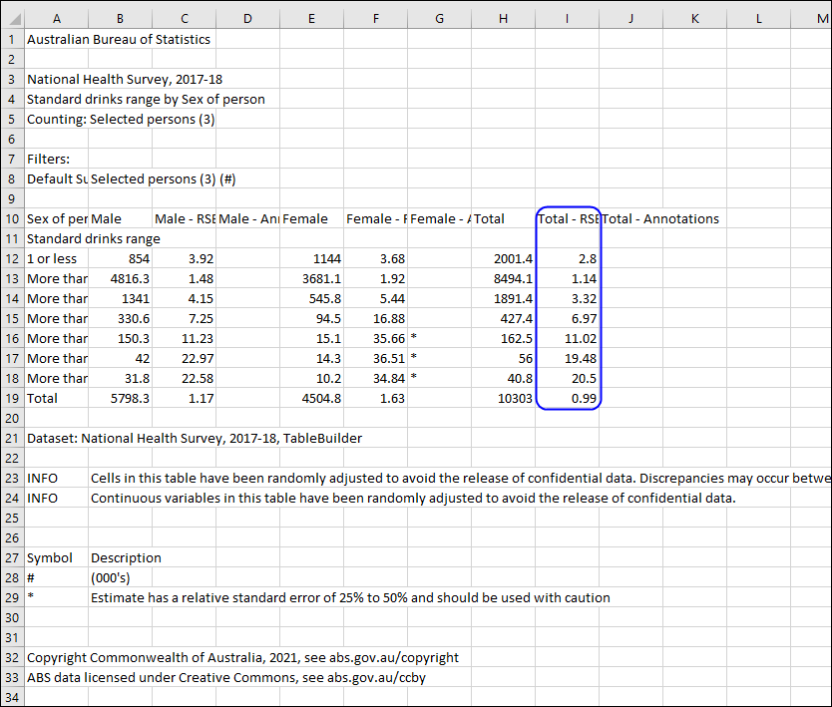
Where relative standard error (RSE) data is available for a table, this data is included in the downloaded table. Some datasets, including Census datasets, do not have RSEs. RSEs are only applicable for sample and weighted data for survey-based datasets that are subject to sampling variability. For help interpreting RSEs, see Relative standard error.
RSEs are presented differently depending on download format of table.
Excel: downloads include RSE data in a separate Excel worksheet (tab).
CSV: downloads include a separate column for RSE data.
CSV: downloads include a separate column for RSE data.
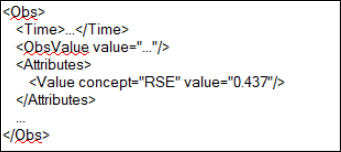
SDMX: RSE data is represented as an attribute value in the SDMX Generic Data observation element. This attribute is only added when the dataset is weighted and has RSE values in the associated data cube.
Annotations in downloaded tables
Annotations provide additional information or notes about features or aspects relating to the data or dataset. If the table contains annotations they are included in the downloaded table.
Excel:
- Annotation symbols in the table cells on the first worksheet
- Annotation details in footnotes under the table
CSV:
- Annotation symbols in a separate column
- Annotation details immediately after the table data
SDMX:
- SDMX downloaded at the dataset level contains dataset level annotation descriptions and symbols in the <Annotations> ... </Annotations> section of the XML.
Example of annotations in a CSV download