| Mar 20 | Apr 20 | Monthly change | Yearly change | ||
|---|---|---|---|---|---|
| Seasonally adjusted | |||||
| Employed people | 13,013,000 | 12,418,700 | -594,300 | -3.1% | |
| Unemployed people | 718,800 | 823,300 | 104,500 | 16.7% | |
| Unemployment rate | 5.2% | 6.2% | 1.0 pts | 1.0 pts | |
| Underemployment rate | 8.8% | 13.7% | 4.9 pts | 5.2 pts | |
| Participation rate | 66.0% | 63.5% | -2.4 pts | -2.3 pts | |
| Monthly hours worked in all jobs | 1,790 million | 1,626 million | -164 million | -8.0% |
Labour Force, Australia
This is not the latest release View the latest release
Headline estimates of employment, unemployment, underemployment, participation and hours worked from the monthly Labour Force Survey
Reference period
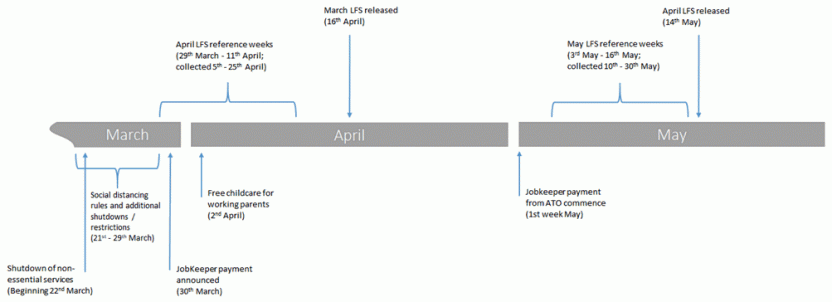
April 2020
Released
14/05/2020
Release date and time
14/05/2020 11:30am AEST
Key statistics
Seasonally adjusted estimates for April 2020:
- Unemployment rate increased to 6.2%.
- Participation rate decreased to 63.5%.
- Employment decreased to 12,418,700.
- Employment to population ratio decreased to 59.6%.
- Underemployment rate increased to 13.7%.
- Monthly hours worked decreased to 1,626 million hours.
Estimates of changes are calculated using un-rounded level estimates, and may be different from, but are more accurate than, movements obtained from the rounded level estimates.
COVID-19 impacts and changes
Major impacts on the labour market
Suspension of trend series and changes to seasonal adjustment
Net Overseas Migration revisions in LFS benchmarks
Labour Force Survey response
Treatment of people on JobKeeper, JobSeeker or stood down
For further information, please email labour.statistics@abs.gov.au.
Articles
This months Labour Force release includes the following articles:
Unemployment
In seasonally adjusted terms, in April 2020:
- the unemployment rate increased by 1.0 pts to 6.2% (1.0 pts higher than a year ago)
- unemployed people increased by 104,500 to 823,300 (and increased by 117,700 over the year to April 2020)
- the youth unemployment rate increased by 2.2 pts to 13.8% (and increased 1.9 pts over the year to April 2020)
Employment
In seasonally adjusted terms, in April 2020:
- employment decreased by 594,300 (-4.6%) to 12,418,700 people
- over the year to April 2020, employment decreased by 3.1% or 395,100 people
Underpinning these net changes in employment is extensive change which occurs in the labour market. In recent months there has generally been considerably more than 300,000 people entering employment, and more than 300,000 leaving employment each month. There are also changes in the hours that people work, which can have an impact on the full-time and part-time composition of employment.
Full-time and part-time employment
In seasonally adjusted terms, in April 2020:
- full-time employment decreased by 220,500 to 8,656,900 people, and part-time employment decreased 373,800 to 3,761,800 people
- over the year to April 2020, full-time employment decreased by 123,000 people and part-time employment decreased by 272,000 people
This change led to a decrease in the part-time share of employment over the past 12 months, from 31.5% to 30.3%.
Employment to population ratio
In seasonally adjusted terms, in April 2020:
- the employment to population ratio decreased by 2.9 pts to 59.6%, and decreased by 2.8 pts from the same time last year
The employment to population ratio provides a measure of the change in employment relative to changes in the size of the population.
Hours worked
In seasonally adjusted terms, in April 2020, monthly hours worked in all jobs:
- decreased by 163.9 million hours (-9.2%) to 1,625.8 million hours
- decreased by 8% over the year, which is higher than the 3.1% decrease in employed people
Participation
In seasonally adjusted terms, in April 2020, the participation rate:
- decreased by 2.4 pts to 63.5%, and decreased 2.3 pts over the year to April 2020
- decreased by 1.9 pts for men (68.9%) and decreased by 2.9 pts for women (58.4%)
- decreased by 2.7 pts to 76.0% for 15 to 64 year olds (the working age population). For 15 to 64 year old men, it was 81.1% and for 15 to 64 year old women it was 71.0%
- decreased 5.6 pts to 62.9% for 15 to 24 year olds
Underemployment
In seasonally adjusted terms, in April 2020:
- the underemployment rate increased by 4.9 pts to 13.7% (5.2 pts higher than a year ago)
- the underutilisation rate increased 5.9 pts to 19.9%
States and territories
| New South Wales | Victoria | Queensland | South Australia | Western Australia | Tasmania | Northern Territory | Australian Capital Territory | Australia | |
|---|---|---|---|---|---|---|---|---|---|
| Employed persons | 3,916,200 | 3,327,200 | 2,432,400 | 818,700 | 1,307,900 | 249,300 | 131,100 | 231,100 | 12,418,700 |
| Employed persons - monthly change | -5.4% | -3.7% | -5.1% | -4.8% | -4.6% | -3.4% | -3.2% | -4.0% | -4.6% |
| Employment to population ratio | 58.9% | 60.6% | 58.6% | 56.1% | 61.3% | 56.1% | 70.0% | 67.2% | 59.6% |
| Employment to population ratio - monthly change | -3.4 pts | -2.4 pts | -3.2 pts | -2.8 pts | -3.0 pts | -2.0 pts | -2.4 pts | -2.8 pts | -2.9 pts |
| Unemployment rate | 6.0% | 6.0% | 6.8% | 7.2% | 6.0% | 6.2% | 6.5% | 4.0% | 6.2% |
| Unemployment rate - monthly change | 1.1 pts | 0.8 pts | 1.2 pts | 0.9 pts | 0.6 pts | 1.3 pts | 1.2 pts | 0.6 pts | 1.0 pts |
| Underemployment rate | 13.2% | 14.1% | 13.1% | 15.7% | 14.6% | 16.8% | 10.6% | 9.0% | 13.7% |
| Underemployment rate - monthly change | 4.6 pts | 5.7 pts | 4.0 pts | 5.2 pts | 4.9 pts | 4.7 pts | 4.7 pts | 3.5 pts | 4.9 pts |
| Participation rate | 62.6% | 64.5% | 62.9% | 60.4% | 65.2% | 59.8% | 74.8% | 70.0% | 63.5% |
| Participation rate - monthly change | -2.8 pts | -2.0 pts | -2.6 pts | -2.5 pts | -2.8 pts | -1.3 pts | -1.5 pts | -2.5 pts | -2.4 pts |
Rotation group analysis
Sample composition and rotation
COVID-19 and the incoming rotation group in April
Outgoing rotation group
The importance of seasonally adjusted data
Contribution from sample components to estimates
Data files
Data downloads
Labour Force status
Data files
Table 1. Labour force status by Sex, Australia - Trend, Seasonally adjusted and Original
Table 4. Labour force status by Sex, New South Wales - Trend, Seasonally adjusted and Original
Table 5. Labour force status by Sex, Victoria - Trend, Seasonally adjusted and Original
Table 6. Labour force status by Sex, Queensland - Trend, Seasonally adjusted and Original
Table 7. Labour force status by Sex, South Australia - Trend, Seasonally adjusted and Original
Table 8. Labour force status by Sex, Western Australia - Trend, Seasonally adjusted and Original
Table 9. Labour force status by Sex, Tasmania - Trend, Seasonally adjusted and Original
Table 10. Labour force status by Sex, Northern Territory - Trend and Original
Table 10a. Labour force status by Sex, Northern Territory - Seasonally adjusted
Table 11. Labour force status by Sex, Australian Capital Territory - Trend and Original
Table 11a. Labour force status by Sex, Australian Capital Territory - Seasonally adjusted
Table 12. Labour force status by Sex, State and Territory - Trend, Seasonally adjusted and Original
Table 12a. Labour force status by Sex, Territory - Seasonally adjusted
Table 13. Labour force status for 15-24 year olds by Sex - Trend, Seasonally adjusted and Original
Table 15. Labour force status for 15-24 year olds by Educational attendance (full-time) and Sex
Table 16. Labour force status for 15-24 year olds by State, Territory and Educational attendance (full-time)
Table 17. Labour force status for 15-19 year olds by Sex - Trend, Seasonally adjusted and Original
Table 18. Labour force status for 15-64 year olds by Sex - Trend, Seasonally adjusted and Original
Hours worked
Data files
Table 19. Monthly hours worked in all jobs by Employed full-time, part-time and Sex and by State and Territory - Trend and Seasonally adjusted
Table 19a. Monthly hours worked in all jobs by Employed full-time, part-time and Sex and Territory - Seasonally adjusted
Table 21. Quarterly hours worked in all jobs by Market and Non-market sector - Seasonally adjusted
Underemployment and underutilisation
Data files
Table 22. Underutilised persons by Age and Sex - Trend, Seasonally adjusted and Original
Table 23. Underutilised persons by State and Territory and Sex - Trend, Seasonally adjusted and Original
Table 23a. Underutilised persons by Territory and Sex - Seasonally adjusted
Table 24. Underutilised persons by Age and Sex (expanded analytical series)
Table 25. Underutilised persons by State, Territory and Sex (expanded analytical series)
Flows into and out of employment
GM1 - Labour force status and Gross changes (flows) by Age, Sex, State and Territory, February 1991 onwards
Data files
All time series spreadsheets
All time series spreadsheets
Data files