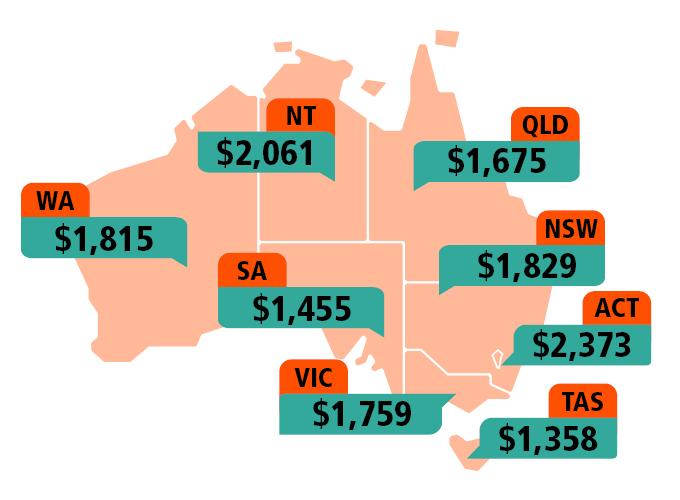
Median weekly household income
Image

Description
Based on place of enumeration. Excludes visitor only and other non-classifiable households.
Source: Total household income (weekly) (HIND)
Information on income, occupation and employment

Based on place of enumeration. Excludes visitor only and other non-classifiable households.
Source: Total household income (weekly) (HIND)
| Median income | Negative income | Nil income | $1-$149 | $150-$299 | $300-$399 | $400-$499 | $500-$649 | $650-$799 | $800-$999 | $1,000-$1,249 | $1,250-$1,499 | $1,500-$1,749 | $1,750-$1,999 | $2,000-$2,999 | $3,000 or more | |
|---|---|---|---|---|---|---|---|---|---|---|---|---|---|---|---|---|
| New South Wales | 813 | 48,024 | 558,019 | 199,715 | 301,947 | 497,863 | 497,263 | 472,795 | 453,482 | 518,187 | 580,866 | 436,915 | 379,950 | 289,392 | 519,595 | 373,538 |
| Victoria | 803 | 40,097 | 462,585 | 181,402 | 259,576 | 393,575 | 398,650 | 378,559 | 366,570 | 437,356 | 483,105 | 365,266 | 321,293 | 229,793 | 392,855 | 263,112 |
| Queensland | 787 | 28,996 | 303,632 | 140,223 | 201,611 | 325,481 | 326,763 | 322,430 | 306,103 | 360,782 | 384,211 | 280,697 | 242,883 | 177,863 | 291,027 | 170,135 |
| South Australia | 734 | 9,293 | 103,721 | 50,776 | 81,493 | 131,617 | 135,058 | 121,526 | 111,354 | 128,716 | 141,776 | 101,079 | 82,849 | 58,086 | 87,386 | 47,071 |
| Western Australia | 848 | 14,775 | 175,789 | 74,433 | 106,129 | 153,779 | 149,720 | 146,826 | 135,161 | 155,856 | 182,352 | 143,853 | 132,068 | 100,717 | 190,276 | 127,181 |
| Tasmania | 701 | 3,018 | 29,744 | 14,983 | 25,490 | 44,367 | 46,543 | 40,553 | 37,358 | 41,024 | 44,639 | 30,046 | 24,860 | 17,270 | 23,812 | 11,468 |
| Northern Territory | 936 | 1,319 | 11,169 | 6,751 | 15,308 | 11,024 | 9,485 | 8,923 | 8,737 | 12,176 | 16,339 | 13,793 | 13,095 | 9,734 | 16,841 | 7,360 |
| Australian Capital Territory | 1,203 | 1,238 | 24,751 | 11,408 | 13,363 | 15,655 | 17,863 | 19,285 | 19,895 | 26,161 | 33,173 | 30,992 | 31,827 | 25,579 | 53,018 | 29,121 |
| Australia(b) | 805 | 146,805 | 1,669,570 | 679,812 | 1,005,072 | 1,573,594 | 1,581,612 | 1,511,161 | 1,438,936 | 1,680,606 | 1,866,801 | 1,402,863 | 1,229,021 | 908,593 | 1,575,067 | 1,029,073 |
Please note that there are small random adjustments made to all cell values to protect the confidentiality of data. These adjustments may cause the sum of rows or columns to differ by small amounts from table totals.
Source: Total personal income (weekly) (INCP)
Articles and information papers that related to this topic include:
Australia’s journey to work (More information on how Australians travelled to work can be seen on our interactive map.)
Understanding income in administrative data, the Census and ABS surveys
New Census insights on income in Australia using administrative data
Learn how Census data helps community groups, businesses and governments make important decisions.
The questions from the 2021 Census are output into variables. To see descriptions of the variables, including data use considerations, relevant to this topic see the 2021 Census dictionary: Income and work.
Other relevant data downloads can be found on the following pages:
To access more 2021 Census data, see Search Census data or to build your own data sets, see Census data tools.
Explore other ABS data:
13/02/2024 - New Census insights on income in Australia using administrative data article, Total weekly income section, High income earners: corrected figure for proportion of high income earners for the applicable population.
12/10/2022 - Key statistics updated with information on employment and occupation. Income and work data summary download file amended to include second release data tables.