Wage Price Index, Australia

This is not the latest release View the latest release

The WPI measures changes in the price of labour, unaffected by compositional shifts in the labour force, hours worked or employee characteristics

Reference period
June 2020
Released
12/08/2020

Key statistics

  • The seasonally adjusted WPI rose 0.2% in June quarter 2020. 
  • The seasonally adjusted WPI rose 1.8% over the year to June quarter 2020.
  • The seasonally adjusted Private sector rose 0.1% in June quarter 2020.
  • The seasonally adjusted Public sector rose 0.6% in June quarter 2020.

Main features

June key statistics

The seasonally adjusted WPI:

  • rose 0.2% in June quarter 2020. The lowest quarterly rise since the commencement of the series in September quarter 1997.
  • rose 1.8% over the year to June quarter 2020, dipping below the previous lowest annual rate of growth recorded in June quarter 2017 (1.9%).
     
 Mar Qtr 2020 to Jun Qtr 2020Jun Qtr 2019 to Jun Qtr 2020
% change% change
Wage Price Index (WPI)
Total hourly rates of pay excluding bonuses 
Trend(a)
 Australia

na

na

 Sector
  Private

na

na

  Public

na

na

Seasonally Adjusted(b)
 Australia

0.2

1.8

 Sector
  Private

0.1

1.7

  Public

0.6

2.1

Original
 Australia

0.0

1.7

 Sector
  Private

-0.1

1.7

  Public

0.4

2.1

a. See Explanatory Notes paragraphs 39-40, 42 on the Methodology page.
b. See Explanatory Notes paragraphs 32-38, 42 on the Methodology page.
 

Sector

Quarterly seasonally adjusted:

  • The Private sector rose 0.1%.
  • The Public sector rose 0.6%.
     

Through the year

Through the year seasonally adjusted:

  • The Private sector rose 1.7% over the twelve months to the June quarter 2020.
  • The Public sector rose 2.1% over the twelve months to the June quarter 2020.
  • Both the Private and Public sector annual growth is the lowest recorded since the commencement of the series.
     

Measuring the impact of Coronavirus (COVID-19)

The ABS published an article on 23 July 2020 (Measuring the Wage Price Index during the COVID-19 pandemic) explaining the impact of COVID-19 on the measurement of the WPI in June quarter 2020.

Wage subsidies (JobKeeper) and payroll tax changes fall outside of the collection scope of the Wage Price Index.

Suspension of trend series

The Wage Price Index trend series have been suspended from June quarter 2020 until more certainty emerges in the underlying trend in labour market activity over the COVID-19 period. This is in recognition of the time series shocks in the labour market between the March quarter 2020 and June quarter 2020 data points. While trend estimates are generally the best measure of the underlying behaviour of the labour market, any large changes in the labour market as a result of COVID-19 will likely make it difficult to estimate a reliable short-term indicator of the trend.

Existing spreadsheets containing trend, seasonally adjusted and original data will continue to be published in the same format, however trend columns will be populated with ‘na’.

Quality

It is important to note that the reference period for the June quarter was the pay period on or before 15 May 2020, which was after a global pandemic was declared and during the peak period of nation-wide restrictions that impacted business activity. There was no notable impact on survey collection operations or the quality of June quarter data, with the response to the survey at a similar level as previous quarters.

Use of price indexes in contracts

Price indexes published by the Australian Bureau of Statistics (ABS) provide summary measures of the movements in various categories of prices over time. They are published primarily for use in Government economic analysis. Price indexes are also often used in contracts by businesses and government to adjust payments and/or charges to take account of changes in categories of prices (Indexation Clauses).

Use of Price Indexes in Contracts sets out a range of issues that should be taken into account by parties considering the inclusion of an Indexation Clause within a contract utilising an ABS published price index.

Frequently asked questions

The Wage Price Index FAQs page has answers to a number of common questions to do with price indexes and the Wage Price Index, in particular.
Commentary

In June quarter 2020 wage growth was recorded for jobs with scheduled increases (enterprise agreement and award based jobs) offsetting this growth were falls for the more informal agreements. These informal agreements are more sensitive to labour market changes.

Main contributors

Main state and territory contributors to wage growth were:

  • South Australia mostly driven by the public sector, and
  • Western Australia based on moderate private sector growth.
     

Offsetting falls occurred in:

  • Victoria, where private sector wage falls more than offset moderate public sector growth.
     

Main industry contributing to wage growth was:

  • Education and training.
     

Offsetting falls occurred in:

  • Professional, scientific and technical services, and
  • Construction.
     

Wage growth by state or territory

Original estimates:

  • South Australia recorded the highest quarterly rise of 0.4%.
  • Victoria recorded the only quarterly fall of -0.1%.
  • South Australia and Tasmania recorded the highest through the year rise of 2.4%.
  • Western Australia recorded the lowest through the year rise of 1.6%.
     

Wage growth by industry

Original estimates:

  • Electricity, gas, water and waste services recorded the highest quarterly rise of 0.6%.
  • Other services recorded the largest quarterly fall of -0.9%.
  • Arts and recreation services recorded the highest through the year rise of 2.6%.
  • Construction recorded the lowest through the year rise of 0.8%.
  • This is the first quarterly fall in industry wages since the commencement of the series in September 1997.
     

Spotlight - wage reductions

Data collected on wages and salaries in June quarter 2020 highlighted the unprecedented impact of social distancing measures and restricted business activities. The COVID-19 pandemic has resulted in large price changes for a number of jobs. Private sector businesses reported genuine market-based reductions in jobs paid by individual arrangement to ease financial pressures. These agreements are more sensitive to labour market conditions.

June 2020 quarter WPI reported a higher proportion of wage reductions for Manager and Professional roles than for other occupations.

At an industry level, the Professional, scientific and technical services, Construction and Rental, hiring and real estate services industries had the highest proportions of wage reductions.

Spotlight - Labour Price Index

The impact of the JobKeeper wage subsidy and payroll tax changes on Australian employing businesses labour costs.

In response to the COVID-19 pandemic the Commonwealth government implemented the JobKeeper wage subsidy while state and territory governments introduced measures through payroll taxes.

The JobKeeper wage subsidy initially provided a fixed $1,500 per employee per fortnight for eligible businesses and employees. (Methods changes during the COVID-19 period)

State and territory governments introduced changes to payroll taxes, deferring or waiving payments for a fixed period of time as well as changing payment thresholds.

The scope of the Wage Price Index (WPI) survey does not include subsidies and own-account workers (self-employed). To assist with understanding the impacts on employing business labour costs, from the JobKeeper subsidy and payroll tax changes, the ABS reconstructed the Labour Price Index (LPI) based on data collected from the WPI survey. The LPI represents the changes in the price of all labour costs including subsidies. 

The LPI was last published in September quarter 2011 on a financial year basis. Where possible the same sources and methods have been used to construct a quarterly series. (see Appendix)

As expected, between March and June quarters 2020, the LPI showed significant labour cost reductions for employing businesses, as a result of the introduction of the JobKeeper subsidy and changes in payroll taxes. Previous LPI growth over June quarter 2019 recorded modest rises across both the private and public sectors in line with changes in wages and salaries. June quarter 2020 also recorded a significant slowing in the rate of wage and salary growth, as reported in the Wage Price Index.

SectorQuarterly movementThrough the year movement
JunMarJunJunMar
20202020201920202020
Labour Price IndexAll-12.50.40.5-112.2
 Private-15.70.40.4-14.32.1
 Public-1.40.60.60.32.4

As shown in Figure 1, JobKeeper was the major contributor to the LPI fall, with small downward contributions from leave provisions and superannuation.

Industries

COVID-19 related lockdowns and social distancing impacted industries in different ways and to varying degrees. 

LPI falls were recorded across all industries.  As expected, industries receiving more wage subsidies had larger reductions in labour costs. Private sector businesses were the main recipients of assistance packages from government and the remainder of this Spotlight will focus on this sector.

The largest reductions in the private sector LPI were in the Arts and recreation services, Accommodation and food services, Other services and to a lesser extent the Rental, hiring and real estate services industries. Significant segments of these industries were affected by mandated business closures, with a large proportion of businesses satisfying eligibility tests for assistance.

These levels of support were mirrored in the recently released June quarter National Accounts release where government support for business, through the JobKeeper and Boosting Cash Flow for Employers payments, were greatest in the hospitality and tourism related industries.

The industries that recorded smaller LPI falls recorded offsetting rises in wages over the June quarter 2020.

The Electricity, gas, water and waste services industry recorded the largest rate of wage growth and the lowest reduction in the LPI, followed by the Mining, Financial and insurance services, and Education and training industries.

Accessing the JobKeeper¹ wage subsidy

While the LPI data is not designed to produce estimates of total JobKeeper take-up or costs, it does provide some insight into the relative changes in labour costs.

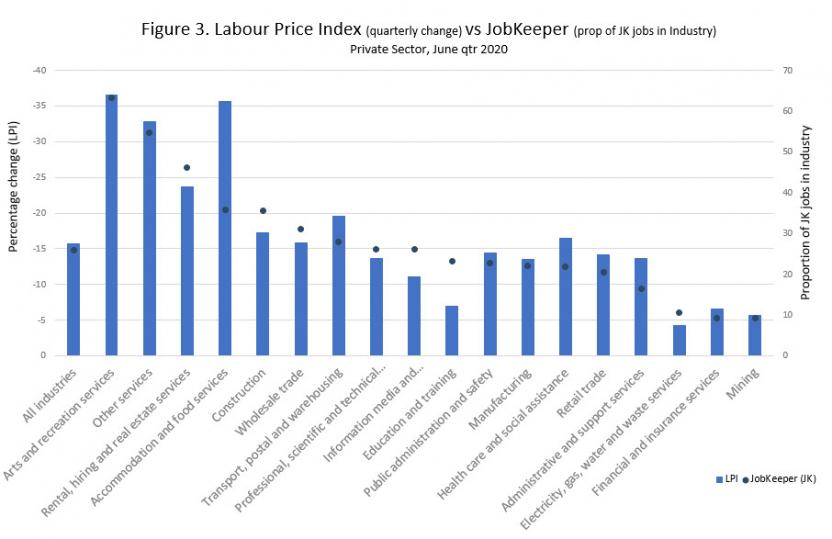
In the majority of cases, industries with the highest proportion of jobs receiving the JobKeeper wage subsidy showed the largest falls in the LPI. The noticeable industries that depart from this pattern were the Accommodation and food services and Education and training industries, where other factors such as the structure of the work force and average earnings also influenced the LPI.

Figure 3. Labour Price Index (quarterly change) vs JobKeeper (prop of JK jobs in Industry)

Figure 3. Labour Price Index (quarterly change) vs JobKeeper (prop of JK jobs in Industry)
Shows the Labour Price Index (quarterly change) and the proportion of JobKeeper jobs in industry. Data can be found below.

Data for: Figure 3. Labour Price Index (quarterly change) vs JobKeeper (prop of JK jobs in Industry)

LPIJobKeeper (JK)
All industries-15.725.8
Arts and recreation services-36.663.3
Accommodation and food services-35.635.7
Other services-32.854.8
Rental, hiring and real estate services-23.746.1
Transport, postal and warehousing-19.627.9
Construction-17.335.7
Health care and social assistance-16.521.9
Wholesale trade-15.831.2
Public administration and safety-14.422.8
Retail trade-14.220.5
Professional, scientific and technical services-13.726.1
Administrative and support services-13.716.4
Manufacturing-13.522.0
Information media and telecommunications-11.126.0
Education and training-723.2
Financial and insurance services-6.69.3
Mining-5.69.2
Electricity, gas, water and waste services-4.210.7


The Accommodation and food services industry recorded one of the largest falls in the LPIs while having a lower proportion of eligible JobKeeper jobs compared with the other industries displaying similar falls. The large proportion of casual jobs within the industry, combined with high rate of job occupants with multiple jobs (Jobs in Australia 6160.0), may have affected the eligibility of jobs for the wage subsidy. The nature of these jobs has meant that the JobKeeper subsidy more often completely offset total wages in this industry, with a lesser proportion of jobs eligible for the subsidy being paid above $750 per week.

Similar compositional factors influenced the LPI for the Education and training industry. A lower proportion of part-time jobs and higher average earnings meant that the majority of JobKeeper payment recipients were only partially offsetting their total wage cost by the subsidy. In June quarter 2020 scheduled wage rises were also recorded across the industry, increasing marginally the total labour cost and reducing the subsidy related fall.

Smaller LPI industry falls were recorded in Electricity, gas, water and waste services, Mining, Financial and insurance services, and Education and training, where businesses were less affected by closures and less likely to be eligible for assistance programs. The wage component of the LPI also recorded rises over the quarter in segments of each of these industries, through regular wage review processes.

Figure 4. shows, by industry, the proportion of jobs eligible for JobKeeper and the proportion of jobs partially supported by JobKeeper i.e. in receipt of wages above the JobKeeper threshold. The difference between the partially supported jobs and all eligible jobs shows the proportion of jobs where the cost of wages was fully supported by the JobKeeper payments (ie. zero wage cost to the business).

The Arts and recreation services and Accommodation and food services industries both had a large proportion of jobs supported completely by JobKeeper payments, which contributed to the large falls in labour costs reported by the LPI.

While the proportion of eligible JobKeeper jobs was also high across the Other services and Rental, hiring and real estate services industries, a large proportion of these jobs were only partially supported by the JobKeeper payments. A drop in the wages component in the Other services industry over the June quarter 2020 contributed to a larger fall in the LPI than was observed in the Rental, hiring and real estate services industry.

Note 1: JobKeeper information was collected in the WPI survey. The JobKeeper wage subsidy package was available to employing businesses and non-employing own account workers.  Own account workers (self-employed businesses) are not included the WPI survey.   It should be noted that a number of industries have a higher concentration of own-account workers, and as such estimates of the industries JobKeeper take up and LPI would be different if these businesses were included.

Data downloads - time series spreadsheets

I-Note

The wage price indexes in Tables 1, 2b, 3b, 4b, 5b, 7b, 8b and 9b are updated and released every quarter. The corresponding financial year wage price indexes in Tables 2a, 3a, 4a, 5a, 7a, 8a and 9a are updated and released each June quarter for the preceding financial year. There are no financial year indexes created for Table 1.

Table 1. Total hourly rates of pay excluding bonuses: sector, original, seasonally adjusted and trend

Table 2a. Total hourly rates of pay excluding bonuses: all sectors by state, original (financial year index numbers for year ended June quarter)

Table 2b. Total hourly rates of pay excluding bonuses: all sectors by state, original (quarterly index numbers)

Table 3a. Total hourly rates of pay excluding bonuses: private sector by state, original (financial year index numbers for year ended June quarter)

Table 3b. Total hourly rates of pay excluding bonuses: private sector by state, original (quarterly index numbers)

Table 4a. Total hourly rates of pay excluding bonuses: public sector by state, original (financial year index numbers for year ended June quarter)

Table 4b. Total hourly rates of pay excluding bonuses: public sector by state, original (quarterly index numbers)

Table 5a. Total hourly rates of pay excluding bonuses: sector by industry, original (financial year index numbers for year ended June quarter)

Table 5b. Total hourly rates of pay excluding bonuses: sector by industry, original (quarterly index numbers)

Table 7a. Hourly rates of pay including bonuses: sector, original (financial year index numbers for year ended June quarter)

Table 7b. Hourly rates of pay including bonuses: sector, original (quarterly index numbers)

Table 8a. Ordinary hourly rates of pay excluding bonuses: all sectors by state, original (financial year index numbers for year ended June quarter)

Table 8b. Ordinary hourly rates of pay excluding bonuses: all sectors by state, original (quarterly index numbers)

Table 9a. Ordinary hourly rates of pay excluding bonuses: sector by industry, original (financial year index numbers for year ended June quarter)

Table 9b. Ordinary hourly rates of pay excluding bonuses: sector by industry, original (quarterly index numbers)

All WPI series: original (quarterly index numbers)

All WPI Series: original (financial year index numbers for year ended June quarter)

All time series spreadsheets

Data downloads - data cubes

63450. Distribution of expenditure on wages, wage price index, Australia

Previous catalogue number

This release previously used catalogue number 6345.0.

History of changes

History of changes

2 November 2020. Updated release with Spotlight – Labour Price Index, an analytical index that helps explain the changes in the cost of labour for employers through the COVID-19 pandemic.

Back to top of the page