Australian National Accounts: Tourism Satellite Account

This is not the latest release View the latest release

Estimates of tourism’s direct contribution to the economy including GDP, value added, employment and consumption by product and industry

Reference period
2021-22 financial year
Released
8/12/2022

Key statistics

  • Tourism gross domestic product (GDP) rose 26.4% to $35.1b in chain volume terms in 2021-22 but remains below the 2018-19 peak of $61.9b.
  • Tourism's contribution to economy GDP rose to 1.6% in 2021-22 but remains below the 2018-19 level of 3.1%.
  • Domestic tourism consumption rose by $5.3b to $85.0b in 2021-22 while international tourism rose by $5.6b to $6.4b in chain volume terms.
  • Tourism filled jobs rose to 501,400 in 2021-22 but remains below the 2018-19 peak of 701,100 filled jobs.
Key tourism indicators, comparison of 2021-22 with 2020-21
  2020-21 (a)2021-22 
  $m$m% change
Gross Domestic Product (GDP)    
 Current prices    27,800              36,491            31.3
 Chain volume measures    27,800              35,136            26.4
Gross Value Added at basic prices    
 Current prices    25,751              33,354           29.5
 Chain volume measures    25,751              32,102           24.7
Domestic consumption   
 Current prices    79,660             90,109          13.1
 Chain volume measures    79,660             84,971            6.7
International consumption   
 Current prices        791              6,697         746.6
 Chain volume measures        791              6,415         711.0
Filled jobs '000    412,600          501,400           21.5

(a) As the reference period for chain volume measures is 2020-21, chain volume measures and current prices are identical in 2020-21.

Key tourism indicators, comparison of 2021-22 with 2018-19 (pre COVID-19) 
  2018-192021-22 
  $m$m% change
Gross Domestic Product (GDP)    
 Current prices             60,271              36,491-39.5
 Chain volume measures             61,910              35,136-43.2
Gross Value Added at basic prices    
 Current prices             55,186              33,354-39.6
 Chain volume measures             56,685              32,102-43.4
Domestic consumption   
 Current prices          113,021             90,109-20.3
 Chain volume measures          115,687             84,971-26.6
International consumption   
 Current prices           39,326              6,697-83.0
 Chain volume measures           40,740              6,415-84.3
Filled jobs '000          701,100          501,400-28.5


Direct tourism

All references to "tourism" are referring to "direct tourism" unless otherwise specified. A direct tourism impact occurs where there is a direct (physical and economic) relationship between the visitor and producer of a good or service. For more information, refer to the Methodology section.

Chain volume measures

  • Tourism GDP rose 26.4% in 2021-22 but stands at 56.8% of its 2018-19 level.
  • Gross value added (GVA) rose 24.7% to $32.1b in 2021-22 but remains below the 2018-19 level of $56.7b.
  • Household consumption increased 4.8% to $72.2b in 2021-22.
  • Business consumption increased 18.4% to $12.8b in 2021-22. 

Current price measures

  • Tourism GDP rose 31.3% to $36.5b in 2021-22 but remains below the 2018-19 level of $60.3b.
  • Tourism GVA increased 29.5% to $33.4b in 2021-22 and represents 60.4% of 2018-19 levels.

Industry gross value added, current prices

  • The air, water and other transport industry's GVA increased by $1.8b in 2021-22, however is only at 35.3% of 2018-19 levels. 
  • The education and training industry's GVA increased by $1.0b in 2021-22, however is only at 21.6% of 2018-19 levels.
  • The growth in domestic tourism activity has seen the GVA for both the accommodation and the cafes, restaurants and takeaway food outlets industries rebound in 2021-22, with increases of 17.1% and 7.8% respectively.
  • The travel agency and tour operators industry's GVA increased by $1.7b, however is only at 56.4% of 2018-19 levels.

Tourism employment

  • Tourism accounted for 3.5% of the filled jobs in the whole economy in 2021-22 but still down from 2018-19 when it accounted for 5.1% of filled jobs.
  • The greatest increases in filled jobs in 2021-22 occurred in cafes, restaurants and takeaway food services (up 20,800 jobs), accommodation (up 18,400 jobs), education and training (up 10,500 jobs), travel agency and information centre services (up 9,200 jobs) and sports and recreation services (up 8,900 jobs).
  • Increases were recorded in both full-time filled jobs (up 26.6% to 245,500 jobs) and part-time filled jobs (up 17.1% to 256,000 jobs) in 2021-22.
  • In 2021-22, filled jobs worked by females increased more than those filled by males with an increase of 24.6% to 271,600 jobs and 18.1% to 229,900 jobs respectively.

Key considerations in data interpretation

Key 2021-22 COVID-19 dates

  • 23 July 2021: The New Zealand and Australian travel bubble was suspended
  • July-September 2021: COVID-19 Delta strain outbreaks in New South Wales, Victoria and the Australian Capital Territory resulted in state/territory lockdowns for most of the September quarter 2021. Other jurisdictions closed interstate borders to these affected areas 
  • Mid October 2021: Victoria, Australian Capital Territory and New South Wales Greater Sydney lockdown ended
  • December quarter 2021: Majority of state borders opened to fully vaccinated travellers
  • 1 November 2021: Australia opened international borders to fully vaccinated Australian citizens, permanent residents and temporary visa holders with no quarantine requirement for some states
  • 15 December 2021: international students and other eligible visa holders were able to return to Australia
  • January-February 2022: COVID-19 Omicron variant outbreak in various states resulted in tighter restrictions for people located in hotspot locations
  • 15 January 2022: Queensland's state border opened to all domestic travellers, and most COVID-19 restrictions were lifted
  • 21 February 2022: Australia opened its international borders for fully vaccinated non-resident travellers
  • 3 March 2022: Western Australia opened its state border allowing fully vaccinated travellers to enter the state without quarantine
  • 17 April 2022: Overseas travellers no longer needed to provide a negative COVID-19 test before entering Australia

Tourism estimates

The International Visitor Survey (IVS) data sourced from Tourism Research Australia (TRA) is one of the key inputs to this account. Due to the international border closure and the potential public health risk during the pandemic, IVS interviews were paused from September 2020. For information on TRA COVID-19 changes, please refer to their webpage

The IVS data used to compile the 2021-22 TSA is therefore partially imputed. For details on the potential implications of this, please refer to the Methodology section on Measurement Error. 

Changes in this issue

Annual co-efficient benchmarks

As mentioned in the previous release, the ABS has moved to an annual coefficient-only benchmark. In addition to compiling the 2019-20 benchmark, the ABS has compiled a preliminary benchmark for 2020-21 to capture structural changes in the tourism economy during that period.

Tourism employment and hours worked estimates

The main source of data for tourism employment has changed from the Labour Force Survey to the Labour Account. Due to the large number of secondary jobs and the highly casualised nature of the tourism workforce, filled jobs from the Labour Account is a more meaningful measure than employed persons from the Labour Force Survey. This change brings the annual tourism employment numbers into alignment with the Quarterly Tourism Labour Statistics (QTLS). See the Methodology section for more detail.

Data for hours worked for 2020-21 and 2021-22 have not been published this year. The methodology for determining tourism hours worked is based on industry value add benchmark ratios (see Methodology section). As value added estimates have been impacted by COVID support payments, the benchmark ratios are unable to determine the number of hours each worker spends in directly serving tourists. While it is expected that the productivity estimate would show a fall, the ABS is unable to determine the magnitude of this fall. 

Analysis of results

The contribution of tourism to the Australian economy has been measured using the demand generated by visitors and the supply of tourism products by domestic producers.

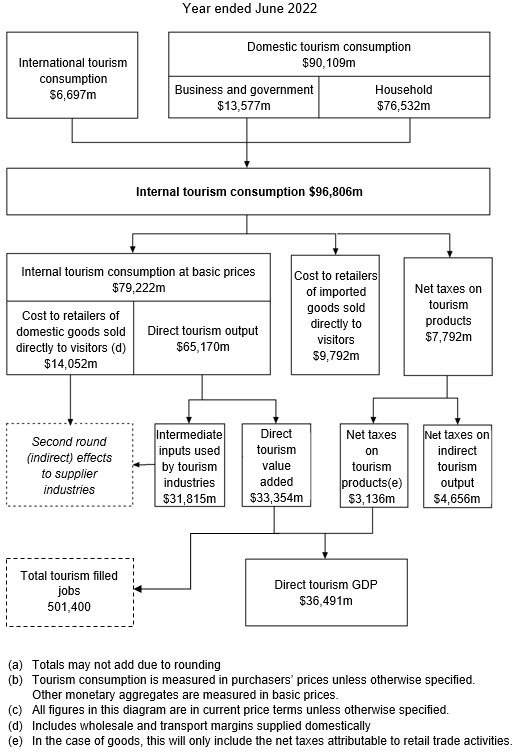
The diagram below provides a graphical depiction of the flow of tourism consumption through the Australian economy in 2021-22. What the diagram highlights is that, unlike traditional ANZSIC industries in the Australian National Accounts, tourism is not measured by the output of a single industry, but rather from the demand side i.e. the activities of visitors. It is the products that visitors consume that define what the tourism economy produces. The diagram shows how the value of internal tourism consumption (as measured by the sum of international and domestic tourism consumption in purchaser's prices, i.e. the price the visitor pays) is disaggregated to either form part of tourism GVA and tourism GDP or is excluded as it either forms part of the "second round" indirect effects of tourism or the output was not domestically produced.

Flow of tourism consumption through the Australian Economy (a)(b)(c)

Image: shows the flow of tourism consumption through the Australian economy in 2021-22.
A flow chart representing the flow of tourism consumption through the Australian economy, year ending June 2022. Note, totals may not add due to rounding; tourism consumption is measured in purchasers’ prices unless otherwise specified. Other monetary aggregates are measured in basic prices; all figures in this diagram are in current price terms unless otherwise specified. Domestic tourist consumption to the value of $90,109 million is comprised of business and government, to the value of $13,577 million, and household, to the value of $76,532 million. International tourism consumption, to the value of $6,697 million, combines with domestic tourist consumption to create internal tourism consumption, to the value of $96,806 million. Internal tourism consumption splits into three values; internal tourism consumption at basic prices, to the value of $79,222 million; cost to retailers of imported goods sold directly to visitors, to the value of $9,792 million, and net taxes on tourism products to the value of $7,792 million. Internal tourism consumption at basic prices is comprised of cost to retailers of domestic goods sold directly to visitors, including wholesale and transport margins supplied domestically, to the value of $14,052 million; and direct tourism output, to the value of $65,170 million. Direct tourism output flows into two values; intermediate inputs used by tourism industries, to the value of $31,815 million; and direct tourism value added, to the value of $33,354 million. Cost to retailers of domestic goods sold directly to visitors and intermediate inputs used by tourism industries connect to second round (indirect) effects to supplier industries. Net taxes on tourism products flows into two values; net taxes on tourism products (in the case of goods, this will only include the net taxes attributable to retail trade activities), to the value of $3,136 million; and net taxes on indirect tourism output to the value of $4,656 million. Direct tourism value added and net taxes on tourism products combine to create direct tourism GDP, to the value of $36,491 million. Direct tourism value added is used to estimate total tourism employed persons, to the value of 501,400 tourism filled jobs.

Revisions

Revisions are a necessary and expected part of accounts compilation as data sources are updated and improved over time. This issue includes revisions to tourism aggregates from 2017-18 to 2020-21. 

Revisions in the 2021-22 release include:

  • Revisions to both domestic and international tourism expenditure as a result of the TSA annual balancing and confrontation process. This is particularly the case for tourism products where the estimates have been modelled using a range of source data.
  • Replacing modelled 2020-21 net taxes, imports and margins data with the latest issue of Australian National Accounts: Supply Use Tables (available on a T-1 basis) for 2020-21. 
  • Revisions made to international tourism consumption are mainly due to the incorporation of updated data from the Survey of International Trade in Services (SITS) for 2019-20 and 2020-21 and an adjustment to the 2019-20 proportion of short-term visitors arriving for education purposes. 

Please note, the revisions to the chain volume estimates level across the time series are an expected part of re-referencing the indexes to 100 in the latest reference year.

Data downloads

Australian National Accounts: Tourism satellite account

Create your own tables and visualisations

ABS provide access to a number of other datasets for you to create your own tables and make visualisations. See what's available in Data Explorer

Caution: Data in Data Explorer is currently released after the 11:30am release on the ABS website. Please check the reference period when using Data Explorer. For information on Data Explorer and how it works, see the Data Explorer user guide.

Inquiries

For further information about these and related statistics, please contact the Customer Assistance Service via the ABS website Contact Us page. The ABS Privacy Policy outlines how the ABS will handle any personal information that you provide to us. 

Previous catalogue number

This release previously used catalogue number 5249.0.

Back to top of the page