Technical note
This quarter's Finance and Wealth includes the following technical note:
Financing resources and investment table
Financial market summary table
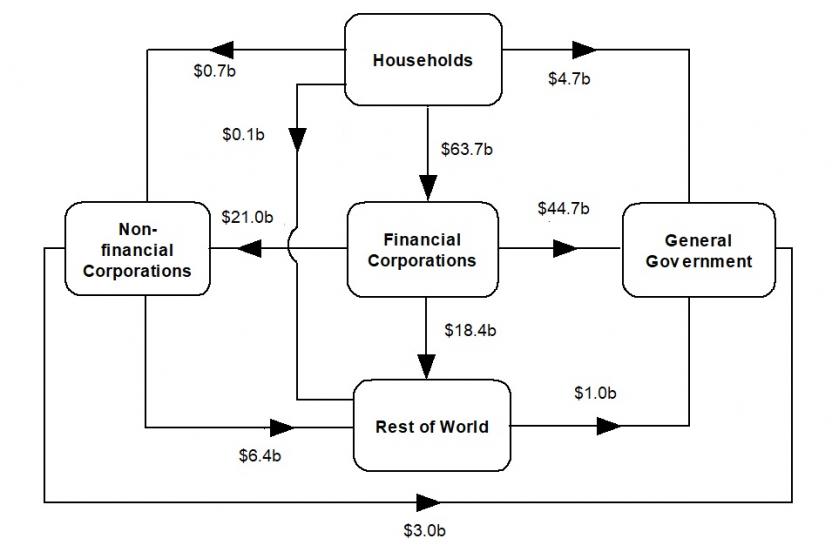
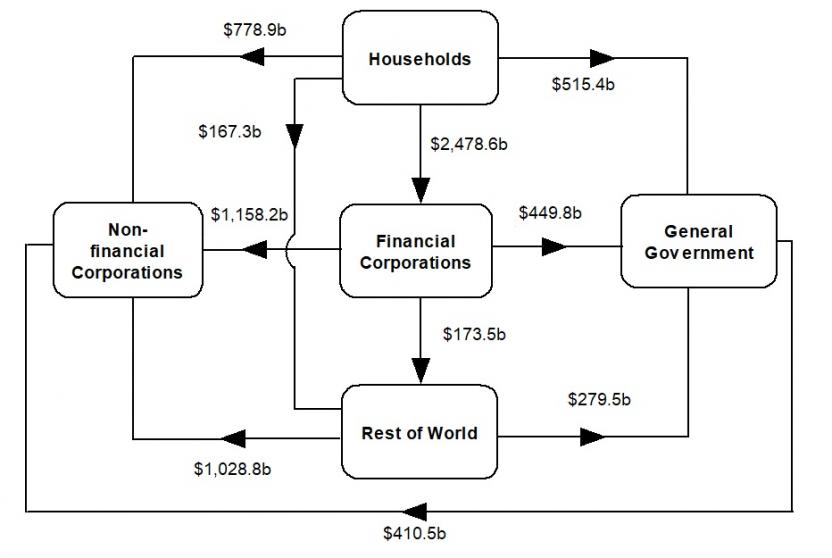
Flow of funds diagrams
National investment
National investment fell $11.0b to $120.4b in the September quarter.
- General government investment decreased by $8.3b to $19.8b driven by a fall in gross fixed capital formation in both national and state and local general government.
- Non-financial corporations' investment decreased by $2.6b to $53.0b, driven by a fall in gross fixed capital formation in both public and private non-financial corporations.
- Household investment was flat, at $44.7b, driven by an increase in gross fixed capital formation offset by a fall in inventories.
Financial investment
Australia was a net lender of $21.7b, the tenth consecutive quarter of net lending. The main contributors were a:
- $61.0b acquisition in rest of world (ROW) equities, driven by pension funds, other private non-financial corporations (OPNFC) and non-money market funds.
- offset by $23.4b purchase of listed equities by ROW, issued by OPNFCs and authorised deposit taking institutions(ADI).
Pension funds, OPNFC and non-money market funds continued to invest in overseas markets. Acquisition of Australian equity reflect strong investor demand as listed banks outperformed the domestic stock market this quarter.
Households
Households' $65.9b net lending position was due to a $111.1b acquisition of assets, offset by a $45.2b incurrence of liabilities.
The acquisition of assets was lead by:
- $70.2 in deposits
- $23.8b in net equity in pension funds
While liabilities were driven by:
- $37.6b in loan borrowings
Deposits increased as households continued to save as state specific lockdowns limited spending opportunities. Acquisition of net equity in pension funds was due to continued improvement in the labour market and the increase in superannuation guarantee from 9.5% to 10%. Increased activity in the property market and the low interest rate environment saw strength in demand for housing loans by owner-occupiers and investors.
Non-financial corporations
Non-financial corporations' $14.0b net borrowing position was due to a $31.7b acquisition of financial assets offset by $45.7b incurrence of liabilities. Liabilities were driven by:
- $37.9b in equity raising
- $8.7b in loan borrowing
Businesses sought to raise funds through equities markets with continued investor demand from rest of world. Loans from ADIs strengthened as private businesses borrowed funds as industries recover from the impacts of the pandemic.
General government
General government's $46.2b net borrowing position was due to a $17.5b acquisition in assets offset by $63.8b incurrence of liabilities. Liabilities were driven by:
- $23.5b net issuance of bonds
- $22.0b in loan borrowings
Loan borrowing increased to fund state and local general government expenditure in response to COVID-19 outbreaks and subsequent state lockdowns. Bond issuance by the national general government also strengthened as the Commonwealth government increased social assistance benefits and health spending associated with the COVID-19 outbreaks and state lockdowns.

