Australian National Accounts: Finance and Wealth

This is not the latest release View the latest release

National, public and private corporations, government and household financial and capital accounts, and household balance sheets.

Reference period
March 2022
Released
23/06/2022

Key statistics

  • Household wealth rose $172.8b (1.2%) to a record $14,891b
  • Demand for credit was at a record $218.8b, an increase of $103.9b
  • Australia's net lending position fell $8.6b to $2.7b
  • Capital investment as a proportion of GDP fell to 22.7%

Main features

Financing resources and investment table

Financing resources and investment March quarter 2022, original, current prices, $b
    Non-financial corps Financial corps Government Households Total national Rest of world
Financing resources      
 Net saving (a) -6.416.3-2.540.047.4-7.7
 plus Consumption of fixed capital 45.33.211.533.193.1-
 Gross saving 38.919.59.073.0140.5-7.7
 plus Net capital transfers 0.20.0-1.61.2-0.20.2
 less Statistical discrepancy (b) ----7.7-
 Total financing resources 39.119.57.474.3132.6-7.6
Uses of financing (investment)      
 Capital formation      
  Gross fixed capital formation 52.62.920.644.2120.2-
  plus Changes in inventories 3.30.01.50.14.8-
  plus Net acquisition of non-produced non-financial assets -0.3-0.3---
  Total capital formation 55.52.922.444.3125.1-
 plus Financial investment      
  Aquistition of financial assets 119.4102.513.852.4120.4117.6
  less Incurrence of financial liabilities 164.556.619.744.5117.6120.4
  Net Financial investment (Net lending (+) / net borrowing (-)) -45.145.9-5.97.82.7-2.7
 less Net errors and omissions-28.729.39.1-22.2-4.84.8
 Total investment39.119.57.474.3132.6-7.6

- nil or rounded to zero
(a) Net saving for the rest of world is the balance on the external income account.
(b) The statistical discrepancy is not able to be distributed among the sectors.

Financial market summary table

Financial market summary, $b
  Amounts outstanding,
Dec-21
Transactions,
Mar-22
Other changes,
Mar-22
Amounts outstanding,
Mar-22
Currency and deposits    
  Currency 107.0-0.7-106.3
  Transferable deposits 2,187.444.6-4.92,227.2
  Other deposits 1,378.935.9-7.41,407.4
Short term debt securities    
  Bills of exchange 8.3-0.3-8.0
  One name paper 523.2-11.4-7.8503.9
Long term debt securities    
  Bonds, etc. 3,226.2168.0-165.63,228.5
Derivatives    
  Derivatives 713.6-154.4354.0913.2
Loans and placements    
  Short term 401.014.4-5.9409.4
  Long term 4,318.762.6-23.14,358.2
Shares and other equity    
  Listed 2,645.945.818.52,710.1
  Unlisted 5,646.3190.4-143.15,693.6
Insurance technical reserves    
  Reserves of pension funds and life 3,279.025.6-73.23,231.4
  General insurance payments 155.4-5.20.0150.2

- nil or rounded to zero 

Flow of funds diagrams

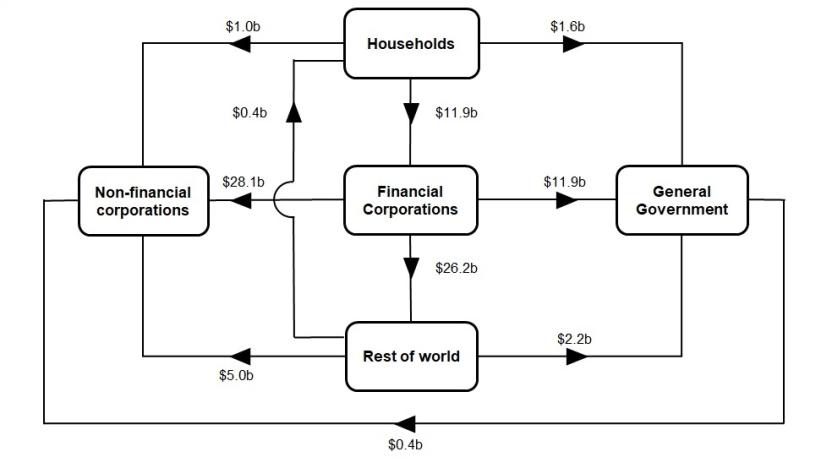
Net transactions during March quarter 2022

This is a flowchart that shows the intersectoral financial flows of net transactions during the March quarter 2022.
Financial corporations borrowed $11.9b from household. They lent $28.1b to non-financial corporation, $26.2b to rest of world and $11.9b to general government. Rest of the world lent $5.0b to non-financial corporations, $2.2b to general government and $0.4b to household. General government borrowed $1.6b from households. They lent $0.4b to non-financial corporations. Households lent $1.0b to non-financial corporations.

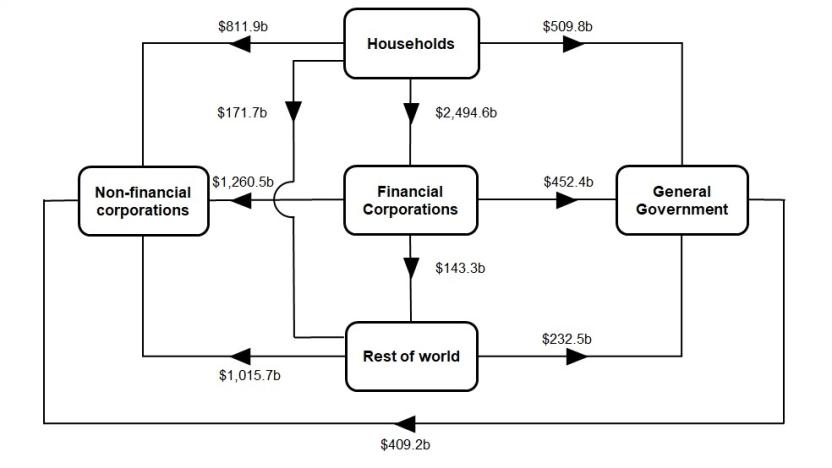
Amounts outstanding at end of March quarter 2022

This is a flowchart that shows the intersectoral financial flows of amounts outstanding at the end of the March quarter 2022.
Net claims on non-financial corporations were $1,260.5b from financial corporations, $811.9b from households, $1,015.7b from rest of world and $409.2b from general government. Net claims on general government were $452.4b from financial corporations, $232.5b from rest of world and $509.8b from households. Net claims on rest of world were $143.3b from financial corporations and $171.7b from households. Net claims on financial corporations were $2,494.6b from households.

National investment

National investment decreased $14.9b to $125.1b in the March quarter.

  • General government investment decreased by $0.2b to $22.4b driven by a decrease in gross fixed capital formation in both state and local general government and national general government. This was partially offset by an increase in acquisitions less disposals of non-produced non-financial assets.
  • Non-financial corporations' investment decreased by $8.3b to $55.5b, driven by decreases in gross fixed capital formation and acquisitions less disposals of non-produced non-financial assets.
  • Household investment decreased by $6.1b to $44.3b, driven by decreases in gross fixed capital formation and changes in inventories.

Financial investment

Australia was a net lender of $2.7b to rest of world (ROW). The main contributors were a: 

  • $119.6b acquisition of ROW equity assets, driven by other private non-financial corporations (OPNFCs)
  • offset by $120.5b of OPNFC-issued equity held by ROW

Heightened levels of equity issuance during the quarter was dominated by a corporate restructure, which resulted in investor funds from ROW repatriated to the Australian stock market (ASX) and the corporation acquiring significant amounts of ROW equity assets. Other merger and acquisition activity by OPNFCs contributed to Australia's net acquisition of ROW equity assets.

Households

Households' $7.8b net lending position was due to a $52.4b acquisition of financial assets, partly offset by a $44.5b incurrence of liabilities.
The acquisition of assets was driven by: 

  • $35.4b in deposits
  • $28.2b in net equity in pension funds

While liabilities were driven by:

  • $41.9b in loan borrowings

Deposits assets continued to grow, though at a reduced pace as spending continued to increase following the easing of COVID-19 restrictions. Acquisition of net equity in pension funds reflected continued growth in employment. Decreased activity in the property market in the early months of the new year and repayments made on outstanding credit card balances following the holiday spending period contributed to lower demand for loan borrowings by households this quarter. 

Non-financial corporations

Non-financial corporations' $45.1b net borrowing position was due to a $119.4b acquisition of financial assets, offset by $164.5b incurrence of liabilities. Liabilities were driven by: 

  • $135.4b in equity raising
  • $17.4b in loan borrowing

The significant corporate restructure during the quarter was reflected in non-financial corporations raising equity. Loan borrowing by private non-financial corporations continued to strengthen as economic activity increased due to a positive economic outlook over the quarter.

General government

General government's $5.9b net borrowing position was due to a $19.7b incurrence of liabilities partly offset by a $13.8b acquisition of assets. Liabilities were driven by:

  • $23.1b net issuance of bonds

The Commonwealth government continued to undertake steady issuance of bonds over the quarter, with funds raised assisting government support measures relating to floods in south-east Queensland and northern NSW, as well as support relating to the Omicron variant. Level of net issuance of bonds was higher than the previous quarter due to a minimal amount of bond maturities during the quarter.
Demand for credit

Demand for credit table

Demand for credit non-financial domestic sectors, $b
  Credit market outstandings,
Dec-21
Demand for credit,
Mar-22
Other changes,
Mar-22
Credit market outstandings,
Mar-22
Non-financial corporations    
 Investment funds 551.68.9-12.4548.1
 Other private 4,095.4153.210.84,259.5
 Public 160.0-2.7-4.4152.9
General government    
 National 921.218.0-58.5880.6
 State and local 327.9-0.4-17.0310.5
Households2,595.441.9-0.82,636.5
Total8,651.7218.8-82.48,788.0

- nil or rounded to zero


Demand for credit was $218.8b in the March quarter, of which:

  • other private non-financial corporations borrowed $153.2b
  • households borrowed $41.9b
  • general government borrowed $17.5b

Credit market outstanding grew $136.3b (1.6%) of which $82.4b was revaluation losses. Bond yields rose as increased inflationary pressures emerged which drove holding losses on Commonwealth government bonds of $58.5b. This was partly offset by holding gains on the equity of other private non-financial corporations of $26.4b as the domestic share market outperformed its overseas counterparts due to its greater composition of resource companies which benefitted from rising commodity prices.

The credit market aggregates were dominated by the impacts of large transactions resulting from a corporate restructure this quarter. A large corporate group transferred its dual overseas listing to the Australian Securities Exchange. The transfer has been treated as a transaction in these statistics in accordance with treatments of similar restructuring activity in the past. The treatment is also consistent with the treatment in the balance of payments and international investment position statistics.

Private non-financial corporations

Private non-financial corporations demand for credit was the highest on record mainly driven by a corporate restructure which was captured in equity raising. Reinvested earnings also contributed to strength in equity capital investment by non-residents. Strong export revenue on energy and mineral resources drove large operating surpluses for some foreign owned companies which were predominantly retained and reinvested by these businesses. Business credit was the strongest since March quarter 2020 driven by loan borrowing from Authorised deposit taking institutions which reflects improvements in economic conditions as businesses looked past Omicron variant of COVID-19 disruptions towards a favourable future operating environment. Funds of other private non-financial corporations were sourced through:

  • equity raising of $128.6b
  • loan borrowings of $16.8b

Households

Household credit growth remained strong this quarter as elevated housing market activity continued to drive demand for new housing loans from both owner-occupiers and investors. This was partly offset by repayment of short term loans coming off seasonally stronger December quarter consumer spending. This was reflected in:

  • $42.9b of long term loan borrowings
  • $936m repayment of short term loans

General government

The pace of debt issuance by the Australian Office of Financial Management has slowed following two years of extraordinary growth in government debt to fund fiscal support measures during the pandemic. This quarter net issuance of Australian government securities was used to finance social assistance payments made during the Omicron outbreak and provide relief to the flood-affected regions in northern NSW and south-east Queensland. The government financed its activity through:

  • $21.3b bond issuance by national general government
  • partly offset by maturities of Treasury notes of $5.8b

Households

Balance sheet

Household balance sheet, $b
  Amounts outstanding,
Dec-21
Transactions,
Mar-22
Other changes (a),
Mar-22
Holding gains/losses,
Mar-22
Amounts outstanding,
Mar-22
Non-financial assets     
 Land and dwellings 9,958.89.57.2201.310,176.8
 Other non-financial assets 718.61.7-6.8727.1
Financial assets     
 Superannuation reserves 3,700.228.2--76.83,651.6
 Shares and other equity 1,219.4-4.4-18.41,233.4
 Currency and deposits 1,465.135.2--1.21,499.1
 Other financial assets 388.5-6.6--2.8379.2
Liabilities     
 Loans 2,590.341.9--0.82,631.5
 Other liabilities 142.12.6--144.7
Wealth (Net worth)14,718.119.07.2146.614,890.9
Memorandum item     
 Consumer durables (b) 470.74.7--478.9

- nil or rounded to zero
(a) Not all other changes in volume are separately identifiable. Some have been shown as holding gains.
(b) Consumer durables are not included in net worth.

Financial assets

Household selected financial assets, $b
 Transactions,
Sep-21
Amounts outstanding,
Sep-21
Transactions,
Dec-21
Amounts outstanding,
Dec-21
Transactions,
Mar-22
Amounts outstanding,
Mar-22
Total assets 108.06,602.685.06,773.252.46,763.2
Deposits 71.71,369.246.01,415.235.41,449.4
Shares and equity 0.41,199.12.91,219.4-4.41,233.4
Net equity in reserves 26.03,191.424.43,286.325.33,237.9
 Pension funds 23.03,039.127.53,133.225.13,087.5
Other assets 9.9842.911.7852.3-3.9842.5

Liabilities

Household selected liabilities, $b
 Transactions,
Sep-21
Amounts outstanding,
Sep-21
Transactions,
Dec-21
Amounts outstanding,
Dec-21
Transactions,
Mar-22
Amounts outstanding,
Mar-22
Total liabilities 50.22,674.357.22,732.744.52,776.5
Short term loans -4.157.91.559.5-0.958.5
Long term loans 50.72,477.252.52,530.942.92,572.9
Other liabilities 3.6139.23.2142.32.6145.0

Household wealth rose 1.2% ($172.8b) to a record $14,890.9b at the end of the March quarter, however this was the lowest growth since March quarter 2020. Household wealth was driven by continued strength in the housing market and offset by revaluation losses in superannuation assets.

Wealth per capita increased 0.6% ($3,695) to $574,807 per person.

Non-financial assets

Non-financial assets owned by households increased 2.1% ($226.5b), driven by a:

  • $210.4b rise in residential land and dwellings

Holding gains on residential land and dwellings reflected the continued growth in property prices due to low interest rates and increased market activity.

Financial assets

Financial assets of households fell 0.1% (-$10.0b), driven by a:

  • $48.6b fall in superannuation reserves, offset by
  • $34.2b rise in deposits
  • $14.0b rise in shares and other equity

Revaluations drove the decrease in superannuation reserves reflective of the negative performance of overseas share markets. Poor performance of the overseas markets came through both their direct investment and through their investment in non-money market funds. Transactions in superannuation ($28.2b) offset revaluation losses reflecting continued employment growth.

Growth in deposits was stable in the months of January and February, however, stronger savings were made in the month of March due to falls in consumer confidence. Shares and other equity increased, reflective of valuation changes in other private non-financial corporations, including in households incorporated businesses.

Liabilities

Household liabilities increased 1.6% ($43.8b), driven by a:

  • $33.7b rise in housing loans, offset by
  • $0.9b fall in short term loans

The growth in housing loans reflects the increased activity in the property market as housing stock levels increased and auction clearance rates remained high. The rise was mainly driven by owner-occupied loans, which increased $24.1b. Investor loans also contributed $9.6b to the rise, recording a fourth consecutive increase.

Lower levels of retail spending compared to December quarter contributed to the decrease in short term loans.

Private non-financial corporations

Financial assets

Private non-financial corporations' selected financial assets, $b
 Transactions,
Sep-21
Amounts outstanding,
Sep-21
Transactions,
Dec-21
Amounts outstanding,
Dec-21
Transactions,
Mar-22
Amounts outstanding,
Mar-22
Total assets35.31,823.533.21,888.7119.42,011.1
Deposits2.1755.411.6766.412.1775.5
Shares and equity19.8639.325.3686.2103.9784.7
Other accounts receivable6.8219.0-4.9224.9-2.5231.0
Other assets6.6209.91.2211.26.0219.9

Liabilities

Private non-financial corporations' selected liabilities, $b
  Transactions,
Sep-21
Amounts outstanding,
Sep-21
Transactions,
Dec-21
Amounts outstanding,
Dec-21
Transactions,
Mar-22
Amounts outstanding,
Mar-22
Total liabilities 59.74,738.539.64,861.9164.95,015.3
Total debt securities -4.8295.51.1289.76.2278.0
Loans 16.7936.50.9934.519.8954.0
  Authorised deposit taking institutions 13.4596.220.0615.627.4641.2
 Rest of world 0.6245.8-17.2226.3-1.0226.9
Shares and equity 42.03,247.838.93,381.1135.53,532.5
 Households 1.7781.15.0800.81.1811.6
 Rest of world 34.31,207.525.31,254.6113.71,369.3
Other liabilities 5.8258.8-1.3256.53.5250.8

Private non-financial corporations demand for credit of $164.9b, was driven by:

  • $135,4b raising of equity,
  • $19.8b borrowing of loans, and
  • $7.0b issuance of debt securities

Private non-financial corporations strongly favoured the raising of equity over the incurrence of debt in order to source funds. This was supported by a significant corporate restructure during the quarter, and the continued strength of reinvested earnings. This resulted in:

  • debt to equity ratio (adjusted for price changes) decreasing to 0.61

Demand for loan borrowings was its strongest since March 2020 quarter, reflecting businesses looking past the impacts of the Omicron variant and towards favourable future operating conditions. Despite this, the significant amount of equity issued by private non-financial corporations this quarter has outweighed the stronger demand for loan borrowings, resulting in the decrease in the debt to equity ratio (both adjusted and unadjusted for price changes). The debt to equity ratio (adjusted for price) is now at its lowest level since December 2004.

Financial corporations

Financial assets and liabilities

Financial corporations' financial assets, $b
 Amounts outstanding,
Dec-21
Transactions,
Mar-22
Other changes,
Mar-22
Amounts outstanding,
Mar-22
Central bank678.420.1-25.5673.1
Authorised deposit taking institutions4,550.728.0125.74,704.3
Other broad money institutions178.68.5-1.9185.2
Pension funds2,941.525.0-76.62,889.9
Life insurance corporations190.30.2-2.9187.5
Non-life insurance corporations271.33.9-7.4267.8
Money market investment funds36.9-2.0-0.134.8
Non-money market investment funds1,187.29.7-29.81,167.2
Central borrowing authorities556.9-7.2-23.6526.1
Securitisers717.881.0-0.1798.7
Other financial corporations110.0-20.023.7113.6

- nil or rounded to zero

Financial corporations' liabilities, $b
 Amounts outstanding,
Dec-21
Transactions,
Mar-22
Other changes,
Mar-22
Amounts outstanding,
Mar-22
Central bank680.119.5-25.1674.5
Authorised deposit taking institutions4,753.511.8149.34,914.6
Other broad money institutions161.30.8-8.7153.4
Pension funds3,184.922.5-70.33,137.1
Life insurance corporations187.20.6-2.8185.0
Non-life insurance corporations282.7-5.61.3278.4
Money market investment funds36.9-0.7-1.534.8
Non-money market investment funds1,348.0-6.8-44.51,296.6
Central borrowing authorities531.0-1.1-23.6506.2
Securitisers744.781.1-2.1823.7
Other financial corporations215.3-21.019.2213.6

Authorised deposit-taking institutions (ADIs)

Financial assets

Authorised deposit taking institutions' selected financial assets, $b
  Transactions,
Sep-21
Amounts outstanding,
Sep-21
Transactions,
Dec-21
Amounts outstanding,
Dec-21
Transactions,
Mar-22
Amounts outstanding,
Mar-22
Total assets 60.24,429.276.74,550.728.04,704.3
Deposits 55.0468.234.3502.417.3519.0
Bonds 15.0714.120.0722.977.8780.3
 Securitisers 31.1346.024.9369.778.7448.0
 National general government -6.5104.3-14.188.4-9.973.4
Loans 64.02,661.887.12,746.8-2.72,736.5
Other assets -73.8585.0-64.6578.6-64.5668.5

Liabilities

Authorised deposit taking institutions' selected liabilities, $b
  Transactions,
Sep-21
Amounts outstanding,
Sep-21
Transactions,
Dec-21
Amounts outstanding,
Dec-21
Transactions,
Mar-22
Amounts outstanding,
Mar-22
Total liabilities36.84,654.457.84,753.511.84,914.6
Deposits83.72,796.972.92,867.855.92,915.3
 Other private non-fin corps2.1700.310.3710.19.9717.7
 Pension funds-7.8231.9-4.3227.51.7229.0
 Households71.81,347.845.61,393.334.81,427.7
Bonds-13.3445.09.1445.625.3442.4
Shares and equities0.3641.2-4.9623.7-7.0644.1
Other liabilities-33.9771.2-19.3816.4-62.5912.8

ADIs continued to sell bonds issued by the national general government to the Reserve Bank of Australia (RBA), although at a subdued rate, reflecting the RBA’s Bond Purchase Program (BPP) ending on the 10th of February 2022. This was reflected by the slowest growth of ADI deposits with the central bank since September 2020, with the BPP beginning in December quarter 2020. This resulted in a:

  • $10.1b acquisition of deposits accepted by the central bank
  • $9.9b sell off of bonds issued by the national general government

ADIs increased their holdings of securitiser issued bonds in line with Australian Prudential Regulation Authority (APRA) guidelines that stated they must maintain contingent liquidity through securitised assets on an ongoing basis of at least 30% of their net cash outflows. This resulted in a:

  • $78.7b acquisition of bonds issued by securitisers
  • $10.3b decrease in loan assets held by ADIs

ADI's share of funding from derivatives increased this quarter, reflecting strong derivative revaluations as a result of global market volatility.

In the March quarter, ADIs' funding composition compared to the previous quarter comprised of:

  • 62.0% from deposits, a decrease from 63.0%
  • 13.7% from equities, remaining steady
  • 9.4% from bonds, a decrease from 9.8%
  • 8.6% from derivatives, an increase from 6.8%
  • 7.6% from short term debt securities, a decrease from 8.1%

ADIs' funding from deposits grew $55.9b with a:

  • $34.8b increase from households
  • $9.9b increase from other private non-financial corporations

Pension (superannuation) funds

Financial assets

Pension (superannuation) funds' selected financial assets, $b
  Transactions,
Sep-21
Amounts outstanding,
Sep-21
Transactions,
Dec-21
Amounts outstanding,
Dec-21
Transactions,
Mar-22
Amounts outstanding,
Mar-22
Total assets18.12,863.919.22,941.525.02,889.9
Deposits-9.3243.1-4.9238.12.7240.2
Bonds-3.2118.1-3.4110.16.4107.3
Shares and equity38.12,370.730.82,461.610.82,389.5
 Other private non-fin corps-0.1396.512.0427.612.4444.4
 Non-money market investment funds7.1985.9-10.8996.9-8.2953.9
 Rest of world28.2506.823.2544.16.7500.1
Net equity in life offices-0.517.4-1.816.0-0.215.5
Other assets-7.0114.5-1.5115.75.2137.3

Liabilities

Pension (superannuation) funds' selected liabilities, $b
  Transactions,
Sep-21
Amounts outstanding,
Sep-21
Transactions,
Dec-21
Amounts outstanding,
Dec-21
Transactions,
Mar-22
Amounts outstanding,
Mar-22
Total liabilities20.43,097.423.23,184.922.53,137.1
Net equity in reserves23.23,043.327.73,138.025.23,092.1
 Households23.03,039.127.53,133.225.13,087.5
Other liabilities-2.854.0-4.546.9-2.745.0

Total financial assets of pension (superannuation) funds decreased 1.8%(-$51.6b), with a:

  • $72.1b decrease in shares and other equity
  • and $2.8b decrease in bonds

Unfavourable conditions in the overseas markets drove valuation losses of $76.6b due to heightened uncertainty arising from increased inflation expectations and the war in Ukraine. Pension funds invested $10.8b in shares and other equity, particularly in other private financial corporations, rest of world and private non-financial investment funds. The investment in overseas shares ($6.7b) was subdued compared to recent quarters and was the lowest since June quarter 2020. Pension funds also acquired $6.4b in bonds while increased bond yields drove valuation losses of $9.2b in these assets.

Government

National general government financial assets

National general government selected financial assets, $b
  Transactions,
Sep-21
Amounts outstanding,
Sep-21
Transactions,
Dec-21
Amounts outstanding,
Dec-21
Transactions,
Mar-22
Amounts outstanding,
Mar-22
Total assets9.8680.73.6680.816.1669.4
Deposits3.891.37.398.53.5101.7
 Central bank1.463.06.969.8-1.968.0
 Authorised deposit taking institutions1.621.60.421.94.126.0
One name paper0.945.71.146.4-2.443.0
Shares and equity-0.2207.3-0.7201.92.1175.0
Other assets5.3336.5-4.1333.912.9349.8

National general government liabilities

National general government selected liabilities, $b
  Transactions,
Sep-21
Amounts outstanding,
Sep-21
Transactions,
Dec-21
Amounts outstanding,
Dec-21
Transactions,
Mar-22
Amounts outstanding,
Mar-22
Total liabilities39.61,414.218.21,412.020.01,375.4
One name paper1.528.86.134.9-5.929.0
Bonds25.4898.410.2887.021.3849.7
 Central bank51.2261.625.9282.217.4281.8
 Authorised deposit taking institutions-6.5104.3-14.188.4-9.973.4
 Rest of world-15.5419.0-7.1399.216.6386.6
Other liabilities12.6487.01.9490.14.5496.6

State and local general government financial assets

State and local general government selected financial assets, $b
  Transactions,
Sep-21
Amounts outstanding,
Sep-21
Transactions,
Dec-21
Amounts outstanding,
Dec-21
Transactions,
Mar-22
Amounts outstanding,
Mar-22
Total assets7.3594.0-4.6594.1-2.2596.2
Deposits6.387.91.789.70.189.8
Loans and placements-0.660.34.064.3-1.962.4
Shares and equity0.0413.9-11.1407.90.0412.8
 State and local PNFCs0.0324.30.0328.00.0333.1
 Other private non-fin corps0.349.8-11.239.0-0.338.7
Other assets1.631.90.732.4-0.431.2

- nil or rounded to zero

State and local general government liabilities

State and local general government selected liabilities, $b
  Transactions,
Sep-21
Amounts outstanding,
Sep-21
Transactions,
Dec-21
Amounts outstanding,
Dec-21
Transactions,
Mar-22
Amounts outstanding,
Mar-22
Total liabilities24.9542.44.5544.3-0.2521.1
Loans and placements22.2320.11.3321.5-1.5303.4
 Central borrowing authorities23.1296.73.0299.7-2.4280.8
Unfunded superannuation claims0.9148.41.0147.10.9142.0
Other liabilities1.873.82.275.80.475.7

General government

Total bond liability of general government (national, and state and local) decreased $35.9b, driven by

  • $59.1b negative revaluations, partly offset by
  • $23.1b transactions

The total value of government bonds outstanding was $857.3b displaying a downward trend in value due to significant rise in bond yields, reflecting rising inflationary expectations. Net issuance of government bonds continued as government provided support during the Omicron outbreak and the floods in northern NSW and south-east Queensland.

Capital investment

Figures in the capital investment section are in seasonally adjusted current prices.

Net lending (+) / borrowing (-)

Australia's net lending position decreased by $5.8b to $7.3b this quarter. This was driven by a: 

  • $6.0b build up of inventories
  • $3.9b increase in gross fixed capital formation

Partially offset by a:

  • $3.4b increase in national net saving

National net lending as a proportion of GDP decreased this quarter driven by a build up of inventories and increased gross fixed capital formation.

  • Households' net lending decreased by $8.3b to $23.8b
  • Financial corporations' net lending decreased by $2.8b to $4.8b
  • General government net borrowing decreased by $7.8b to $20.8b
  • Non-financial corporations' net borrowing increased by $2.6b, to a net lending position of $1.6b

Notable drivers were: 

  • Households' net lending was driven by a decrease in net saving as household consumption growth outpaced gross disposable income.
  • Financial corporations' net lending was driven by a decrease in net saving due to an increase in non-life insurance claims payable related to natural disasters during the quarter.
  • General governments' net borrowing was driven by an increase in net savings due to an increase in income tax receivable, and a decrease in income payable in social assistance benefits in cash to residents and subsidies as COVID-19 support was wound back.
  • Non-financial corporations net lending was driven by an increase in net savings due to an increase in mining gross operating surplus, reflecting strong growth in commodity prices.

Capital Investment

National capital investment decreased to 22.7% as a proportion of GDP:

Relative to GDP:

  • Non-financial corporations' investment decreased to 9.9%
  • Household investment was flat 8.3%
  • Financial corporations' investment was flat at 0.5%
  • General government investment was flat at 4.0%

While national capital investment fell as a proportion of GDP, it increased 3.1% in current price seasonally adjusted terms.

In current price seasonally adjusted terms:

  • Non-financial corporations' investment increased, driven by increased investment in new machinery and equipment.
  • General government investment increased, driven by an increase in both national and state and local general government.

Data downloads

Time series spreadsheets

Data files

Previous catalogue number

This release previously used catalogue number 5232.0

Revisions and changes

Revisions in this issue

There have been revisions to previously published aggregates due to:

  • Quality assurance reviews affecting the published aggregates after March quarter 2020, in addition to amendments to data collected in the ABS Survey of Financial Information, ABS Survey of International Investment and to data derived from Australian Prudential Regulation Authority (APRA) administrative data sets.
  • Revisions to the sectoral capital accounts are due to more up-to-date data being incorporated and concurrent seasonal adjustment.
     
Back to top of the page