Australian National Accounts: Finance and Wealth

This is not the latest release View the latest release

National, public and private corporations, government and household financial and capital accounts, and household balance sheets.

Reference period
June 2021
Released
23/09/2021

Key statistics

  • Household wealth rose $735.0b (5.8%) to a record $13,433.7b
  • Demand for credit was $78.6b, an increase of $25.5b
  • Australia's net lending position increased $9.6b to $24.2b
  • Capital investment as a proportion of GDP rose to 22.8%

Main features

Financing resources and investment table

Financing resources and investment June quarter 2021, original, current prices, $b
    Non-financial corps Financial corps Government Households Total national Rest of world
Financing resources      
 Net saving (a) 27.90.43.514.846.6-26.3
 plus Consumption of fixed capital 45.23.211.731.992.1-
 Gross saving 73.13.615.246.7138.7-26.3
 plus Net capital transfers 0.60.6-3.62.2-0.20.2
 less Statistical discrepancy (b) -----18.9-
 Total financing resources 73.74.211.648.9157.4-26.1
Uses of financing (investment)      
 Capital formation      
  Gross fixed capital formation 55.23.027.946.1132.2-
  plus Changes in inventories -0.10.00.2-1.0-1.0-
  plus Net acquisition of non-produced non-financial assets -0.3-0.3---
  Total capital formation 54.73.028.445.1131.2-
 plus Financial investment      
  Acquisition of financial assets 51.978.08.161.526.42.2
  less Incurrence of financial liabilities 29.580.220.145.52.226.4
  Net Financial investment (Net lending (+) / net borrowing (-)) 22.4-2.2-12.016.024.2-24.2
 less Net errors and omissions3.5-3.44.812.1-1.91.9
 Total investment73.74.211.648.9157.4-26.1

- nil or rounded to zero
(a) Net saving for the rest of world is the balance on the external income account.
(b) The statistical discrepancy is not able to be distributed among the sectors.

Financial market summary table

Financial market summary, $b
  Amounts outstanding,
Mar-21
Transactions,
Jun-21
Other changes,
Jun-21
Amounts outstanding,
Jun-21
Currency and deposits    
  Currency 101.0-1.3-99.7
  Transferable deposits 1,736.9218.91.31,957.1
  Other deposits 1,365.8-27.74.01,342.0
Short term debt securities    
  Bills of exchange 11.9-1.1-10.7
  One name paper 445.61.42.0449.1
Long term debt securities    
  Bonds, etc.3,114.723.923.63,162.2
Derivatives    
  Derivatives 718.8-56.025.1687.9
Loans and placements    
  Short term 378.10.50.9379.5
  Long term 4,098.159.51.54,159.1
Shares and other equity    
  Listed 2,326.31.2196.32,523.8
  Unlisted 5,154.562.9143.95,361.4
Insurance technical reserves    
  Reserves of pension funds and life 2,942.432.4139.83,114.5
  General insurance payments 138.38.40.0146.7

- nil or rounded to zero 

Flow of funds diagrams

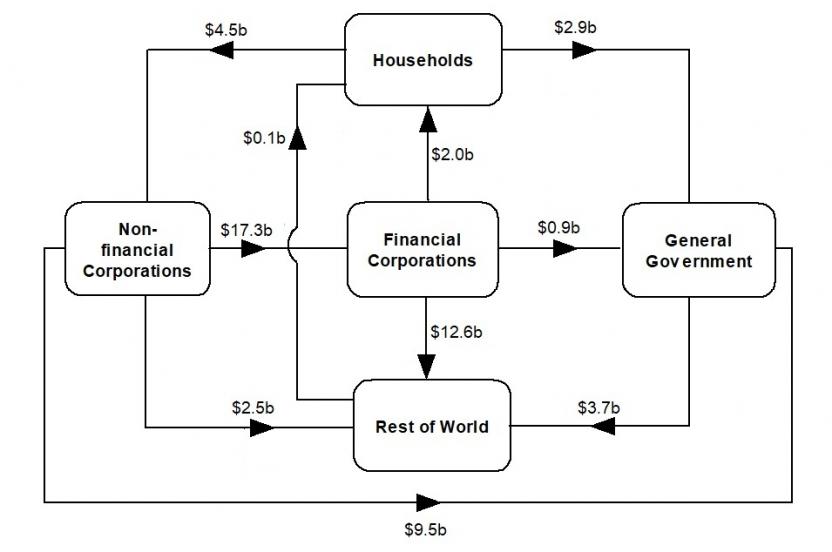
Net transactions during June quarter 2021

This is a flowchart that shows the intersectoral financial flows of net transactions during the June quarter 2021.
Financial corporations borrowed $17.3 from non-financial corporations. They lent $0.9b to general government, $2.0b to households and $12.6b to rest of world. Rest of the world borrowed $2.5b from non-financial corporations and $3.7b from general government. They lent $0.1b to households. General government borrowed $9.5b from non-financial corporations and $2.9b from households. Households lent $4.5b to non-financial corporations.

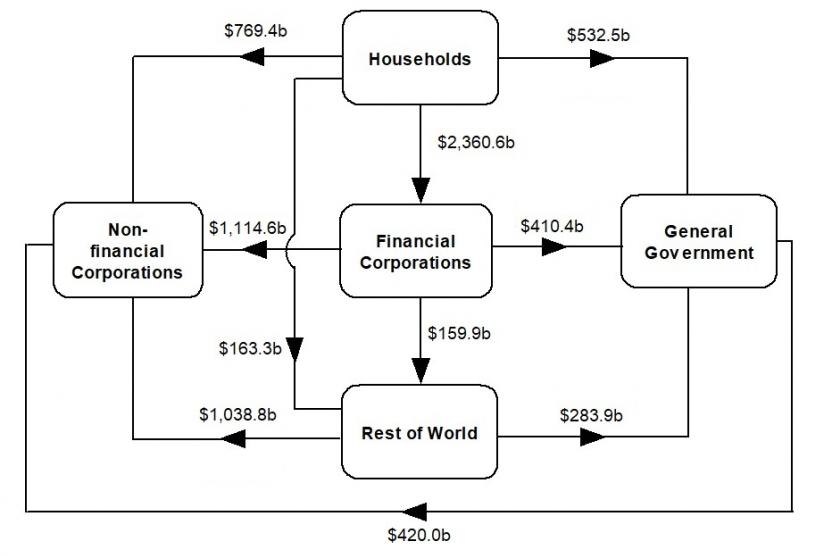
Amounts outstanding at end of June quarter 2021

This is a flowchart that shows the intersectoral financial flows of amounts outstanding at the end of the June quarter 2021.
Net claims of non-financial corporations were $1,114.6b from financial corporations, $769.4b from households, $1,038.8b from rest of world and $420.0b from general government. Net claims of general government were $410.4b from financial corporations, $283.9b from rest of world and $532.5b from households. Net claims of rest of world were $159.9b from financial corporations and $163.3b from households. Net claims of financial corporations were $2,360.6b from households.

National investment

National investment grew $23.0b to $131.2b in the June quarter.

  • General government investment increased by $7.6b to $28.4b driven by an increase in gross fixed capital formation in both national and state and local general government.
  • Non-financial corporations' investment increased by $9.3b to $54.7b driven by an increase in gross fixed capital formation in both public and private non-financial corporations.
  • Household investment increased by $5.7b to $45.1b driven by an increase in gross fixed capital formation.

Financial investment

Australia was a net lender of $24.2b, the ninth consecutive quarter of net lending. The main contributors were a: 

  • $36.9b acquisition in rest of world (ROW) equities, driven by pension funds, other private non-financial corporations (OPNFC) and non-money market funds
  • offset by $7.7b maturities of general government short term debt securities held by ROW

Pension funds, OPNFC and non-money market funds continued to invest in overseas markets as economic conditions continued to improve. Continued maturities of treasury notes decreased the general government's liability with ROW investors.

Households

Households' $16.0b net lending position was due to a $61.5b acquisition of assets, offset by a $45.5b incurrence of liabilities, 
The acquisition of assets was lead by: 

  • $29.4b in net equity in pension funds

While liabilities were driven by:

  • $45.1b in loan borrowings

Net equity acquisition in pension funds was due to continued improvement in the labour market. Increased activity in the property market and the low interest rate environment saw strength in demand for housing loans by owner-occupiers and investors.

Non-financial corporations

Non-financial corporations' $22.4b net lending position was due to a $51.9b acquisition of financial assets offset by $29.5b incurrence of liabilities. The acquisition in assets was driven by: 

  • $38.9b in deposits

While liabilities were driven by:

  • $17.9b in equity raising

 Deposits increased as non-financial corporations continued to save. Businesses sought to raise funds through equities markets driven by high investor demand.

General government

General government's $12.0b net borrowing position was due to a $8.1b acquisition in assets offset by $20.1b incurrence of liabilities. Liabilities were driven by:

  • $7.4b in loan borrowings
  • $7.1b net issuance of bonds

The loan borrowings was in line with growth in public investment by state and local general government. Bond issuance by the national general government stabilised over the quarter as the Commonwealth government completed it's funding task for the 2020-21 financial year.
Demand for credit

Demand for credit table

Demand for credit non-financial domestic sectors, $b
  Credit market outstandings,
Mar-21
Demand for credit,
Jun-21
Other changes,
Jun-21
Credit market outstandings,
Jun-21
Non-financial corporations    
 Investment funds 466.26.522.8495.5
 Other private 3,839.413.3118.43,971.0
 Public 146.05.30.0151.3
General government    
 National 889.9-0.39.8899.5
 State and local 295.18.70.0303.9
Households2,444.945.11.82,491.8
Total8,081.578.6152.88,312.9

- nil or rounded to zero


Demand for credit was $78.6b in the June quarter, of which:

  • households borrowed $45.1b
  • other private non-financial corporations borrowed $13.3b
  • general government borrowed $8.5b

Credit market outstanding grew $231.4b (2.9%) of which $152.8b was revaluation gains. The stock market drove $138.3b of revaluation gains in shares of private non-financial corporations.

Households

Household demand for credit was the strongest since June quarter 2007, driven by demand for new housing loans amid heightened housing market activity. Both owner-occupiers and investors contributed to housing credit growth. This was aided by borrowing by unincorporated businesses who took advantage of record low interest rates and government tax incentives for investment. This was reflected in:

  • $45.6b of long term loan borrowings
  • partly offset by $469m repayment of short term loans

Private non-financial corporations

Businesses continued to favour equity raising attracting funds particularly from non-resident investors. Modest loan borrowing reflected limited immediate need for debt funding as favourable operating conditions in the first half of 2021 and recent policy support have largely preserved business cash buffers. Funds of other private non-financial corporations were acquired through:

  • equity raising of $13.3b
  • loan borrowings of $1.3b

General government

The Commonwealth government's funding requirements fell as pandemic-related support payments drew to a close in March and debt issuance stabilised following extraordinary growth in 2020. State governments raised funds through respective central borrowing authorities for increased health spending and ongoing public infrastructure projects. This was seen in:

  • $7.7b in loan borrowings by state and local general governments
  • $6.2b bond issuance by national general government

Households

Balance sheet

Household balance sheet, $b
  Amounts outstanding,
Mar-21
Transactions,
Jun-21
Other changes (a),
Jun-21
Holding gains/losses,
Jun-21
Amounts outstanding,
Jun-21
Non-financial assets     
 Land and dwellings 8,366.310.85.7560.08,942.7
 Other non-financial assets 666.92.4--2.6666.6
Financial assets     
 Superannuation reserves 3,418.133.4-107.43,558.9
 Shares and other equity 1,146.34.1-29.91,180.3
 Currency and deposits 1,336.85.2-0.61,342.6
 Other financial assets 339.818.8-6.6365.3
Liabilities     
 Loans 2,439.445.1-1.82,486.3
 Other liabilities 136.10.4--136.4
Wealth (Net worth)12,698.729.15.7700.213,433.7
Memorandum item     
 Consumer durables (b) 422.15.9--425.5

- nil or rounded to zero
(a) Not all other changes in volume are separately identifiable. Some have been shown as holding gains.
(b) Consumer durables are not included in net worth.

Financial assets

Household selected financial assets, $b
 Transactions,
Dec-20
Amounts outstanding,
Dec-20
Transactions,
Mar-21
Amounts outstanding,
Mar-21
Transactions,
Jun-21
Amounts outstanding,
Jun-21
Total assets 66.66,129.134.66,241.061.56,447.0
Deposits 27.91,274.615.51,290.25.31,296.1
Shares and equity 8.01,117.81.91,146.34.11,180.3
Net equity in reserves 23.62,871.916.52,948.232.63,121.0
 Pension funds 20.02,732.819.32,810.929.42,974.0
Other assets 7.0864.90.6856.319.6849.6

Liabilities

Household selected liabilities, $b
 Transactions,
Dec-20
Amounts outstanding,
Dec-20
Transactions,
Mar-21
Amounts outstanding,
Mar-21
Transactions,
Jun-21
Amounts outstanding,
Jun-21
Total liabilities 27.82,545.529.42,575.545.52,622.7
Short term loans 1.063.9-1.362.6-0.562.1
Long term loans 22.22,348.627.62,376.845.62,424.2
Other liabilities 4.6133.03.1136.10.4136.4

Household wealth rose 5.8% ($735.0b) to a record $13,433.7b at the end of the June quarter. This is the largest quarterly growth since December 2009, which was the peak of the recovery from the global financial crisis. Household wealth was driven by continued strength in the housing market and holding gains in financial assets.

Wealth per capita increased 5.6%($27,782) to $522,032 per person.

Non-financial assets

Non-financial assets owned by households increased 6.4% ($782.2b), driven by a:

  • $576.5b rise in land and dwellings

Holding gains on land and dwellings reflected the sustained growth in property prices due to increasing housing market activity over the June quarter. Demand for property remains strong due to:

  • record low interest rates;
  • recovery in the labour market; and
  • rising consumer confidence.

Buyer demand was greater than the levels of stock on the market and maintained upward pressure on residential property prices.

Financial assets

Financial assets of households rose 3.3% ($206.1b), driven by:

  • $140.8b rise in superannuation reserves
  • $34.0b rise in shares and other equity

Growth in these assets was driven by revaluation gains, reflecting the positive performance of domestic and overseas share markets.

Transactions in superannuation ($29.4b) also contributed to the increase, reflecting continued employment growth over the quarter as economic conditions improved.

Liabilities

Household liabilities increased 1.8% ($47.2b), driven by: 

  • $38.0b rise in housing loans
  • $8.7b rise in unincorporated business loans

Growth in housing loans reflects the continuation of increased activity in the property market and is the strongest quarterly rise since December quarter 2016. The rise was mainly driven by owner-occupier loans, which increased $31.9b. Investor loans also contributed $6.0b to the rise, recording a third consecutive quarter of positive growth. Growth in unincorporated business loans is consistent with improvements in economic conditions and government tax incentives for investment.

Private non-financial corporations

Financial assets

Private non-financial corporations' selected financial assets, $b
 Transactions,
Dec-20
Amounts outstanding,
Dec-20
Transactions,
Mar-21
Amounts outstanding,
Mar-21
Transactions,
Jun-21
Amounts outstanding,
Jun-21
Total assets37.21,677.618.51,703.851.61,795.4
Deposits10.2697.815.8713.837.8752.7
Shares and equity18.1574.49.0583.15.2619.0
Other accounts receivable9.5195.6-2.5202.67.2214.7
Other assets-0.6209.9-3.7204.31.3208.9

Liabilities

Private non-financial corporations' selected liabilities, $b
  Transactions,
Dec-20
Amounts outstanding,
Dec-20
Transactions,
Mar-21
Amounts outstanding,
Mar-21
Transactions,
Jun-21
Amounts outstanding,
Jun-21
Total liabilities 12.44,465.818.64,495.726.24,663.8
Total debt securities -15.0293.83.7294.0-1.9297.2
Loans -10.5913.79.1920.94.4922.9
 Authorised deposit taking institutions0.9570.75.4576.32.7580.0
 Rest of world -11.2254.72.1254.70.2251.6
Shares and equity 34.23,027.94.73,048.817.93,205.0
 Households 6.4736.62.9748.64.5769.1
 Rest of world 16.61,151.0-3.51,145.28.91,188.2
Other liabilities 3.8230.51.1231.95.9238.6

Private non-financial corporations increased their liabilities by $26.2b, driven by:

  • $17.9b raising of equity, and
  • $4.4b borrowing of loans, partly offset by 
  • $1.9b maturity of debt securities

Private non-financial corporations favoured equity raising over debt issuance, with increased investor demand for higher return assets such as equity, reflected by the strong performance of the domestic stock market. This resulted in:

  • debt to equity ratio (adjusted for price changes) remaining low at 0.66

The debt to equity ratio is at its lowest level since March 2005, as businesses have deleveraged to strengthen their balance sheet positions. Profitable business conditions in the first half of 2021 allowed businesses to continue to build substantial liquidity buffers, limiting their borrowing needs.

Financial corporations

Financial assets and liabilities

Financial corporations' financial assets, $b
 Amounts outstanding,
Mar-21
Transactions,
Jun-21
Other changes,
Jun-21
Amounts outstanding,
Jun-21
Central bank429.7159.54.1593.2
Authorised deposit taking institutions4,230.819.614.94,265.3
Other broad money institutions175.24.90.7180.8
Pension funds2,647.530.1133.52,811.0
Life insurance corporations179.81.16.9187.8
Non-life insurance corporations255.7-0.36.2261.6
Money market investment funds37.0-2.40.034.6
Non-money market investment funds1,097.417.734.31,149.4
Central borrowing authorities513.211.52.6527.3
Securitisers673.216.50.1689.8
Other financial corporations98.10.23.2101.5

- nil or rounded to zero

Financial corporations' liabilities, $b
 Amounts outstanding,
Mar-21
Transactions,
Jun-21
Other changes,
Jun-21
Amounts outstanding,
Jun-21
Central bank431.2163.42.4596.9
Authorised deposit taking institutions4,420.713.554.54,488.7
Other broad money institutions166.21.58.6176.2
Pension funds2,861.832.6140.03,034.3
Life insurance corporations176.32.15.6184.0
Non-life insurance corporations258.68.85.2272.6
Money market investment funds37.0-2.60.334.6
Non-money market investment funds1,239.013.457.01,309.4
Central borrowing authorities488.98.12.1499.0
Securitisers689.118.10.1707.3
Other financial corporations194.01.86.2202.0

Authorised deposit-taking institutions (ADIs)

Financial assets

Authorised deposit taking institutions' selected financial assets, $b
  Transactions,
Dec-20
Amounts outstanding,
Dec-20
Transactions,
Mar-21
Amounts outstanding,
Mar-21
Transactions,
Jun-21
Amounts outstanding,
Jun-21
Total assets -25.54,275.8-0.44,230.819.64,265.3
Deposits 49.9181.598.7280.1132.8413.1
Bonds -78.1926.7-79.5830.3-136.6694.4
 Securitisers -35.1451.9-43.9409.9-92.3315.7
 National general government -43.1179.3-34.3138.8-30.7110.5
Loans 33.82,509.459.02,566.823.72,592.8
Other assets -31.1658.3-78.6553.5-0.3565.0

Liabilities

Authorised deposit taking institutions' selected liabilities, $b
  Transactions,
Dec-20
Amounts outstanding,
Dec-20
Transactions,
Mar-21
Amounts outstanding,
Mar-21
Transactions,
Jun-21
Amounts outstanding,
Jun-21
Total liabilities-21.94,415.3-20.34,420.713.54,488.7
Deposits1.42,608.249.72,659.141.92,704.2
 Other private non-fin corps7.4654.815.3670.327.7698.9
 Pension funds-14.1235.7-1.8233.95.5239.6
 Households28.01,254.415.61,270.05.41,275.5
Bonds1.8476.0-19.7447.2-0.7452.5
Shares and equities2.1523.82.2584.20.3616.8
Other liabilities-27.3807.2-52.5730.1-28.0715.3

ADIs undertook repurchase agreements (repos) with the RBA and sold bonds in return for deposit assets as part of the RBA's Term Funding Facility and Bond Purchase Program. This resulted in a:

  • $92.3b of repos of bonds issued by securitisers
  • $30.7b sell off of bonds issued by national general government
  • $11.0b sell off and repos of bonds issued by central borrowing authorities
  • $132.6b acquisition in deposits accepted by the central bank

ADI’s share of funding from equities continued to increase after another strong quarter in the domestic share market.
In the June quarter, ADIs' funding compared to the previous quarter comprised of:

  • 14.5% from shares and other equity, an increase from 13.8% 
  • 63.4% from deposits, an increase from 62.9% 
  • 10.6% from bonds, unchanged compared to the previous quarter
  • 6.9% from short term debt securities, unchanged compared to the previous quarter


ADIs' funding from deposits rose $41.9b with a:

  • $29.5 increase from private non-financial corporations
  • $5.5b increase from pension funds
  • $5.4b increase from households

Pension (superannuation) funds

Financial assets

Pension (superannuation) funds' selected financial assets, $b
  Transactions,
Dec-20
Amounts outstanding,
Dec-20
Transactions,
Mar-21
Amounts outstanding,
Mar-21
Transactions,
Jun-21
Amounts outstanding,
Jun-21
Total assets18.02,574.820.62,647.530.12,811.0
Deposits-15.5246.3-1.3245.06.8252.1
Bonds6.0122.42.8119.6-0.5119.7
Shares and equity27.52,065.822.42,148.519.32,299.6
 Other private non-fin corps1.6360.50.6366.5-0.7396.4
 Non-money market investment funds14.2884.98.1916.04.0964.4
 Rest of world15.3401.112.0432.513.5474.1
Net equity in life offices-1.017.8-0.217.7-0.717.8
Other assets-17.9122.6-20.9116.6-13.3121.8

Liabilities

Pension (superannuation) funds' selected liabilities, $b
  Transactions,
Dec-20
Amounts outstanding,
Dec-20
Transactions,
Mar-21
Amounts outstanding,
Mar-21
Transactions,
Jun-21
Amounts outstanding,
Jun-21
Total liabilities18.52,782.119.42,861.832.63,034.3
Net equity in reserves20.22,736.119.52,814.629.62,978.0
 Households20.02,732.819.32,810.929.42,974.0
Other liabilities-1.746.0-0.147.23.056.3

Total financial assets of pension (superannuation) funds increased 6.2%($163.5b), with:

  • $151.1b increase in shares and other equity
  • $7.1b increase in deposits

Positive conditions in the domestic and overseas share markets drove valuation gains of $131.8b. Pension funds invested an additional $19.3b in shares and other equity, particularly in rest of world. Deposit levels increased for the first time since June quarter 2020.

Government

National general government financial assets

National general government selected financial assets, $b
  Transactions,
Dec-20
Amounts outstanding,
Dec-20
Transactions,
Mar-21
Amounts outstanding,
Mar-21
Transactions,
Jun-21
Amounts outstanding,
Jun-21
Total assets-25.4637.32.2643.31.6660.6
Deposits-30.8100.4-15.085.4-0.684.9
 Central bank-34.474.9-13.761.20.461.6
 Authorised deposit taking institutions3.319.4-0.718.6-1.017.6
One name paper3.641.66.047.2-3.244.3
Shares and equity3.6176.70.8180.35.4198.8
Other assets-1.9318.710.3330.30.1332.5

National general government liabilities

National general government selected liabilities, $b
  Transactions,
Dec-20
Amounts outstanding,
Dec-20
Transactions,
Mar-21
Amounts outstanding,
Mar-21
Transactions,
Jun-21
Amounts outstanding,
Jun-21
Total liabilities8.01,403.316.71,384.911.51,389.1
One name paper-12.541.4-8.133.3-6.027.3
Bonds23.7868.424.1856.46.2872.3
 Central bank18.5113.761.5169.736.3209.6
 Authorised deposit taking institutions-43.1179.3-34.3138.8-30.7110.5
 Rest of world36.5453.3-3.8429.93.2434.7
Other liabilities-3.1493.50.7495.211.3489.4

State and local general government financial assets

State and local general government selected financial assets, $b
  Transactions,
Dec-20
Amounts outstanding,
Dec-20
Transactions,
Mar-21
Amounts outstanding,
Mar-21
Transactions,
Jun-21
Amounts outstanding,
Jun-21
Total assets-0.4562.50.8572.04.8588.1
Deposits-1.978.50.078.51.179.6
Loans and placements0.049.02.551.69.360.9
Shares and equity-0.7405.9-0.9414.1-8.1417.1
 State and local PNFCs0.0321.20.0327.50.0329.7
 Other private non-fin corps-0.247.10.147.3-7.747.8
Other assets2.129.1-0.827.92.430.4

- nil or rounded to zero

State and local general government liabilities

State and local general government selected liabilities, $b
  Transactions,
Dec-20
Amounts outstanding,
Dec-20
Transactions,
Mar-21
Amounts outstanding,
Mar-21
Transactions,
Jun-21
Amounts outstanding,
Jun-21
Total liabilities17.1530.3-3.1517.86.9517.1
Loans and placements19.2295.2-4.9290.37.6297.9
 Central borrowing authorities18.9266.7-0.9265.87.9273.6
Unfunded superannuation claims0.9169.50.9161.20.8154.4
Other liabilities-2.965.70.966.3-1.564.8

General government

General government (national, and state and local) were net borrowers of $12.0b, driven by:

  • $7.4b in loan borrowing, and 
  • $7.1b issuance of bonds

Loan liabilities of state and local general government was at record levels, aligned with strong public investment on infrastructure projects observed across most States.
Treasury bond issuance continued to decline with the completion of the Commonwealth government's funding for the 2020-21 financial year. Deposit transactions were subdued as Commonwealth government expenditure stabilised following the conclusion of major COVID-19 related support policies.


Capital investment

Figures in the capital investment section are in seasonally adjusted current prices.

Net lending (+) / borrowing (-)

Australia's net lending position increased by $1.5b to $20.3b this quarter. This was driven by a: 

  • $6.9b increase in national net saving

Partially offset by:

  • $5.2b increase in gross fixed capital formation

National net lending as a proportion of GDP rose this quarter driven by a rise in general government net saving. The continued improvements in the economy led to further declines in COVID-19 related support packages.

  • General government net borrowing decreased by $11.2b to $20.0b.
  • Financial corporations' net lending increased by $4.2b to $10.3b 
  • Non-financial corporations' net lending decreased by $2.9b to $11.6b
  • Households' net lending decreased by $7.3b to $19.1b 

Notable drivers for general government and households were: 

  • General government net saving increased and is now positive for the first time since March quarter 2020. This was driven by increases in income tax and stamp duty.
  • Household final consumption expenditure increased as COVID-19 restrictions continued to ease. Increases were recorded across a number of categories including electricity, gas and other fuel, transport services and purchases of vehicles.

Capital Investment

National capital investment increased to 22.8% as a proportion of GDP.

Relative to GDP: 

  • General government investment increased to 4.2%
  • Household investment increased to 8.3%
  • Non-financial corporations' investment remained flat at 9.7%
  • Financial corporations' investment remained flat at 0.5%

General government investment rose driven by strength in state and local general government, reflecting elevated levels of investment in public infrastructure and non-dwelling projects.
Household investment rose driven by ownership transfer costs, new dwellings and home improvement investment. The government's HomeBuilder program supported increased housing investment. and households continued to invest in home improvements.
Non-financial corporations' investment rose, but remained flat as a proportion of GDP. Increased investment in machinery and equipment was supported by government tax incentives.
 

Data downloads

Time series spreadsheets

Changes to time series spreadsheets

TABLE 52. Financial Accounts Summary of Loan Outstandings to Households for Housing by Type of Lending Institution ($ million).

Amounts outstanding at end of period for Banks (A3571764X), FCA - Building societies (A3571765A) and FCA - Credit cooperatives (A3571766C) have been amalgamated into Authorised deposit taking institutions (A124919276R). This in line with the removal of the distinction between bank and non-bank ADIs in 2018 and the rest of the publication

Data files

Previous catalogue number

This release previously used catalogue number 5232.0

Revisions and changes

Revisions in this issue

This issue contains revisions to the original estimates of the capital accounts back to June quarter 2018 and concurrent seasonal adjustment.
The revisions to the financial accounts and balance sheets are back to June quarter 1988 and are a result of implementation of the quality assurance work undertaken through reviews of compilation methods and through source data provided to the ABS. Revisions have been applied to the entire time series of the financial instrument and sector tables. The most significant revisions are due to: 

  • review of treatment of repurchase agreement contracts with non-residents and correction of previous misreporting under short term debt securities (one name paper)
  • review of pension funds holdings of equity and implementation of self-managed superannuation fund revisions from the Australian Taxation Office compliance returns
  • refinement of net equity in reserves of pension funds and life insurance corporations
  • improvements to household unlisted equity asset transactions in incorporated businesses (other private non-financial corporations)
  • improvements in the compilation of other private non-financial corporations deposit assets using data sourced from the Economic and Financial Statistics (EFS) collection
  • correction of misclassified units between the Other broad money institutions and Securitiser sectors

Suppression of data

The ABS has suppressed the release of some data in this issue due to confidentiality. Tables affected include:

TABLE 6. Financial Assets and Liabilities of Non-Financial Corporations ($ million)
TABLE 8. Financial Assets and Liabilities of Private Non-Financial Corporations ($ million)
TABLE 10. Financial Assets and Liabilities of Other Private Non-Financial Corporations ($ million)
TABLE 17. Financial Assets and Liabilities of Other Broad Money Institutions ($ million)
TABLE 21. Financial Assets and Liabilities of Non-Life Insurance Corporations ($ million)
TABLE 38 Financial Assets and Liabilities of Rest of World ($ million)
TABLE 46. The Short Term Loans and Placements Market ($ million)
TABLE 53. Nominal Value of Short Term Loans and Placements Market ($ million)

Back to top of the page