Update to measuring unpaid care and modelling sex and age in the Labour Account

Update to experimental estimates of unpaid care and modelling sex and age in the Labour Account

Released
27/06/2025

Overview

A summary of key details from this information paper can be found in 13 key details about unpaid care and modelling sex and age in the Labour Account.

In September 2023, the Australian government released Working Future: The Australian Government’s White Paper on Jobs and Opportunity. This paper highlighted gaps in labour market data on unpaid care which, if addressed, would strengthen evidence-based policy decisions. 

The ABS was funded to provide estimates of the total hours spent on unpaid care and their monetary value, and model sex and age components to existing Labour Account data to provide a meaningful point of comparison with estimates of unpaid care. These measures will improve the visibility of the contribution of unpaid care to society and the economy, alongside the extensive information on paid work already captured through the Labour Account. For further information on the Labour Account, please see the Labour Statistics: Concepts, Sources and Methods.

An initial information paper published in November 2024 presented a first set of experimental estimates of unpaid childcare in Australia for June quarter 2021, based on preliminary concepts and methods. Since this time, the ABS has undertaken a consultation process via the Consultation Hub and further refined the methodology underlying the first estimates of unpaid childcare, in addition to developing estimates of unpaid adult care and producing a time series of unpaid care.

This information paper presents information on:

  • scope and definitions of unpaid care,
  • outcomes of the Consultation Hub process,
  • measurement approach for unpaid care,
  • experimental estimates of unpaid care in Australia for June quarter 2006 to September quarter 2024,
  • details of models developed for sex and age estimates for paid work in the Labour Account for each quadrant – jobs, people hours and payments,
  • unpaid care compared to Labour Account sex and age estimates, and
  • information on further plans and future directions.

A range of valuations of unpaid care are presented using different estimation methods for the various replacement cost options. The measurement of unpaid care is an emerging area internationally, which the ABS is a part of, and the approach is expected to evolve over time.

This work is part of a broader suite of investment in addressing priority labour market data gaps. Further information is available in Labour Statistics recent and upcoming developments.

Scope and definitions of unpaid care

ABS definitions of unpaid care and care work have been developed based on concepts laid out in the Statistics Canada Care Economy Conceptual Framework, which in turn draws on a range of international research.

Summary of care definitions
ConceptDefinitionExamples
Care workActivities and responsibilities involved in meeting the physical, psychological and emotional needs of care-dependent people
  • Physical and emotional care
  • Food preparation
  • Shopping
Care-dependent Requiring care to live independently due to functional limitations
  • Children (due to young age)
  • Elderly (due to old age)
  • Adults with long term health conditions or disability

The framework classifies care given as childcare or adult care. Childcare is care given to people under 15, while adult care is care given to people 15 and over. The cut off point of 15 years has been chosen to differentiate the level of care needed for young children compared to older children, who are generally more self-sufficient.

All care activities are classed as either direct or indirect care. 

  • Direct care involves hands on or face-to-face tasks, such as feeding or bathing.
  • Indirect care provides the pre-conditions required for direct care, such as preparing food or transportation. Indirect care also includes some household-based tasks which form part of caring holistically for an individual, such as shopping and cleaning.

Relevant domestic and household activities have been added to the single point-in-time estimates of indirect childcare previously published in November 2024. These activities should form part of caring for all care dependent individuals and should be measured consistently across both unpaid adult care and unpaid childcare.

Framework for measuring care

Framework for measuring care

The picture describes the framework used to define care. Care is defined as activities and responsibilities involved in meeting the physical, psychological and emotional needs of people. Care is defined as either childcare or adult care. Childcare is defined as caring activities to support functional limitations of people under 15. Note that functional limitations may be due to health problems, disability or age (e.g. children or elderly). Adult care is defined as caring activities to support functional limitations of people 15 and over. Care is defined as either direct care or indirect care. Direct care is defined as hands-on or face-to-face tasks, such as feeding, bathing, or helping with medical needs. Indirect care is defined as providing the pre-conditions for direct care, such as cleaning, helping organise medical appointments, or shopping. Examples of direct childcare are; physical and emotional care of children, teaching/helping/reprimanding children, playing/reading/talking with child, minding child, and feeding children. An example of direct adult care is physical care of adults (sick, with disability or aged). Examples of indirect childcare are; accompanying child to school or extra-curricular activities, food preparation for children, travel associated with childcare activities, housework, shopping, and household management. Examples of indirect adult care are; travel and communication associated with adult care, food and drink preparation/service, emotional support, housework, shopping, and household management. Indirect adult care examples refer to activities provided for care-dependent adults only.

Consultation process for unpaid care measurement

Internationally, there isn’t a single definition of unpaid care. Aggregate labour statistics on the topic are relatively new, and the underpinning concepts and methods are still developing. There is a growing awareness of the need to produce unpaid care data and recognise the contribution of this work to the broader economy and society, alongside the extensive information on paid work.

The ABS undertook an external consultation process from December 2024 to February 2025, which introduced the definitions, underpinning concepts and methods to stakeholders and sought feedback to help shape the ABS approach. In addition, the ABS has consulted internal subject matter specialists and is engaging with international experts as standards and measurement approaches develop.

The ABS has incorporated key aspects of feedback received through the consultation process, including: 

  • publishing a range of measures for various replacement cost options,
  • maintaining separate totals for sex and age without forcing alignment,
  • presenting age groups which are the most accurate and useful for unpaid care, including separating the 55 years and older age group to 55 to 64 years and 65 years and over, and
  • presenting a median wage rate to provide context to the estimates.

The consultation process also highlighted some aspects of unpaid care which were beyond the scope of these first set of experimental estimates. The ABS will continue to investigate and consider these suggestions and will look to incorporate aspects which can be measured in future iterations where possible, given input data source constraints and limitations. Further details are available in the “Future directions and next steps” section of this paper.

For additional information around the consultation process and its outcomes, refer to the “We Asked, You Said, We Did” area of the Consultation Hub. 

Measurement approach for unpaid care

An important concept to valuing unpaid care is whether the caring activity could have been replaced by a third party paid service. This is called the ‘third-party criterion’ and helps to determine whether an action is contributing to production within the economy.

Examples of activities that do not fit the third-party criterion include sleeping, watching television and personal care activities (such as self-grooming and dressing). These activities cannot be undertaken on behalf of another individual.

The labour contribution of unpaid care is estimated by assigning a value of the time spent on third-party criterion activities in the following way:

\[\text{[Value of unpaid care]} = \text{[Hours spent on unpaid care]} \times \text{[Applicable wage rate]}\]

Data has been produced in this paper using three valuation methods, outlined in the table below. These methods apply different monetary values to each caring activity.

Summary of methods
Valuation methodDescription
Individual function replacement cost methodApplies the wage for the equivalent occupation for each caring activity for the relevant demographic, at the time care activities were provided.
Minimum wage replacement cost methodApplies the national minimum wage rate at the time care activities were provided.
Housekeeper wage replacement cost methodApplies the housekeeper wage rate for the relevant demographic at the time care activities were provided.

While presented in the previously published single point-in-time childcare estimates, the opportunity cost method has not been populated for a full time series as it is not the preferred ABS measure of unpaid care. The median wage has also been applied to unpaid care hours in this paper to provide additional context to the replacement cost measures.

The estimates of unpaid care presented in this paper use information from a range of data sources.

Summary of data sources
Data sourceData used in modelling unpaid care
Time Use Survey (TUS)Hours spent on unpaid care activities
Survey of Employee Earnings and Hours (EEH)Biennial occupation-based wage rates
Census of Population and HousingProportion of people who are unpaid carers 
Wage Price Index (WPI)Quarterly index to model a time series of wage rates
Estimated Resident Population (ERP)Population estimates to model the total population of unpaid carers

Measuring hours spent on unpaid care from TUS activities

A key component of populating the care framework is how TUS activities can be mapped to various unpaid care activities. The full mapping of TUS activities is available at Attachment A.

An underlying assumption in identifying relevant TUS activities is that, for most domestic and household activities, not all reported hours spent on these activities should be included. A care provider will undertake some of these activities on their own behalf, therefore not all reported time spent relates to providing unpaid care. 50% of these hours has been chosen as a mid-point estimate, given the precise amounts are not distinguishable in TUS data.

This assumption of 50% of hours influences the total number of unpaid care hours measured, with the largest impact evident in measures of indirect adult care. If, for example, 25% of relevant hours were included, this decreases total unpaid care hours by approximately 26% on average across the time series. If these activities were not included in any capacity, this would decrease total unpaid care hours by approximately 52% across the time series. Monetary values would also be similarly affected.

The influence of this assumption on total unpaid care hours is shown in the graph below.

The impact of this assumption is greater for unpaid adult care than for unpaid childcare, given most unpaid adult care is indirect in nature.

In addition, characteristics of the respondent and their household dynamics have been used in determining the TUS respondents who should have their reported hours included. In the case of indirect childcare, respondents in households with children 14 years or under are considered in scope. For indirect adult care, if the respondent identifies as a carer to someone within the household, or outside the household if care is provided as a result of disability or old age, they are considered to be in scope.

Passive or secondary care hours

The estimates of unpaid care presented in this paper include passive or secondary care, which are care activities undertaken at the same time as a primary activity. Childcare in particular is often performed in conjunction with other activities, such as domestic or household-based tasks. While international guidance on measuring unpaid care recommends secondary care hours should be included to ensure complete capture of unpaid care activities, there are no definitive recommendations as to how these activities should be measured and valued.

Various options canvassed include:

  1. count time spent on the primary activity and secondary activities separately.
  2. allocate the same amount of time to the activities performed simultaneously.
  3. allocate time spent on simultaneous activities based on the proportion of time that a group spends on primary activities, ensuring time reported is constrained to a 24-hour day.

Measurement of secondary care hours in the Australian context is largely dependent on how data are collected through the TUS. Approaches to collecting this information varied considerably between the 2006 and 2021 iterations of the TUS. In 2006, information was asked of respondents in respect of “What was your main activity”, followed by “What else were you doing at the same time” with an example provided of minding children. In 2021, the main priority for secondary activities was to capture passive childcare, in line with increasing interest in exploring the gendered division of labour. Data was also collected via different methods across the surveys, with the 2006 TUS a paper-based diary approach and the 2021 TUS able to be completed online.

In a small number of cases, primary and secondary activities may also be coded to the same activity category. For example, cooking dinner and setting the table are both coded to food and drink preparation, and if both activities are included this may inflate the time reported as spent on that activity category.

It is inherently complex to fully understand how an individual will report the amount of time spent on undertaking unpaid care as a secondary activity. For example, some may not view caring for their own child as an “activity”, while others may report that they care for their child 24 hours each day. Given this, along with the differences in survey approaches, data on secondary care activities from 2006 and 2021 TUS iterations are not directly comparable. This resulted in the ABS applying an average of the two surveys in estimating a time series of unpaid care hours. This averaging approach has resulted in higher estimates of unpaid childcare hours when compared to the data published in the November 2024 information paper.

Another consideration when it comes to secondary care hours is how to apply a monetary value to the hours reported. For the individual function replacement cost estimates presented in this paper, secondary care activities have been valued at the same wage rate as primary care activities. This approach is different to how secondary care activities were valued in the previous information paper, which valued secondary care hours at the higher wage rate when compared to the primary activity. This approach was not able to be replicated readily across a time series, given the lack of available information on secondary activities from the 2006 TUS.

Estimating a time series of hours spent on unpaid care

Given available data inputs, the time series starts at June quarter 2006 to coincide with timing of the 2006 TUS. The time series concludes currently at September quarter 2024 to coincide with available ERP data.

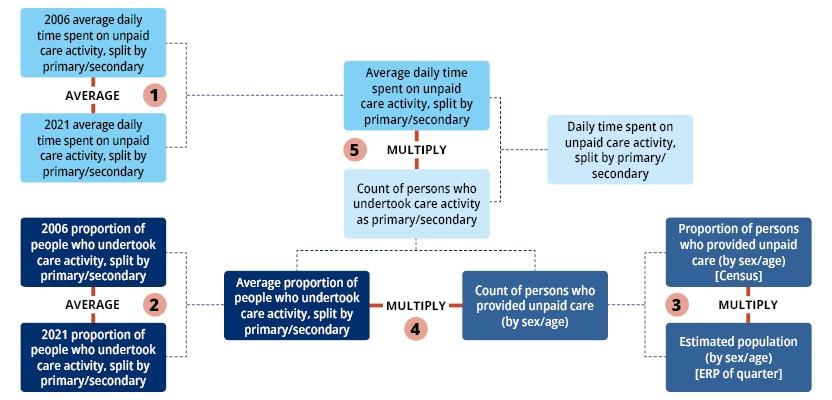
The model of hours spent on unpaid care involves the following steps:

  1. Identify the average daily time spent on unpaid care activities from each TUS (2006 and 2021), for both primary and secondary activities. Take the average of these daily times from 2006 and 2021. Averages are derived to account for significant methodological differences across TUS collections.
    1. For employed persons, the average daily time spent on unpaid care activities is reduced by the relevant quarterly growth rate of Labour Account hours worked per employed person. This recognises that the time available to dedicate to unpaid care may reduce as paid work hours increase.
  2. Identify from each TUS the proportion of people who undertook each care activity as a primary activity and as a secondary activity (as a proportion of all people who undertook unpaid care activities). Take the average of these proportions from 2006 and 2021. Averages are derived to account for significant methodological differences across TUS collections.
  3. Identify from the Census the proportion of people for each demographic group who undertook unpaid care. Apply these proportions to estimates of ERP for each demographic group.
  4. For each Census x ERP count from step 3, multiply by proportions derived in step 2. This provides estimates of counts of people who undertook each unpaid care activity as a primary activity and as a secondary activity.
  5. For the results derived from step 4 above, multiply by the average time spent on each activity calculated in step 1. This provides time series measures of the daily time spent on each unpaid care activity. To model the quarterly figures, multiply the daily estimates by the number of days in the relevant quarter.

These steps are represented visually in the diagram below.

Method for hours spent on unpaid care

Flowchart of method for hours spent on unpaid care

Measuring a time series of wage rate replacements for unpaid care activities

Wage rates for unpaid care occupation equivalents are taken as median estimates from each Survey of Employee Earnings and Hours. Given these EEH estimates are biennial, Wage Price Index information has been used to model a quarterly time series.

The Labour Account has an established process for benchmarking annual stock estimates using a quarterly indicator series. This process ensures that higher quality annual benchmarks are maintained, while using quarterly time series movements from an appropriate, conceptually similar, indicator series to model a line of best fit between benchmark points.

WPI indicator series have been applied to EEH benchmarks using this stock benchmarking process to model a quarterly time series of wage rates for unpaid care occupations. As EEH data are a biennial series, a linear interpolation process has been applied to derive a mid-point to use as an annual benchmark for non EEH years.

As WPI data are industry based, and EEH data are occupation based, a detailed mapping between 3-digit ANZSIC and 4-digit ANZSCO has been undertaken using a best practical fit approach.

Estimates of unpaid care

When estimates of hours spent on unpaid care activities are multiplied by an equivalent market replacement wage rate, this provides time series measures of the labour contribution of unpaid care.

Time series measures of three key replacement cost methods, and the median wage rate option, are presented in this release. Estimates of the labour contribution of unpaid childcare by sex and age groups are also included in the data download spreadsheets to enable analysis of how unpaid childcare is distributed across the population. 

The sum of unpaid care by sex will not equal the sum of unpaid care by age for a given quarterly estimate for all measurement methods. This may be attributed to:

  • the same occupation having different applicable wage rates, depending on whether the wage rate was taken from the associated age group or the relevant sex of the unpaid carer, and
  • the approach of applying average proportions from both the TUS and the Census leading to differences in total hours spent on unpaid care activities when aggregated by sex or age.

The ABS recommends using the sex-based totals presented in this paper over the age-based totals, as the greater availability of historical EEH data by sex when compared to data by age results in comparably higher quality time series wage rates by sex when using the benchmarking approach. The recommendation to use sex-based totals is different to the recommendation in the November 2024 information paper to use age-based estimates, with the single point-in-time estimates presented in that paper not affected by data availability issues.

Hours spent on unpaid care activities

Total hours spent on unpaid care activities have increased steadily over time, to stand at around 9.7 billion hours in September quarter 2024.

Replacement cost valuation methods

Of the different replacement cost valuation methods, the individual function method generally set an upper bound, valued at around $308.4 billion in September quarter 2024. In contrast, the minimum wage rate method provided a lower bound, valued at around $233.5 billion in September quarter 2024. The median wage rate valuation is also presented below to provide context, noting that it is not a preferred measurement option. 

All unpaid care monetary estimates presented in the remainder of this paper are derived using the Individual function replacement cost method and summed by sex. An expanded suite of estimates for all methods is available in the data downloads.

Direct and indirect childcare

The value of direct childcare was consistently greater than other types of unpaid childcare, reflecting the “hands on” nature of activities associated with caring for young children.

Direct and indirect adult care

The value of indirect household adult care was consistently greater than other types of unpaid adult care, given the relatively high proportion of hours spent on these types of adult care activities.

Unpaid care by sex

The value of unpaid care undertaken by males was generally around half of that undertaken by females across the time series.

Unpaid care by age

The value of unpaid care undertaken by those aged 35 to 44 years was highest across most of the time series, with unpaid care activities of those aged 15 to 20 years consistently valued as the lowest.

Methods for modelling sex and age in the Labour Account

Along with the new data on unpaid care in this release, the ABS has expanded its Labour Account series to include sex and age dimensions. These serve as a point of comparison to unpaid care valuations. All Labour Account series by sex and age are available in the data downloads section.

Unbalanced series

The Labour Account publishes balanced and unbalanced series. Balancing applies knowledge of the strengths and weaknesses across the various household and business data sources of the Labour Account, to derive a single coherent estimate. For this reason, the ABS has only produced sex and age data for balanced Labour Account series.

Output modelling approach

Modelling sex and age in the Labour Account applies demographic proportions to each Labour Account balanced series. This is an ‘output modelling’ approach. In contrast, an ‘input modelling’ approach would look to gather demographic data from all the sources that feed into the Labour Account and use these to undertake further balancing to produce sex and age estimates.

An output model was chosen for sex and age estimates, as an input-based model would be highly data intensive and may not fully capture the balancing changes which occur across industries in the Labour Account each quarter. An output model further ensures full coherence with published Labour Account measures.

Data sources

Data sources used in modelling need to cover both the household and business perspectives of the Labour Account. Potential data sources were assessed for their suitability for use as part of modelling sex and age. Numerous sources were assessed for suitability of use based on their alignment with Labour Account concepts, data frequency and availability. The assessment concluded that the Labour Force Survey (LFS) and Linked Employer-Employee Database (LEED) were most suitable for sex and age modelling.

Summary of data sources
Data source  Key features
Labour Force Survey (LFS)
  • Key household source for high quality demographic data.
  • Covers a long time series of monthly data.
  • Strong conceptual alignment with Labour Account data.
Linked Employer-Employee Database (LEED)
  • Key administrative data source for detailed industry and geographic information.
  • Contains a cross-sectional database built using Australian Tax Office (ATO) administrative data linked to ABS Business Longitudinal Analytical Data Environment (BLADE).
  • Strong conceptual alignment with Labour Account data.

Linked employer employee database time series

The LEED time series starts with the 2011-12 financial year, and the latest financial year period is published with a two-year lag. In contrast, the Labour Account time series starts in September 1994 and is published quarterly. There are gaps on both sides of the Labour Account time series that are not covered by the LEED.

To populate a full time series of LEED information for demographic modelling, LEED data levels have been back cast and forward cast applying movements from the conceptually similar LFS. Rolling averages are applied to LFS data to avoid introducing volatility associated with sampled data.

Out of scope populations

There are three main populations which are out of scope of the LFS that are included in Labour Account estimates, these are:

  • children aged under 15 years,
  • short-term non-residents, and
  • permanent defence force personnel. 

There is limited information available for these groups, and they make up a relatively small contribution to total jobs and other measures. As a result, short-term non-residents and permanent defence force personnel have not been separately modelled and have the same demographic distribution applied as the LFS in-scope resident population.

For children aged under 15 years demographic information is more readily available. This population has been modelled in the Labour Account since its inception. By age, this group is included with the under 19 age group. By sex, these are modelled based on the LFS distribution of 15-year-olds.

Age groupings

Age groups used in Labour Account sex and age modelling are a balance between alignment with standard LFS age groupings, and the need to include people under 15 years of age consistent with the Labour Account. Labour Account age groups are similar to, but more detailed than, those presented for unpaid care in this release. The more aggregated age groups presented for unpaid care estimates reflect inherent challenges in obtaining robust data inputs at a very detailed level.

Summary of age groupings
Labour AccountUnpaid care
19 years and under15 - 20 years 
20 – 24 years21 - 34 years
25 – 34 years
35 – 44 years35 – 44 years
45 – 54 years45 – 54 years
55 – 64 years55 – 64 years
65 years and over65 years and over

Estimates of sex and age by quadrant

Jobs quadrant modelling

Most jobs quadrant series were modelled at the industry level, consistent with the Labour Account. The exception to this is the private and public sector series. When split by industry, the public sector is too small to break down by sex and age. Job vacancies, and total jobs, were also not modelled as they both contain job vacancies which do not have a demographic dimension.

Labour Account sex and age series, Jobs quadrant
Industry levelAustralia level
  • Secondary jobs (a)
  • Main jobs (b)
  • Filled jobs (c)
  • Proportion of secondary jobs (c)
  • Filled jobs, Private sector (a)
  • Filled jobs, Public sector (a)
  1. Uses LEED demographic proportions
  2. Uses LFS demographic proportions
  3. Uses LEED & LFS demographic proportions

Filled jobs

By sex, the gap between jobs filled by males and females has narrowed over time as female participation in the workforce has increased. The decline in total filled jobs observed during 2020-21 reflects COVID-19 impacts on the labour market.

In the ten years before March 2025, the number of jobs filled by people aged over 54 years proportionally grew the most; by 35%, compared to 26% growth for all age groups. This is reflective of the overall trend of an ageing labour force.

Filled jobs, Health care and social assistance

Data for the Health care and social assistance industry was selected for presentation in the body of this paper as it is the largest employing industry. Data for all industries is available in the data download section.

From September 1994 to March 2025 filled jobs in Health care and social assistance grew more than any other industry, contributing just over a quarter of the increase in all filled jobs.

The 25-to-34-year age group went from being the third largest age group contributor to filled jobs in Health care and social assistance in 2014 to being the largest by 2016. Filled jobs for the 55-to-64-year age group were more than six times their 1994 level.

Persons quadrant modelling

Most persons quadrant series were modelled at the industry level, consistent with the Labour Account. The exception to this is the labour force series, which uses unbalanced unemployed persons series as a data input. Given this, the series has been modelled at the Australia level only.

Labour Account sex and age series, Persons quadrant
Industry levelAustralia level
  • Employed persons (a)
  • Main job-holders (b)
  • Multiple job-holders (c)
  • Rate of multiple job-holding (proportion of employed persons) (a)
  • Ratio of multiple job-holders (proportion of main job holders) (c)
  • Labour force (c)
  1. Uses LEED demographic proportions
  2. Uses LFS demographic proportions
  3. Uses LEED & LFS demographic proportions

Multiple job-holders

By sex, the gap between the number of female and male multiple job-holders has increased over time. Women and younger workers were more likely to hold multiple jobs.

The total number of multiple job-holders in Australia has increased in recent years, due in part to the rise in cost of living for employees seen after March 2020 COVID impacts. The growth in multiple job-holders was led by people under 45 years, compared to more moderate increases in older age groups.

Multiple job-holders, Health care and social assistance

Females were more likely to work multiple jobs in the Health care and social assistance industry than males. This gap has widened in the past five years.

The number of multiple job-holders in Health care and social assistance has increased in recent years. Like the national estimates, this growth was led by people under 45 years.

Volumes quadrant modelling

Most volumes quadrant series were modelled at the industry level, consistent with the Labour Account. The exception to this is the available hours of labour supply, which uses unbalanced hours sought series as a data input. Given the need for unbalanced data, this series has been modelled at the Australia level only.

All volumes quadrant series outlined in the table below were modelled using LFS demographic proportions.

Labour Account sex and age series, Volumes quadrant
Industry levelAustralia level
  • Average hours actually worked per Labour Account employed person
  • Average weekly hours actually worked per Labour Account employed person
  • Hours paid for
  • Hours actually worked in all jobs
  • Average hours actually worked per job
  • Available hours of labour supply

Available hours of labour supply

Although the participation of females in the workforce has increased, males continued to contribute more hours to Australia’s available labour supply.

Over the past ten years, the available hours of labour supply of people over 54 years has grown faster than people under 25 years. This is reflective of an ageing workforce, and economic pressures leading to later retirement.

Hours actually worked, Health care and social assistance

In March quarter 2025, females worked around three quarters of hours in Health care and social assistance, compared to around a quarter for males. Over time, this industry has consistently attracted more female workers than males.

Hours worked by age in Health care and social assistance have aligned closely with changes in the composition of the industry’s workforce over time.

Payments quadrant modelling

Most payments quadrant series were modelled at the Australia level, unlike the Labour Account which has an industry dimension to all series. Compensation of employees is the only series current data sources allow for modelling at the industry level. Labour cost series such as training and recruitment costs have not been modelled, as they do not have a demographic dimension.

Labour Account sex and age series, Payments quadrant
Industry levelAustralia level
  • Compensation of employees (a)
  • Labour income from self-employment (a)
  • Total labour income (a)
  • Average income per Labour Account employed person (a)
  • Average hourly income per Labour Account employed person (b)
  1. Uses LEED demographic proportions
  2. Uses LEED & LFS demographic proportions

Total labour income

Despite the gender pay gap narrowing in recent years, males continued to contribute more to total labour income than females. This is due to a combination of males tending to work longer hours, and on average being paid more per hour than females.

The majority of labour income was earned by people aged 24 to 54 years, consistent with their share of the labour force.

Compensation of employees, Health care and social assistance

Compensation of employees is the only payments quadrant series that is modelled at industry level. This series excludes income from self-employment.

For the Health care and social assistance industry, compensation of employees for females in March quarter 2025 was $33.7 billion, or 72% of the total, compared to $13.4 billion for males, or 28% of the total.

The distibution by age for compensation of employees in Health care and social assistance was similar to the Australia level, with some small differences. The 55 to 64 year age group’s earnings were closer to people aged 25 to 54 years than at the Australia level, reflecting a larger proprotion of people aged 55 to 64 years working in this industry.

Unpaid care compared to Labour Account sex and age estimates

Estimates of unpaid care in this release assign a market replacement cost value to hours spent caring for children or adults. Comparisons can be made between this market replacement cost for unpaid care, and total labour income from paid work. From 2006 to 2024, the value of total unpaid care ranged from 77% to 98% of total labour income.

Females spent more time providing unpaid care than males. In September quarter 2024, for every dollar an employed female earned though paid work, time spent on unpaid care by all females was valued at $1.39. During the same period, for every dollar an employed male earned though paid work, time spent on unpaid care by all males was valued at $0.50.

People under 45 earned more income from paid work than people aged 45 and over, with the value of unpaid care provided by this age group also greater than older age groups. This generation is most likely to have greater demands on their time from work and caring responsibilities. As of the September quarter 2024, in aggregate this cohort earned 56% of total labour income, and contributed 62% to the total value of unpaid care.

Future directions and next steps

The ABS will continue to review and refine its estimates of unpaid care, with a view to maturing our approach to measuring unpaid care in labour statistics over time, in step with developments across the international statistical community. This may also incorporate additional aspects of feedback received through the Consultation Hub process.

Examples for potential future work include:

  • Separately identifying and valuing care for children with a disability.
  • Investigating separate valuation of secondary care activities across the time series.
  • Accounting for varying “intensity” of unpaid care provided, for example through accounting for the number of unpaid carers present in a single household.
  • Exploring what unpaid care would be valued at if a carers payment or equivalent were applied instead of a replacement cost wage rate.
  • Separately identifying short term care provided to adults, which is conceptually outside the scope of our care framework, however, may be captured in Time Use Survey estimates.
  • Expanding our definition of care to incorporate additional elements where possible.
  • Modelling additional financial aspects or costs to the unpaid carer, for example lost superannuation or paid work leave entitlements.

In addition, the ABS will undertake further work on the preliminary estimates of sex and age Labour Account data published with this paper. This may include minor refinements to methods, for example improvements to the modelling of populations which are out of scope of the LFS, and an assessment of whether original sex and age estimates can be meaningfully seasonally adjusted.

The ABS intends to provide additional updates on unpaid care on an annual basis, with the next iteration scheduled for June 2026. Labour Account sex and age data will be fully incorporated and published with existing quarterly Labour Account estimates, likely commencing with the December quarter 2025 issue published in March 2026. Further information and updates will be provided in future Labour Account publications.

Data downloads

Time series spreadsheets

Data files

Attachment A – Mapping of TUS activities to unpaid care activities

Unpaid childcare

Unpaid adult care

Back to top of the page