Jobs quadrant

This is not the latest release View the latest release
Labour Statistics: Concepts, Sources and Methods
Reference period
2021
Released
15/02/2022

The Jobs quadrant provides data on the number of jobs, both filled and vacant. Estimates from business surveys are balanced with estimates from household surveys.

Jobs quadrant

Jobs quadrant
The diagram shows that in the Jobs quadrant: Number of main jobs plus Number of secondary jobs equals Filled jobs. Filled jobs plus Job vacancies equals Total jobs.

Jobs concepts

The concept of a “job” is central to the Australian Labour Account. It is the mechanism through which people engage in production.

The Oxford English Dictionary has multiple meanings for the word, one of which approximates the concept as it is applied in the Australian Labour Account and the 2008 System of National Accounts (2008 SNA) – “a task or piece of work, especially one that is paid”.

The 2008 SNA does not explicitly define a job. Rather, it observes the agreement between an employee and the employer defines a job, and each self-employed person has a job (2008 SNA, 19.30). In application, a self-employed person is both the employer and employee. A job is position held by a person that involves work, duties or responsibilities; it may or may not provide returns of compensation or benefits to the individual.

As the dictionary definition implies, not all jobs are paid, either in money or in kind. People can be engaged in productive economic activity within an institutional unit for no apparent reward, in which case they are contributing to output but receiving no compensation. The 2008 SNA concept of a job includes these people as volunteer labour (2008 SNA, 19.39).

Jobs are created by enterprises. In the case of the self-employed person, the International Labour Organisation (ILO) defines these jobs as those where the remuneration is directly dependent upon the profits (or the potential for profits) derived from the goods and services produced (where own consumption is considered to be part of profits). The incumbents make the operational decisions affecting the enterprise, or delegate such decisions while retaining responsibility for the welfare of the enterprise. In this context, "enterprise" includes one person operations.

In summary, and in the context of the Australian Labour Account, a job is a set of production related tasks that can be assigned to and undertaken by a person, and for which they are usually, but not necessarily, remunerated either in money or in kind.

Production related tasks are constrained to economic activity within the 2008 SNA production boundary, and jobs are created and maintained by institutional units (Type of Activity Units within Enterprise Groups in the Australian context).

The Australian Labour Account includes all jobs created and maintained by institutional units (that is, households, legal entities and social entities) resident in Australian economic territory, involving economic activity within the Australian application of the 2008 SNA production boundary.

Estimates of movements in the number of jobs in the economy provide a measure of labour market performance and capacity.

Jobs characteristics

Jobs can be classified according to:

  • inherent job characteristics (e.g. whether the job is full-time or part-time),
  • characteristics of the person holding the job (e.g. whether the job is filled by a self-employed person or an employee), or
  • characteristics of the enterprise creating the job (e.g. the industry or institutional sector to which the job relates).

Status in employment

In the Australian context, self-employment according to the ILO definition is not separately identified. Rather, jobs are distinguished according to the status in employment categories of the people filling the job.

These categories include:

  • Employee;
  • Owner manager of incorporated enterprise with employees;
  • Owner manager of incorporated enterprise without employees;
  • Owner manager of unincorporated enterprise with employees;
  • Owner manager of unincorporated enterprise without employees; and
  • Contributing family workers.

The closest approximation to the ILO concept of self-employment in the Australian context is the aggregation of the four “owner manager” status in employment categories.

Employees

Employees are those employed persons who do not operate their own incorporated or unincorporated enterprise. An employee works for a public or private employer and receives remuneration in wages, salary, on a commission basis (with or without a retainer), tips, piece rates, or payment in kind.

Owner managers of incorporated enterprises

An owner manager of an incorporated enterprise is a person who operates his or her own incorporated enterprise, that is, a business entity which is registered as a separate legal entity to its members or owners (also known as limited liability company).

An owner manager of an incorporated enterprise (an OMIE) may or may not hire one or more employees in addition to themselves and/or other owners of that business.

Owner managers of unincorporated enterprises

In the Australian Labour Account, own-account workers and employers employed in their own enterprises are referred to as Owner Managers of Unincorporated Enterprises (OMUEs). OMUEs are persons who operate their own unincorporated enterprise, or engage independently in a profession or trade. An owner manager of an unincorporated enterprise may or may not hire one or more employees in addition to themselves and/or other owners of that business.

Contributing family workers

A contributing family worker is a person who works without pay in an economic enterprise operated by a relative. Contributing family workers, including those working without pay in unincorporated enterprises engaged wholly or partly in market production, are also treated as self-employed (2008 SNA, 7.30b).

The ILO defines a contributing family worker as a person who holds a self-employment job in an enterprise operated by a related person, and who cannot be regarded as a partner because the degree of his or her commitment to the operation of the enterprise, in terms of the working time or other factors to be determined by national circumstances, is not at a level comparable with that of the head of the establishment.

Internationally the concept is restricted to those living in the same household, however Australia has not applied the same criteria of cohabitation in its implementation. For example, an adult child who makes unpaid contributions of labour to a family business operated by their parents, and does not live in the same household as the parents, is still considered to be a contributing family worker.

Own-account workers engaged in the production of goods exclusively for own final use by their household (such as subsistence farming or do-it-yourself construction of own dwellings), are considered employed according to the definition of employment adopted by Thirteenth International Convention of Labour Statisticians (ICLS). Households producing unpaid domestic or personal services (e.g., housework, caring for family members) for their own final consumption are excluded, as such activities fall outside the 2008 SNA production boundary and are not considered employment.

Jobs in the Australian Labour Account

Jobs which are in and out of scope of the Australian Labour Account are summarised in the table below.

Jobs in scopeJobs out of scope
Paid employment with formal work agreements – i.e. an employer/employee relationship.Positions which are purely voluntary and no remuneration is received, either in cash or in kind.
Owner managers of businesses – i.e. self-employed persons.Activities relating to the production of unpaid domestic services.
Unpaid contributions of labour to a family business or farm – i.e. contributing family workers.Activities and positions outside of Australia’s economic territory.
Activities relating to the production of goods for own consumption.Activities relating to unreported illegal transactions.

Jobs and persons

The number of jobs in the economy exceeds the number of persons employed, to the extent that some employed persons have more than one job in the same period. An individual with more than one job may do these successively, as when the person works for part of the week in one job and the rest of the week in another, or in parallel, as when the person has an evening job as well as a daytime job. In addition, the number of jobs in the economy may be reduced when compared to the number of persons employed in instances of formal job sharing arrangements.

Employers may not be aware of, and in any case are not asked to provide information on, secondary jobs undertaken by their employees. When employers supply information on the number of employees, they actually provide information on the number of jobs they hold. This is because the same employee would be reported separately by each employer. The distinction between the number of jobs and the number of employed persons is one issue that is informed by the Australian Labour Account.

The Australian Labour Account recognises this difference by accounting for multiple job holding, and reports the number of jobs in the Jobs quadrant and employed persons in the Persons quadrant. However, the Australian Labour Account does not compile estimates of formal job sharing, as there is currently no available data source to measure this, and it is particularly unlikely to be reported accurately by businesses.

The statistics derived from the Labour Force Survey are designed to produce estimates of the number of people engaged in economic activity. The statistics derived from ABS business surveys count the number of jobs in which people are employed. For example, a person holding multiple jobs with different employers would be counted once in ABS household surveys as an employed person, but in ABS business surveys would be counted multiple times, once by each employer for each job that they held.

A number of examples illustrate this:

  • if an unemployed person became employed full-time (by starting one full-time job), then the full-time employment estimate from the Labour Force Survey would increase by one (in a business survey, or a 'filled jobs' count, this would lead to an increase in the filled jobs estimate by one);
  • if an unemployed person became employed full-time (by starting two part-time jobs with a total of 35 hours of work or more per week), then the full-time employment estimate from the Labour Force Survey would increase by one (however, in a business survey, or a 'filled jobs' count, this would lead to an increase in the filled jobs estimate by two);
  • if a person who was already employed in one part-time job took on another part-time job, this would have differing impacts on the employment estimates from the Labour Force Survey depending on the total number of hours worked: if the sum of hours worked in the two part-time jobs was fewer than 35 hours per week, the employment estimates from the Labour Force Survey would remain unchanged, but if the sum of hours worked was 35 hours or more, the employment estimates from the Labour Force Survey would show a decrease of one in part-time employment and an increase of one in full-time employment (however, in both cases this would lead to an increase of one in the filled jobs estimate from a business survey);
  • if a person who was employed in three part-time jobs (working a total of more than 35 hours per week) resigned from these and assumed one full-time job, this would have no impact on the employment estimates from the Labour Force Survey (however, this would lead to a decrease of two in the filled jobs estimate - the number of part-time filled jobs would decrease by three while the number of full-time filled jobs would increase by one); and
  • if a person employed in two part-time jobs became unemployed, the employment estimate from the Labour Force Survey would decrease by one (however, this would lead to a decrease of two in the filled jobs estimate from a business survey).

The Proportion of Secondary Jobs presents the number of secondary jobs as a proportion of the total number of filled jobs for each industry and the total economy. This measure provides insight into the relative number of secondary jobs in each industry, and enables comparison across industries and with each industry to an economy wide average.

Proportion of Vacant Jobs

The development of the Australian Labour Account has made it possible to produce an important new labour market measure – the Proportion of Vacant Jobs (PVJ).

The PVJ provides a useful labour demand-side view of relative labour demand, at the industry level, presenting the relationship between unmet demand (job vacancies) and met demand (filled jobs) within the Australian Labour Account.

The PVJ is calculated as the number of vacant jobs as a proportion of total jobs. This derived measure is a function of filled jobs and job vacancies. By bringing together met demand and unmet demand, the PVJ provides new insights into changes in the labour market.

In addition to providing insights into cyclical labour demand and employment, changes in the PVJ over time can also highlight that some of the following may be occurring:

  • Changing employment capacity – there may be indications that the industry is nearing its full employment potential or, conversely, that there is the possibility of future employment growth;
  • Job churn – the industry may not be maintaining long term employment, resulting in a high number of job vacancies without long term growth in employment;
  • Skill mismatch – current availability of skills may not be able to satisfy employer requirements, resulting in an extended search for appropriately skilled staff; and/or
  • Changing employment conditions or arrangements - the industry may be transitioning from full-time to part-time roles, or a greater use of contractors or use of labour hire firms.

Understanding changes in the PVJ (and analysing the underlying factors contributing to these changes) will enable Australia to better understand its labour market.

Jobs sources

Source data for quarterly and industry estimates of jobs

Numbers of filled jobs, from the business sources side, are sourced from the following ABS data:

  • Quarterly estimates of private sector jobs are estimated from underlying data from the Quarterly Business Indicators Survey (QBIS), from Business Indicators, Australia.
  • Quarterly estimates of private sector jobs for out of scope ANZSIC Divisions in QBIS are estimated from the Economic Activity Survey (EAS), published in Australian Industry for ANZSIC Division A (Agriculture, Forestry and Fishing) and Division O (Public Administration and Safety), using quarterly Compensation of Employees as a quarterly indicator series; and
  • Quarterly data for the public sector are estimated using underlying data from the Survey of Employment and Earnings (SEE), from Employment and Earnings, Public Sector, using quarterly public sector Compensation of Employees as a quarterly indicator series.

Business survey data are supplemented by ABS business register information, defence force information, child workers information and estimates from the ABS Labour Force Survey for contributing family workers.

The number of filled jobs, from the household survey side, is the aggregate of the number of main jobs and secondary jobs, less jobs with formal job sharing arrangements. Estimates for main jobs and secondary jobs are sourced from underlying data from Labour Force, Australia. Survey based data are supplemented with defence force information, child workers information, information on non-residents working in Australia, and Australian residents living in Australia employed by overseas companies/business entities to account for survey scope restrictions. There is no information currently available on the number of jobs with formal job sharing arrangements.

Numbers of job vacancies are sourced from Job Vacancies, Australia. Data from the Internet Vacancy Index, published by the Department of Employment, Skills, Small and Family Business, are used to supplement ABS survey data for the out of scope ANZSIC Division A (Agriculture, Forestry and Fishing).

The table below summarises data sources used in compiling quarterly and industry estimates of jobs.

Source dataUse in compiling quarterly data
Australian IndustryUsed to benchmark quarterly data from Business Indicators, Australia of Employees as a quarterly indicator series. Also used to compile estimates of private sector filled jobs (business sources) for out of scope ANZSIC Divisions in QBIS, using quarterly Compensation.
Business Indicators, AustraliaUsed to compile quarterly estimates of private sector filled jobs (business sources).
Employment and Earnings, Public SectorUsed to compile estimates of public sector filled jobs (business sources), using quarterly Compensation of Employees as a quarterly indicator series.
Business register information (ABS Business Register Unit)Used for scope adjustments to private sector filled jobs (business sources).
Defence force information (ABS National Accounts)Used to estimate out of scope defence jobs for both filled jobs (business sources) and filled jobs (household sources).
Labour Force, AustraliaUsed to estimate filled jobs (household sources), both main and secondary jobs. Also used to estimate jobs held by out of scope non-residents working in Australia, and unemployment.
Child Employment, Australia, 2006Used to estimate out of scope child employment for both filled jobs (business sources) and filled jobs (household sources).
Migration, Australia and Overseas Arrivals and Departures, AustraliaUsed to estimate jobs held by out of scope non-residents working in Australia.
Balance of PaymentsUsed to estimate out of scope Australian residents living in Australia employed by overseas companies/business entities.
Job Vacancies, AustraliaUsed to compile job vacancies, and total jobs.
Internet Vacancy Index (Department of Employment, Skills, Small and Family Business)Used to compile jobs vacancies, and total jobs, for the out of scope Agriculture, Forestry and Fishing ANZSIC Division A.

Source data for annual estimates of jobs

The number of annual filled jobs, from both the business and household side, and the number of annual job vacancies, are compiled from the same data sources as the quarterly estimates.

Jobs methods

The Jobs quadrant provides data on the number of jobs (filled and vacant) as at the end of the quarter. Job statistics are compiled for each ANZSIC industry subdivision and division, and for the economy as a whole. Unless otherwise stated, the methods described apply to both levels of aggregation.

Total jobs

Total jobs is the sum of filled jobs, plus job vacancies.

Filled jobs

Filled jobs (business sources)

The number of filled jobs, from the business sources side, is equivalent to the number of people employed in enterprises resident in the Australian Economic Territory and engaged in economic activity within the scope of the National Accounts production boundary. People counted include employees, working proprietors and partners, employees absent on paid or prepaid leave, employees on workers' compensation who continue to be paid through the payroll, and contract workers paid through the payroll.

Filled jobs (business sources), for each quarter, is estimated by aggregating:

  • For the private sector, the number of employees as at the end of each quarter, sourced from the annual Economic Activity Survey (EAS) and published in Australian Industry;
  • For the public sector, the number of employees as at the end of each quarter, derived using underlying data from the Survey of Employment and Earnings (SEE). Public sector SEE data used in the Australian Labour Account exclude units in the non-financial and financial sectors, as they are also in scope of the EAS; and
  • Quarterly estimates of underlying Quarterly Business Indicator Survey (QBIS) data from Business Indicators, Australia to represent private sector employment in ANZSIC Division K (Finance and Insurance Services), which is out of scope of the EAS.

These three surveys cover most of the ANZSIC industries, except for:

  • Class 6310 Life Insurance;
  • Class 6330 Superannuation Funds; and
  • Class 7600 Defence.

Units in ANZSIC Class 6330 Superannuation Funds are funds set up to provide retirement benefits. Conceptually they are considered to be non-employing units, and therefore would not contribute to Australian Labour Account estimates. As such, no estimate for employment in this industry has been included.

Scope adjustments are made for the following sectors and populations:

Add:

  • The number of persons employed (at the end of each quarter) in ANZSIC Class 6310 (Life Insurance), sourced from underlying data from the ABS Business Register. This industry is not included in the EAS or QBIS.
  • The number of persons employed in the permanent defence forces as at the end of each quarter, sourced from underlying ABS National Accounts data. Defence force personnel fall outside the scope of the SEE. All defence force personnel in Class 7600 (Defence) are assumed to work in the Public Administration and Safety industry (ANZSIC Division O).
  • The number of unpaid contributing family workers for the quarter, sourced from the Labour Force Survey and published in Labour Force, Australia, as unpaid employees are out of scope of ABS business surveys.
  • An estimate of the number of child workers (persons aged 5 to 14) who are self-employed, working on a farm, or as a contributing family worker. These data are sourced from ABS household survey data, using underlying data from Child Employment, Australia, 2006. Population estimates from Australian Demographic Statistics are used to extrapolate the number of child workers from the 2006 benchmark level, by assuming that the proportion of the age group working has not changed. Industry proportions are based on underlying Labour Force Survey data on employed persons aged 15 years old. No adjustments are made for child workers who are employees, as these persons are in scope of both EAS and QBIS.

Deduct:

  • The number of persons engaged in ANZSIC subdivision 28 Water Supply, Sewerage and Drainage (Employment and Earnings, Public Sector, Australia) as this subdivision is included in the Australian Industry. ABS Business Register data are available from June 2007. For earlier time periods, the movement in filled jobs for the Electricity, Gas, Water and Waste Services industry is applied.
Calculation of filled jobs (business sources) by industry

Data derived from an annual survey are generally considered to be of higher quality than quarterly data due to the larger sample sizes, and are generally subject to less volatility than quarterly run surveys. Annual source data provide overall levels, known as annual benchmarks, from which quarterly estimates are compiled. This ensures consistency between the quarterly and annual labour accounts.

For all ANZSIC industry divisions except A (Agriculture, Forestry and Fishing); K (Financial and Insurance Services) and O (Public Administration and Safety), a mathematical technique (the modified Proportional Denton Method) is used to benchmark quarterly stocks of private sector jobs reported in QBIS to annual data from EAS. This ensures the benchmarked quarterly levels are identical each June quarter, while maintaining the observed quarterly pattern from QBIS as much as possible.

For the most recent quarters, for which EAS year-end data are not available, the previous year-end EAS numbers are extrapolated, also using the modified Proportional Denton Method. Extrapolated data are calculated for up to 6 quarters, due to the 18 month lag in the delivery of EAS data.

For Division A (Agriculture, Forestry and Fishing) and Division O (Public Administration and Safety), for which QBIS data are not available, EAS estimates of the number of jobs is used as an annual benchmark, with quarterly Compensation of Employees used as a quarterly indicator series.

For Division K (Finance and Insurance Services) for which EAS data are not available, employment data reported in QBIS are used directly as the quarterly estimate of private sector job holding.

To calculate the number of public sector filled jobs, underlying data from the Survey of Employment and Earnings (SEE) are used as an annual benchmark, with quarterly public sector Compensation of Employees used as a quarterly indicator series.

EAS data are not available on a consistent industry classification prior to 2009-10. For time periods prior to June 2010, filled jobs as measured from business sources are derived as follows: 

  • From December quarter 2001 to June quarter 2010: seasonally adjusted movements in Compensation of Employees (which have been price deflated using the Wage Price Index), are applied to the June 2010 level.
  • From September quarter 1994 to December quarter 2001, movements in the number of employees from Wage and Salary Earners, Australia are applied to the December 2001 level. These data relate to both the public and private sectors for each industry division except for Division A (Agriculture, Forestry and Fishing), which is limited to the public sector only. Applying movements from the Agriculture industry based on the public sector data produces large movements, given the small level associated with the indicator series. Movements from the Transport and storage industry are instead used as a proxy, given the strong links in production and supply chains between agriculture and transport. As the data are also on a historical industry classification basis, conversion factors based on employees from the Labour Force Survey are applied to approximate the current industry classification.

Filled jobs (household sources)

The number of filled jobs, from the household side, is equal to the number of people employed in main jobs and secondary jobs sourced from the household Labour Force Survey.

Filled jobs (household sources), for each quarter, is estimated by aggregating:

  • The number of main jobs reported in the end of quarter reference month (i.e. March, June, September and December) in the household Labour Force Survey and published in Labour Force Australia, and
  • The number of secondary jobs reported in the end of quarter reference month in the household Labour Force Survey.

The following scope adjustments are made:

Add:

  • The number of persons employed in the permanent defence forces as at the end of each quarter, to the estimate of main jobs. Defence force personnel are not included in the Labour Force Survey, and these data are sourced from underlying ABS National Accounts data. All defence force personnel are assumed to work in ANZSIC Division O (Public Administration and Safety). Permanent defence force personnel are also assumed to work solely in their main job and not have multiple jobs.
  • An estimate of the number of child job holders who are aged between 5 to 14 years as at the end of each quarter, to the estimate of main jobs. It is assumed that child workers do not hold secondary jobs. The estimate covers all child workers, regardless of employment status, as all children less than 15 years of age are excluded from the scope of the Labour Force Survey. The estimate is derived from data collected in the 2006 household survey Child Employment, Australia, 2006. Population estimates from Australian Demographic Statistics have been used to extrapolate the number of child workers from the 2006 benchmark level, by assuming the proportion of children in the 5-14 year age cohort who work has remained the same as that recorded in 2006. Industry allocations are based on underlying Labour Force Survey data on the industry of employment of 15 year old persons.
  • An estimate of the number of main jobs held by non-resident visitors to Australia employed by Australian resident enterprises to the estimate of main jobs (see Non-resident visitors section below).
  • An estimate of the number of secondary jobs held by non-resident visitors employed by Australian resident enterprises to the number of secondary jobs.

Non-resident visitors

Time periods from March 2006 onwards

The Labour Force Survey excludes from its scope non-resident visitors who intend spending less than 12 months in Australia, some of whom are employed during their stay by Australian resident enterprises. As non-resident visitors are included in the scope of business surveys (EAS and QBIS), only household side labour force data are adjusted to include non-resident visitors who are employed.

Data are sourced from short term visitor arrivals statistics from Overseas Arrivals and Departures, Australia and overseas migration data from Overseas migration. Data are obtained for the number of short term visitors who are present in Australia at the end of the reference quarter but who are not included in the Estimated Resident Population. Of interest are those people who have entered the country with a visa that includes working rights. Information on the main reason for journey is also collected. These visa classes and reasons for journey are detailed below.

Visa subclasses and Reasons for journey used in the Australian Labour Account

Visa subclass

400 Temporary Work (Short Stay Activity) (from 23/3/13)
401 Temporary Work (Long Stay Activity) (from 24/11/12)
402 Training and Research (from 24/11/12)
403 Temporary Work (International Relations) (from 24/11/12)
405 Investor Retirement (from 1/11/04)
410 Retirement
416 Special Program
417 Working Holiday
419 Visiting Academic
420 Entertainment
421 Sport
422 Medical Practitioner
423 Media and Film Staff
424 Public Lecturer
426 Diplomatic or Consular
427 Domestic Worker Overseas Executive
428 Religious Worker
430 Supported Dependent of Australian or NZ Citizen Temp in Australia
442 Occupational Trainee
444 Special Category - New Zealand Citizen
456 Business (Short Stay) (from 1/8/96)
457 Temporary Work (Skilled) (from 24/11/12) previously Business (Long Stay) (from 1/8/96)
459 Sponsored Business Visitor (short stay) (from 1/7/00)
461 New Zealand Citizen (Family Relationship) Temporary Visa (from 26/2/01)
462 Work and Holiday
470 Professional Development (from 1/7/03)
476 Skilled - Graduate (from 1/9/07)
482 Temporary Skill Shortage (from 18/03/2018)
485 Temporary Graduate (from 23/3/13) previously Skilled - Graduate (from 1/9/07) (replaced 497)
500 Student (Temporary) (from 01/07/16)
570 Independent ELICOS Sector(from 1/7/01)
571 Schools Sector (from 1/7/01)
572 Vocational Education and Training Sector (from 1/7/01)
573 Higher Education Sector (from 1/7/01)
574 Postgraduate Research Sector (from 1/7/01)
575 Non-Award Foundation/Other Sector (from 1/7/01)
576 Ausaid/Defence Sponsored Sector (from 1/7/01)
995 Diplomatic

Reason for journey 

  • Business
  • Convention/conference
  • Education
  • Employment
  • Exhibition – Other/Not Stated/Not Applicable
  • Holiday
  • Visiting friends and relatives
Visa subclass and reason for journey - used in calculating short term visitor arrivals

400 Employment
401 Employment; Education
402 Employment; Education
403 Employment; Education
405 Employment; Education
410 Employment; Education
416Employment; Education
417 Employment; Education; Holiday; Business; Visiting friends and relatives
419 Employment; Education
420 Employment; Education
421 Employment; Education
422 Employment; Education
423 Employment; Education
424 Employment; Education
426 Employment; Education
427 Employment; Education
428 Employment; Education
430 Employment; Education
442 Employment; Education
444 Employment; Education
456 Employment; Education
457 Employment; Education; Business; Visiting friends and relatives
459 Employment; Education
461 Employment; Education
462 Employment; Education; Holiday
470 Employment; Education
476 Employment; Education
482 Employment; Education; Business; Visiting friends and relatives
485 Employment; Education
500 Employment; Education
570 Employment; Education
571 Employment; Education
572 Employment; Education
573 Employment; Education
574 Employment; Education
575 Employment; Education
576 Employment; Education
995 Employment; Education


Visa classes are aggregated into three main groups: short term visitors (students); short term visitors (sponsored visa holders); and short term visitors (other).

To estimate the number of main jobs held by students who short term visitors, the quarterly average employment rate of resident persons attending tertiary education, obtained from the Labour Force Survey, is multiplied by the estimated number of short term student visa holders. The Labour Force Survey data used in the calculation of employed short term students is limited to those persons aged 15-24 years old, who are currently undertaking full-time tertiary education. The method assumes that similar employment rates apply to short term visitors on student visas as for full-time Australian resident tertiary students, and that all short term student visa holders are in the labour force (either employed or unemployed).

To estimate the number of main jobs held by other short term visitors, the quarterly average employment rate for all residents is multiplied by the number of visa holders (other than sponsored visa holders) with working rights. This method assumes that all temporary entrants with a visa that had working rights (other than 400, 457 and 482 visa holders) were in the labour force (either employed or unemployed), and that similar rates of employment for this group apply when compared with the resident population

To estimate the number of main jobs held by short term visitors who are sponsored visa holders, the total number of short term arrivals with this type of visa is used. As these visa types require that the holder remains employed for the duration of the visa, an employment rate of 100% is assumed.

To estimate the number of secondary jobs held by other non-resident short-term visitors, the estimated number of non-resident main job holders (excluding students and sponsored visa holders) is multiplied by the proportion of resident employed persons who hold multiple jobs sourced from the Labour Force Survey. Students and sponsored visa holders are assumed to only hold main jobs, due to the restrictions associated with these types of visa. This method assumes that the same proportion of short term visitors hold multiple jobs as for the resident employed population.

There is a time lag in the estimation of Net Overseas Migration (NOM) data. Consequently, estimates of short term visitors for the latest quarters are extrapolated by applying movements in Overseas Arrivals and Departures (OAD) data to estimates of NOM. The movements are applied after matching visa codes and reasons for journey between the NOM and OAD series.

Time periods from September 1994 to December 2005 

OAD and NOM data with both visa type and reason for journey are not available for the entire time series of the Australian Labour Account. For earlier time periods, the following data are available:

  • NOM data classified by reason for journey by visa type is available from March 2006
  • OAD data classified by reason for journey by visa type is available from September 2004
  • OAD data classified by reason for journey only is available from September 1993.

As with the current end of the NOM series, estimates for the periods prior to March 2006 are modelled from OAD data by applying movements with matching visa codes and reasons for journey category to the estimates of March 2006.

The resulting series are aggregated to students, non-students and sponsored visa holders in the same way as for the rest of the time series.

Disaggregation to industry

Jobs held by short term visitors are disaggregated to industry in the following ways:

  • Main jobs held by short term visitors (students) are disaggregated to industry using an underlying Labour Force Survey series of persons aged 15-24 attending full-time educational institutions.
  • For main jobs held by other short term visitors, underlying data from Labour Force Survey supplementary surveys which approximates tenuous employment, namely part-time employment with no leave entitlements, are used.
  • For main jobs held by short term visitors (sponsored visa holders), data from the Department of Home Affairs on the industry of the employer sponsoring the visa are used to distribute the total to industry division. Division level totals are further disaggregated to subdivision, using the tenuous employment data described above. Data from the Department of Home Affairs are not available prior to the 2005-06 financial year. For time periods prior to this, 2005-06 industry proportions are assumed to apply. 
  • Data for short term visitors on “working holiday visas” (417 and 462) is distributed to industry using published information on employers of these visa types from the Australian Taxation Office.
  • For secondary jobs held by sponsored visa holders) is assumed to apply. 

Deduct:

  • the number of jobs held by Australian residents living in Australia employed by non-resident enterprises, sourced from underlying Balance of Payments data. As most of the people involved are employed by agencies of foreign governments (consulates, embassies etc.), the deductions are made from ANZSIC subdivision 75 (Public Administration) within Division O (Public Administration and Safety). Although the Labour Force Survey would include people over the age of 15 years in this category, they are not contributing to economic activity within Australian economic territory as measured in the Australian National Accounts.
Calculation of filled jobs (household sources) by industry

The Labour Force Survey collects quarterly data on the industry of the main job held by employed persons. For each employed person, it also collects the number of secondary jobs held (second, third, fourth or more). The Labour Force Survey does not record the industry of secondary jobs. To calculate the number of filled jobs and people employed at an industry level requires the allocation of each secondary job to an industry.

This is done in the Australian Labour Account by first obtaining the total number of multiple job holders and the number of second, third and fourth jobs from the Labour Force Survey. Employed persons who indicate they hold more than four jobs are assumed to hold only four jobs, as no further information on the number of jobs actually held is available. At this stage of compilation, multiple job holders and second, third and fourth jobs are classified by the industry of main job for each employed person.

Data from the ABS Linked Employer Employee Dataset (LEED) are then used to determine the proportions of the industry of employment of second, third and fourth jobs for multiple job holders, and applied to industry of main job Labour Force Survey data. These proportions are extracted as at the end date for each quarter from the LEED, and are updated as new data points become available. Industry proportions from the earliest available LEED are applied to earlier time periods in the Australian Labour Account, and similarly the latest available proportions are applied to subsequent time periods where necessary.

Where relevant, data are sourced from information collected in the Labour Force Survey in the last month of the relevant quarter, and apportioned across the industries using the related quarterly labour force industry data. For example, estimates in the September quarter Australian Labour Account are sourced from September month Labour Force data, which are then distributed across industry divisions from the industry distribution of quarterly data captured in the August Labour Force Survey published in Labour Force, Australia, Detailed, Quarterly.

Sector of Filled Jobs

One commonly used sector classification in labour statistics is the public and private sector classification. In this classification, the public sector includes all government units, such as government departments, non-market non-profit institutions that are controlled and mainly financed by government, and corporations and quasi-corporations that are controlled by government. The private sector refers to enterprises that are not controlled by Commonwealth, state/territory or local governments (that is, any enterprise that is not part of the public sector).

The Australian Labour Account publishes estimates of private and public sector filled jobs. These are compiled by applying proportions from business sources (with data from the Economic Activity Survey representing the private sector, and data from the Survey of Employment and Earnings representing the public sector) to balanced numbers of filled jobs for each industry.
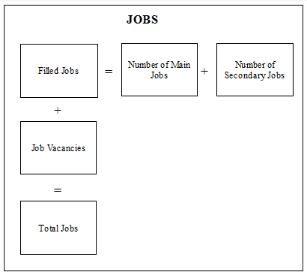
Job sharing

There is currently no household side information available on the number of jobs with job sharing arrangements. As a result, the total number of filled jobs is equivalent to the sum of reported main jobs and secondary jobs, plus scope adjustments. As with the business side, shared jobs on the household side would be counted as many times as there are people engaged in such arrangements.

Annual jobs methods

The Jobs quadrant contains stock data, which are data that measure certain attributes at a point in time. To determine an annual estimate of jobs in this quadrant, an average level is derived using a simple arithmetic average of the four quarterly estimates. Refer to Labour Account Methods for an example of this method.

The annual estimate of jobs is an approximate estimate of the number of jobs at any point in time during the year.

Job vacancies

A job vacancy is a job available for immediate filling on the survey reference date and for which recruitment action has been taken. Recruitment action includes efforts to fill vacancies by advertising, by on site or online notices, by notifying employment agencies or trade unions and by contacting, interviewing or selecting applicants already registered with the enterprise or organisation.

Estimates of job vacancies exclude:

  • jobs not available for immediate filling on the survey reference date;
  • jobs for which no recruitment action has been taken;
  • jobs which became vacant on the survey date and were filled on the same day;
  • jobs of less than one day's duration;
  • jobs only available to be filled by internal applicants within an organisation;
  • jobs to be filled by employees returning from paid or unpaid leave or after industrial disputes;
  • vacancies for work to be carried out by contractors; and
  • jobs for which a person has been appointed but has not yet commenced duty.


Total quarterly job vacancies are calculated as:

  • the sum of the number of vacant positions reported in the ABS Job Vacancies Survey for the relevant quarterly reference date/month (3rd Friday of February, May, August and November) and published in Job Vacancies, Australia (ABS cat. no. 6354.0); plus
  • the number of job advertisements from the Department of Employment, Skills, Small and Family Business Internet Vacancy Index (as at the 1st day of the third month of the reference quarter; i.e. 1 March, 1 June, 1 September, 1 December), for the following Australian and New Zealand Standard Classification of Occupations (ANZSCO) occupation codes: 12 Farmers and Managers; 36 Skilled Animal and Horticultural Workers; and 84 Farm, Forestry and Garden Workers.

Internet Vacancy Index data are added to capture vacancies available in employing enterprises primarily engaged in Agriculture, Forestry and Fishing, which are out of scope of the quarterly ABS Job Vacancies Survey.

Industry detail at the ANZSIC subdivision level is not available directly from either the ABS Job Vacancies Survey or the Department of Employment, Skills, Small and Family Business Internet Vacancy Index, and is modelled in the Australian Labour Account using the following methods:

  • For subdivisions within Division A (Agriculture, Forestry and Fishing), information from the Department of Employment, Skills, Small and Family Business Internet Vacancy Index for agricultural occupations at four digit ANZSCO level are aggregated to approximate these ANZSIC subdivisions; and
  • For all remaining subdivisions, ANZSIC division level information from the Job Vacancies Survey is disaggregated to subdivision level using data from the Labour Force Survey relating to employees by subdivision (excluding Owner Managers of Unincorporated Enterprises).

Data from the ABS Job Vacancies Survey are available on the current ANZSIC 2006 industry classification from November 2009 onwards, and data on an ANZSIC 1993 basis and the total number of job vacancies are available for earlier time periods. Data for each ANZSIC 2006 industry division for earlier time periods are estimated by applying a concordance between the ANZSIC 1993 and ANZSIC 2006 industry classifications. The known total number of job vacancies is maintained using this approach. Data at the industry division level are then distributed to industry subdivision by applying proportions from the LFS employees (excluding Owner Managers of Unincorporated Enterprises) series.

The Job Vacancies Survey was suspended for five periods between August 2008 and August 2009 inclusive, as a result of a series of cuts to the ABS forward work program. The ABS has used econometric modelling techniques using a full-time equivalent flow series to estimate total job vacancies for the missing period. It should be noted that the modelled data are not part of the Job Vacancies Survey series and are not available in the related publication or the Australian Labour Account. However, modelled data for the gap period have been used in the production of seasonally adjusted and trend time series data.

Job vacancies for each industry for the period September 2008 and September 2009 have been estimated by applying the movement from the LFS number of employees (excluding Owner Managers of Unincorporated Enterprises) to subdivision level job vacancies data on an ANZSIC 2006 basis from December 2009. These industry estimates are constrained to the modelled total number of job vacancies for this period.

Data from the Department of Employment, Skills, Small and Family Business are available from January 2006 onwards. Data for earlier time periods are estimated by applying the movement in the number of employees (excluding Owner Managers of Unincorporated Enterprises) for each Agriculture subdivision from the LFS to the 2006 level.

Jobs quadrant calculations

Jobs quadrant sources and calculations

Jobs quadrant sources and calculations
The diagram shows that: Job Vacancy Survey (ABS) data plus Internet Vacancy Index (DoE) data - Div A equals Total job vacancies QBIS data (Div K) plus EAS data (Div A and O with COE as quarterly indicator series) plus QBIS data (for remaining Divs, benchmarked to annual EAS data) equals Total filled jobs (business sources), private sector SEE data (with COE as quarterly indicator series) plus Total filled jobs (busines sources) private sector equals Total filled jobs (business sources) Industry scope adjustments (ABS) plus Defence personnel (NAB) plus Contributing family workers (LFS) plus Child workers (not working for an employer) equals Adjustments to filled jobs (business sources) Total filled jobs (business sources) plus Adjustments to filled jobs (business sources) equals Labour Account filled jobs (business sources) Labour Account filled jobs (business sources) plus Total job vacancies equals Labour Account total jobs (business sources) Labour Force Survey (LFS) main jobs (monthly) multiplied by Labour Force Survey (LFS) main jobs (quarterly industry proportions) equals Labour Account Labour Force Survey main jobs Labour Force Survey (LFS) secondary jobs (monthly) multiplied by secondary jobs proportions (LEED) equals Labour Account Labour Force Survey secondary jobs Defence personnel (NAB) plus Non residents employed in Australia adjustment (ABS) plus Child workers (all employed children) less Residents employed overseas adjustment (BoP) equals Adjustments to filled jobs (household surveys) Labour Account Labour Force Survey main jobs plus Labour Account Labour Force Survey secondary jobs plus Adjustments to filled jobs (household surveys) equals Labour Account filled jobs (household surveys) Labour Account filled jobs (business sources) less Labour Account filled jobs (household sources) equals Statistical discrepancy (jobs)
Back to top of the page