Historical background and evolution to a Monthly CPI
Introduction
3.1 Before the introduction of the Consumer Price Index (CPI) in 1960, there were five series of retail-price indexes compiled by the then Commonwealth Bureau of Census and Statistics. The most important of these was the C Series Index, which covered a range of items consumed by households and remained Australia’s principal retail price index for almost forty years. See Appendix 3.A for details on the C Series Index and other indexes produced between 1912 and 1960.
Quarterly Consumer Price Index
3.2 In 1960, a new approach was introduced. Instead of the former emphasis on long-term fixed-weighted indexes, the aim was to compile a series of shorter-term indexes that would be chain linked to form long-term series. The Consumer Price Index, commonly referred to as the CPI, was the first price index of this kind constructed in Australia.
3.3 The CPI was first compiled in 1960 with index numbers compiled back to mid-1948. Like the old indexes, the CPI was designed to measure quarterly changes in the retail prices of goods and services purchased by metropolitan wage-earning households.
3.4 At its inception in 1960, the CPI consisted of three original series linked together with changes in weights in 1952 and 1956. Weights were changed in 1960 and subsequently in 1963, 1968, 1973, 1974, 1976, 1982, 1987, 1992, 1998, 2000, 2005, 2011 and 2017. As of 2017, the CPI has been re-weighted annually. The Household Expenditure Survey (HES) is used to update the weights in the years that it is available. For the inter-HES years, Household Final Consumption Expenditure (HFCE) data from the National Accounts is used as the principal data source for re-weighting the CPI.
Monthly Consumer Price Index Indicator
3.5 In 2022 annual CPI inflation reached its highest level in 30 years, leading to increased demand from governments, economists and the wider community for more timely insights into household inflation. This led to the development of the monthly Consumer Price Index (CPI) Indicator. The ABS published an Information Paper describing the introduction of the Monthly CPI Indicator:
3.6 The ABS commenced publishing the Monthly CPI Indicator on 26 October 2022, with the first release referencing September 2022, and featuring data back to September 2017. The final release of the Monthly CPI Indicator was published on 29 October 2025.
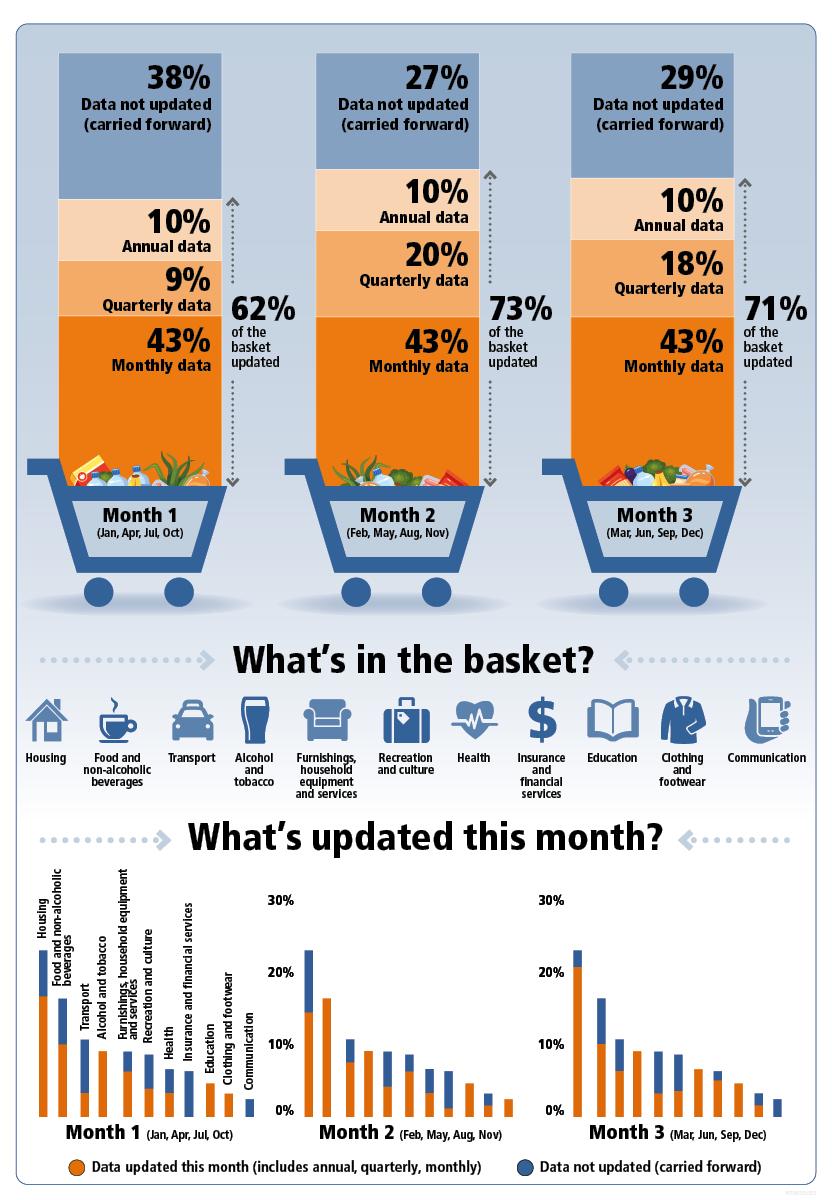
3.7 The data in the Indicator was published at the national level, derived as a weighted average of the eight capital cities. The same data collected for use in the quarterly CPI was used to compile the Indicator, meaning that prices were collected at a range of frequencies including monthly, quarterly and annually. Due to these different frequencies, initially the Indicator comprised of updated monthly prices for between 62 and 73 per cent of the weight of the quarterly CPI basket. This varied because the basket of goods priced in each month of the quarter varied, as illustrated in Figure 3.1 which is taken from the material published when the Indicator was first introduced.
Figure 3.1 Initial update frequency of the Monthly CPI Indicator
Image
Description
This infographic explains the frequency with which data was collected for the quarterly CPI, which fed into the now-discontinued Monthly CPI Indicator. Conceptually, the monthly CPI indicator included all the items of the quarterly CPI basket, however, not all items in the basket were updated with new prices each month. Where prices were not collected in a particular month, prices collected in previous months were ‘carried forward’. Where prices were updated in month 2 or 3 of any given quarter, the new prices data were not used to revise previous months in the quarter. For this reason, the average of the index in the three months for the monthly CPI indicator did not equal the index of the quarterly CPI. Including the data collected once per year: • Month 1 (January, April, July and October months) included up-to-date price information for 62 per cent of the weight of the quarterly CPI. • Month 2 (February, May, August and November months) included up-to-date price information for 73 per cent of the weight of the quarterly CPI. • Month 3 (March, June, September and December months) included up-to-date price information for 71 per cent of the weight of the quarterly CPI. All eleven groups were included in each month, with the following breakdown: Month 1: 43% monthly data, 9% quarterly data, 10% annual data, 38% data not updated (carried forward) Month 2: 43% monthly data, 20% quarterly data, 10% annual data, 27% data not updated (carried forward) Month 3: 43% monthly data, 18% quarterly data, 10% annual data, 29% data not updated (carried forward) The eleven groups of the CPI basket are: Housing Food and non-alcoholic beverages Transport Alcohol and tobacco Furnishings, household equipment and services Recreation and culture Health Insurance and financial services Education Clothing and footwear Communication
Following the first release of the monthly CPI Indicator, some series were updated to reflect price change on a monthly basis, and the proportion of the basket with up-to-date prices each month increased to between 66 and 77 per cent of the CPI basket. This is why the series is only considered an indicator.
Monthly Consumer Price Index
3.8 The ABS was given funding in the 2023-24 Federal Budget to enable the production of produce important new data, including the production of a complete monthly measure of the CPI by late 2025. Following a public consultation process, the ABS published Completely monthly measure of the CPI, detailing the changes that would occur in the transition from a quarterly to a monthly index.
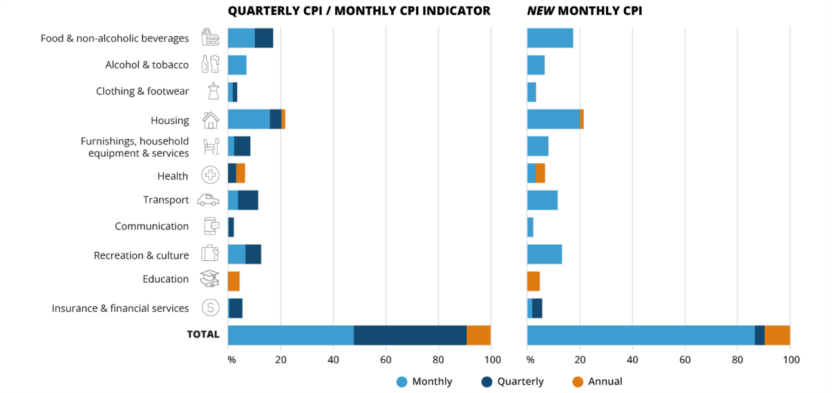
3.9 The complete Monthly CPI was first released on the 26th of November 2025, referencing the month of October 2025. This publication differs to the previously published Monthly CPI Indicator in that it has comprehensive coverage of price changes each month (noting the price of some goods and services, such as school fees, do not change monthly). The ABS increased coverage through increasing collection frequency from quarterly to monthly for most items, and integrating new data sources, such as administrative and transactions data and automated collection from websites (web-scraping). Figure 3.1 shows the change in data frequency introduced in order to meet the needs of a complete Monthly CPI, as at the time of publication of the first release.
Figure 3.2 Change in frequency of data collection for the CPI by expenditure weight
Image
Description
This infographic shows the changes to data collection frequency introduced to meet the needs of the Complete Monthly CPI. 87% of the CPI by weight is collected monthly in the complete Monthly CPI. Annual collection is used for 9% of the CPI, including health insurance, education fees and property rates. Quarterly collection is used for 4% of the CPI, in Other financial services (items such as stamp duty, real estate services and accounting services) as these prices do not tend to change frequently.
3.10 The Monthly CPI is Australia’s primary measure of headline inflation. However, the ABS continues to produce a quarterly CPI data series to support those needing quarterly CPI figures for indexation, contract, time series analysis and other purposes. The quarterly CPI is compiled for quarters ending on 31 March, 30 June, 30 September, and 31 December each year. The quarterly CPI is released within the Monthly CPI publication for the third month of each quarter, i.e. the releases for March, June, September and December each year. The quarterly data can be found within the data downloads section of the publication.
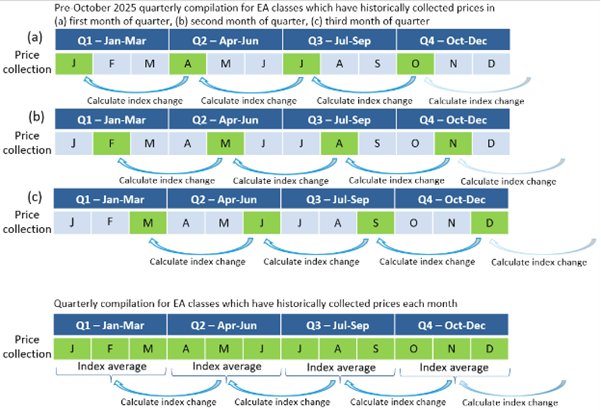
3.11 The price collection method used to compile the quarterly CPI differs to that used in the discontinued quarterly publication. The quarterly CPI is now the average of the monthly price indexes for the three months in that quarter, whereas previously, for some series, prices were collected in a single month of each quarter. The current method utilises prices for all three months of the quarter. While increasing the quality of the quarterly CPI series, for some expenditure classes this change abruptly changes the seasonal patterns in the quarterly CPI. To assist users through this period of change, for the first 18 months of publication of the complete Monthly CPI, the ABS will produce selected series quarterly CPI series under both the new and old methods. Figure 3.3 illustrates the difference between the old and new methods of quarterly index compilation.
Figure 3.3: Illustration of the pre-October 2025 quarterly price compilation
Image
Description
This infographic compares methods quarterly CPI compilation from before and after the introduction of the Complete Monthly CPI in October 2025. The pre-October 2025 compilation method for the 44 ECs with prices collected quarterly is based on collecting prices in a particular month of the quarter (i.e. first, second or third month of the quarter) and measuring the price change between this and the same month in the previous quarter. Quarterly prices in a particular EC might be measured in month 1 of each quarter (January, April, July, and October), OR month 2 (February, May, August, and November), OR month 3 (March, June, September, and December). For some ECs, the collection month may vary for different Expenditure Aggregates (EA) making up the EC, so that some EAs are measured in month 1, some in month 2, and/or some in month 3 of each quarter.
With the introduction of the Complete Monthly CPI, the average of prices collected during each of the three months of the quarter is used in calculating quarterly index change.
3.12 The quarterly series has been re-referenced to the September month 2025, meaning that the index is set to 100.0 for that month. Price indexes are published to two decimal places, replacing the convention of one decimal place used prior to October 2025, including for quarters prior to the re-referencing.
3.13 Consideration was given to the impact of the introduction of the Monthly CPI in regards to seasonal adjustment. More information can be found in Seasonal adjustment for the new complete Monthly Consumer Price Index (CPI) | Australian Bureau of Statistics.
3.14 With the introduction of the complete Monthly CPI, two new data variables were introduced. The variables are:
- Contribution to All groups CPI Percentage Points Change from Previous Period
- Contribution to All groups CPI Annual Percentage Points Change
The values for the lower level components sum to the value for the All groups CPI, providing a measure of how much each component contributed to the overall CPI movement.
Splicing of quarterly series
3.15 Following the introduction of the complete monthly CPI in 2025, commencing from the December quarter 2025, the quarterly CPI series are now derived from the monthly data. The quarterly series has 'spliced' together two distinct series at September quarter 2025:
- The quarterly index series produced prior to the publication of the complete monthly CPI.
- The quarterly index series derived from the complete monthly data by calculating the quarterly index value as the average of the three monthly index values.
3.16 The benefit of splicing series b) onto series a) is to preserve and maintain the historical quarterly time series dating back several decades, and in the case of headline CPI, back to 1948.
Splicing Method
3.17 To explain how the spliced series was developed, the following example of the Furniture expenditure class (EC) is used. The same approach applies to all ECs measured quarterly prior to the December quarter 2025.
3.18 Prior to the December quarter 2025, prices for the Furniture EC were collected on a quarterly basis in month 1 (January, April, July, October). Following the move to a complete monthly CPI, Furniture prices are collected each month. From December quarter 2025, the quarterly index for Furniture is derived as the average of the three monthly index values. This is shown below where the ‘Furniture spliced series’ appends the quarterly average index of 99.70 to the historical series. The approach prior to the change to the complete monthly CPI would have used the index from October of 102.53 as the quarterly index.
Figure 3.4 Illustration of splicing method
Image

Description
3.19 A consequence of this new approach is that from the December quarter 2025 onwards, the ‘Furniture spliced series’ index has a greater level of coverage to the historical series (‘Furniture quarterly basis’), that being, prices are collected from each of the three months, rather than only month 1. This has two implications:
3.20 The first is the impact of splicing when calculating annual movements. To calculate an annual movement in the December quarter 2025 the indexes have different levels of coverage when comparing quarters either side of the September quarter 2025 splicing period. The following table shows how the annual movement for the December quarter 2025 of -1.8% differs to the annual movement of the previous approach of 1.0%. The annual movement will continue to be impacted in this way until the June quarter 2026.
Annual movement Furniture spliced series: (99.70/101.52 -1) = -1.8%
Annual movement Furniture quarterly basis: (102.53/101.52 -1) = 1.0%
3.21 A second implication is the possible change in the seasonal pattern from moving from prices being collected every third month to every month. More details are available Seasonal adjustment for the new complete Monthly CPI.
Impact of splicing on comparisons over the splicing quarter
3.22 Price changes measured from the spliced quarterly series may differ from the values which would have been measured if series a) had continued. They may also differ from the values which would have been measured if a back series for series b) were produced. These differences reflect how the change in measurement at the splicing quarter causes a ‘statistical impact’. The impact is an unavoidable consequence of transitioning to an improved measure of the quarterly series by using the complete monthly data.
3.23 A statistical impact arises if:
- All components of the index class did not have monthly price collection before the introduction of the complete monthly CPI; and
- The price change of interest compares an index value after September quarter 2025 with an index value prior to September quarter 2025.
Example of statistical impact: Furniture EC
3.24 Revisiting the Furniture example, prior to complete monthly collection commencing, prices were collected in the Furniture EC in January, April, July and October. The price observation in October was used as the December quarter price, and so the December quarter index value was unaffected by the end-of-year discounting in the November and December months (e.g. Black Friday sales).
3.25 When measuring the change between December quarter 2024 and December quarter 2025 from the spliced series, there is a statistical impact for the Furniture EC because both conditions (i) and (ii) are satisfied. The spliced series shows a fall of almost 2% between December quarter 2024 and December quarter 2025. If series (a) or series (b) were used exclusively across the four quarters, the annual change would have been positive.
3.26 A major driver of the statistical impact in this example is that the effects of end-of-year discounting are not similarly captured in December quarter 2024 and December quarter 2025. In the spliced series, the price change from December quarter 2024 to the splice quarter (September quarter 2025) uses a December quarter 2024 index value which excludes the effect of end-of-year discounting. The change between September quarter 2025 to December quarter 2025 shows how the average December quarter price is reduced by end-of-year discounting.
Size of impact
3.27 The statistical impact is minor for many index classes. Many series which previously had quarterly price collection had relatively steady price change over the months of the quarter. The steady change in price results in very similar quarterly price change estimates using either series (a) or (b). The impact on the annual movement for headline CPI is less than plus or minus 0.1 percentage points from December quarter 2025 to June quarter 2026.
3.28 When using quarterly indexes either side of the splicing period (September quarter 2025) to calculate annual movements, or movements over a longer period of time, users should be aware of the possible statistical impact from splicing described in this chapter.
Appendix 3.A – Price indexes pre-dating the Australian CPI and historic CPI reviews
1 Before the introduction of the Consumer Price Index (CPI) in 1960, there were five series of retail-price indexes compiled by the then Commonwealth Bureau of Census and Statistics. Those indexes were as follows:
(i) The A Series Index, covering only food, groceries and housing rents (for all houses), was first compiled in 1912 with index numbers going back to 1901, and discontinued in 1938. Its main use was for adjusting wages between 1913 and 1933.
(ii) The B Series Index, covering only food, groceries and housing rents (for four and five-roomed houses), was first compiled in 1925 and discontinued in 1953. It was introduced to replace the A Series Index for general statistical purposes but was never used for adjusting wages.
(iii) The C Series Index, covering food and groceries, housing rents (for four and five-roomed houses), clothing, household drapery, household utensils, fuel, lighting, urban-transport fares, smoking and some miscellaneous items, was introduced in 1921 and discontinued in 1961. The food and rent component of the C Series Index was the same as that for the B Series Index. The C Series Index was used to adjust wages from 1934 until it was discontinued.
(iv) The D Series Index, which was derived by combining the A Series and C Series Indexes, was compiled especially for wage adjustment purposes for a short period in 1933-34.
(v) The Interim Retail Price Index, covering food and groceries, housing rents (for four and five-roomed houses), clothing, household drapery, household utensils, fuel, lighting, urban-transport fares, smoking, and some services and miscellaneous items, was first compiled in 1954 and discontinued in 1960. As the name implies, the Interim Index was intended to serve as a transitional index, but to some extent it replaced the C Series Index for general statistical purposes for a few years before 1960. It was never used for wage adjustment purposes.
C Series Index
2 By far the most important of these old price indexes was the C Series Index which was the principal retail price index in Australia for almost forty years. It was first compiled in 1921 with index numbers compiled back to 1914. C Series Index numbers were compiled for:
(i) the capital city in each of the six states
(ii) four of the larger towns in each of the six states
(iii) weighted average of five towns (including the capital city) in each of the six states
(iv) weighted average of the six state capital cities
(v) weighted average of thirty towns (including the capital cities)
(vi) three additional towns - Whyalla, Port Augusta, and Canberra.
3 The C Series Index was reviewed in 1936 and a slightly revised selection of goods and services was introduced, which then remained unchanged until the C Series Index was discontinued.
4 The main reason for the long interval without any review or change in composition of the C Series Index after 1936 was the recurrent changes in consumption patterns which occurred during and after World War II. It was considered impossible at the time to devise a revised weighting pattern which would be any more representative of post-war consumption than the existing weighting pattern of the C Series Index. The Commonwealth Statistician of the time, in successive editions of the Labour Report during the 1950’s and 1960’s, explained the absence of any re-weighting of the C Series Index in the following words.
"From the outbreak of war in 1939 to late in 1948, periodic policy changes in various wartime controls (including rationing) caused recurrent changes in consumption and in the pattern of expenditure. This rendered changes desirable but made it impracticable either to produce a new index, or to revise the old one, on any basis that would render the index more representative than it already was of the changing pattern of household expenditure in those years. When commodity rationing had virtually ceased in the latter part of 1948 action was taken by the Statistician to collect price data of about 100 additional items and to gather information as to current consumption and expenditure patterns. This was done to facilitate review of the component items and weighting system of the C Series Retail Price Index in the light of the new pattern of wage earner expenditure and consumption that appeared to be then emerging. But in the next few years there supervened conditions which caused wide price dispersion, coupled with a very rapid rise in prices and a new sequence of changes in consumption and in the pattern of wage earner expenditure. Under these conditions it was not possible to devise any new weighting pattern likely to be more continuously representative of conditions then current, than was the existing C Series Index on the 1936 revision."
5 In 1953, the decision was made to continue compiling the C Series Index on its pre-war basis, but also to compile an interim retail price index based as nearly as possible on the post-war pattern of consumer usage and expenditure. Nevertheless, the C Series Index continued to be regarded by most users as the principal official index, and was the one used in most indexation and escalation arrangements throughout the 1950s.
Interim Retail Price Index
6 The Interim Retail Price Index was based on post-war consumption weights. Compared with the C Series Index, the Interim Index covered an expanded range of items, including additional foods (such as packaged breakfast foods, soft drinks, ice cream, and confectionery) and services (such as dry-cleaning and shoe repairs). Throughout the period of its compilation, no attempt was made to revise its weights to take account of major changes in expenditure patterns and lifestyles that were occurring during the 1950s. During that decade, house renting was substantially replaced by home ownership, the use of motor cars partially replaced the use of public transport, and a variety of electrical appliances, and subsequently television, became widely used by households. During the same period, widely disparate movements occurred in the prices of different items routinely purchased by households. It was considered that the combined effect of these factors made it impracticable to introduce a comprehensive new retail price index during the period to 1960.
Long-term linked series
7 To provide an approximate long-term aggregate measure of consumer price change, for the period since the first Australian retail price index was compiled, the ABS has constructed a single series of index numbers by linking together selected retail and consumer price index series from amongst those described above (see Table 3.1). For this particular series, the index numbers are expressed with an index reference base of 1945 equals 100.0 which was the end of a period of price stability during World War II. The successive series linked together to produce this long-term series of index numbers are:
- from 1901 to 1914, the A Series Retail Price Index
- from 1914 to 1946-47, the C Series Retail Price Index
- from 1946-47 to 1948-49, a combination of the C Series Index, excluding the housing group of the CPI
- from 1948-49 onwards, the CPI.
8 This long-term series of index numbers is updated each year. A graph of the series taken from Table 3A.1 is presented in Figure 3A.1.
| Year | Index | Year | Index | Year | Index | Year | Index |
|---|---|---|---|---|---|---|---|
| 1901 | 47 | 1932 | 74 | 1963 | 252 | 1994 | 1989 |
| 1902 | 50 | 1933 | 71 | 1964 | 258 | 1995 | 2082 |
| 1903 | 49 | 1934 | 73 | 1965 | 268 | 1996 | 2136 |
| 1904 | 46 | 1935 | 74 | 1966 | 276 | 1997 | 2141 |
| 1905 | 48 | 1936 | 75 | 1967 | 286 | 1998 | 2159 |
| 1906 | 48 | 1937 | 78 | 1968 | 293 | 1999 | 2191 |
| 1907 | 48 | 1938 | 80 | 1969 | 302 | 2000 | 2289 |
| 1908 | 51 | 1939 | 82 | 1970 | 313 | 2001 | 2389 |
| 1909 | 51 | 1940 | 85 | 1971 | 332 | 2002 | 2462 |
| 1910 | 52 | 1941 | 89 | 1972 | 352 | 2003 | 2530 |
| 1911 | 53 | 1942 | 97 | 1973 | 385 | 2004 | 2588 |
| 1912 | 59 | 1943 | 101 | 1974 | 443 | 2005 | 2658 |
| 1913 | 59 | 1944 | 100 | 1975 | 510 | 2006 | 2753 |
| 1914 | 61 | 1945 | 100 | 1976 | 579 | 2007 | 2817 |
| 1915 | 70 | 1946 | 102 | 1977 | 650 | 2008 | 2940 |
| 1916 | 71 | 1947 | 106 | 1978 | 702 | 2009 | 2994 |
| 1917 | 75 | 1948 | 117 | 1979 | 766 | 2010 | 3079 |
| 1918 | 80 | 1949 | 128 | 1980 | 844 | 2011 | 3181 |
| 1919 | 91 | 1950 | 140 | 1981 | 926 | 2012 | 3237 |
| 1920 | 103 | 1951 | 167 | 1982 | 1028 | 2013 | 3316 |
| 1921 | 90 | 1952 | 196 | 1983 | 1132 | 2014 | 3399 |
| 1922 | 87 | 1953 | 205 | 1984 | 1177 | 2015 | 3450 |
| 1923 | 89 | 1954 | 206 | 1985 | 1257 | 2016 | 3494 |
| 1924 | 88 | 1955 | 211 | 1986 | 1370 | 2017 | 3562 |
| 1925 | 88 | 1956 | 224 | 1987 | 1487 | 2018 | 3630 |
| 1926 | 90 | 1957 | 229 | 1988 | 1594 | 2019 | 3689 |
| 1927 | 89 | 1958 | 233 | 1989 | 1714 | 2020 | 3720 |
| 1928 | 89 | 1959 | 237 | 1990 | 1839 | 2021 | 3826 |
| 1929 | 91 | 1960 | 245 | 1991 | 1898 | 2022 | 4079 |
| 1930 | 87 | 1961 | 252 | 1992 | 1917 | 2023 | 4307 |
| 1931 | 78 | 1962 | 251 | 1993 | 1952 | 2024 | 4443 |
- Base: Calendar Year 1945 = 100.0.
- The index numbers relate to the weighted average of six state capital cities from 1901 to 1980 and to the weighted average of eight capital cities from 1981. Index numbers are for calendar years.
- Any discrepancies with movements published in the CPI are due to different index reference periods and rounding.
Historic reviews of the CPI
9 Before the 17th Series CPI, the 16th Series CPI introduced in the September quarter 2011 was a major review. The item weights were revised in line with expenditure patterns identified in the 2009-10 Household Expenditure Survey (HES). As well as updating the weights in the CPI basket, the review looked at the uses, concepts and purpose of the CPI and confirmed the principal purpose of the CPI is to measure inflation faced by households to support macroeconomic policy decision making. As part of the 16th series review, the ABS published a number of Information Papers, describing the review and re-weight process including issues considered, and outcomes including changes from the previous series:
- Issues to be considered during the 16th Series Australian Consumer Price Index Review, Dec 2009
- Outcome of the 16th Series Australian Consumer Price Index Review, Dec 2010
- Information Paper: Introduction of the 16th Series Australian Consumer Price Index, 2011.
10 The 15th Series CPI introduced in the September quarter 2005 was a minor review. The item weights were revised in line with expenditure patterns identified in the 2003-04 Household Expenditure Survey (HES) and a new sub-group called Financial services was introduced into the CPI. The ABS published an Information Paper describing the changes:
11 The 14th Series CPI was introduced in the September quarter 2000, after a minor review completed early in 2000. The changes introduced in the 14th series were considered necessary to address issues arising from the introduction of The New Tax System (TNTS) on 1 July 2000. As part of the review process the ABS published two Information Papers describing the changes:
- Information Paper: Price Indexes and The New Tax System, 2000
- Information Paper: Introduction of the 14th Series Australian Consumer Price Index, 2000.
12 The 13th Series CPI, which followed a major review of the index, was introduced in the September quarter 1998. Several important changes were made to the index at that time. Prior to the September quarter 1998, the CPI was compiled primarily to be used for income adjustment through wage indexation. This had implications for the coverage and design of the index. It was limited to the expenditures made by households whose principal source of income was wages. It measured out-of-pocket living expenses, including mortgage interest payments.
13 Since the September quarter 1998, the principal purpose of the CPI has been to measure inflation faced by households to support the operation of macroeconomic policy decision making. The CPI covers the expenditure of all households (not just those whose principal source of income is wages, as was the case before 1998) and measures the changes in the prices of a basket of goods and services acquired each period. The cost of housing is measured as the price of a new dwelling (excluding land) purchased for owner-occupied purposes. Mortgage interest payments are excluded from the CPI.
14 As part of the 13th Series review, the ABS published three Information Papers: