National Ocean Account, Experimental Estimates methodology

Latest release
Reference period
November 2022

Overview

The Department of Climate Change, Energy, the Environment and Water (DCCEEW), and the Australian Bureau of Statistics (ABS) have partnered to develop Australia’s first National Ocean Ecosystem Account (the National Ocean Account). The National Ocean Account aims to support decision making about the sustainable use and management of blue carbon ecosystems that underpin Australian marine industries.

This account represents the second phase in the development of the National Ocean Account following the first phase released in August 2022.

Concepts

The National Ocean Account is part of a suite of environmental-economic accounts produced by the ABS based on the United Nations System of Environmental-Economic Accounting (SEEA). The SEEA framework extends the boundaries of the System of National Accounts (SNA) to include environmental resources, which occur outside economic production boundaries measured by the SNA.

The ecosystem accounts are based on the SEEA Ecosystem Accounting (SEEA EA) framework. This framework uncovers the interactions between ecosystems and the economy by looking at ecosystems and their contribution to human well-being in the form of identifiable ecosystem services.

For the National Ocean Account the tables align with the SEEA EA where possible. Where data is unavailable to complete the tables, 'Not Available' (na) has been used to maintain the SEEA account framework.

Ocean ecosystem accounts

The Earth’s coastal and marine areas are an essential source of resources that support the economy and other human activity while also being critical to the climate and the health of global ecosystems. Most ecosystem services are public goods that do not have clear market prices to allow their valuation. An advantage of applying an accounting framework is that it allows the contributions of ecosystems to be expressed in financial terms.or 

Ocean accounts provide a standardised and consistent framework for the integration of data to enable the measurement of progress towards local, national, and global priorities. The accounts can inform on a range of ocean related policies and generally support the management of a healthy and resilient ocean, integrating biodiversity into planning, and going “Beyond GDP” to produce more holistic statistics and indicators to measure the contribution of oceans to society and the economy. Ocean ecosystem accounts can include ecosystems that are entirely marine, estuarine, or coastal, including but not limited to the intertidal zone.

Scope

The scope of phase 2 of the National Ocean Account includes ecosystem extent accounts for saltmarsh and intertidal seagrass, carbon sequestration and carbon stock accounts for saltmarsh and coastal protection service accounts for saltmarsh and mangroves. The production of kelp accounts was investigated during the development of phase 2 of the National Ocean Account. However, there was insufficient data available to produce reliable national kelp accounts at the time of release.

Table 1 outlines the accounts included in phase 2 of the release in November 2022.

Table 1: Components of the National Ocean Account, Phase 2
SaltmarshIntertidal SeagrassKelp
Extent by Land UseExtentna
Carbon stocknana
Carbon sequestrationnana
Coastal protectionnana
Valuation of coastal protectionnana


Asset accounts

Extent accounts

Ecosystem extent accounts describe the extent of the various ecosystem types present in an accounting area and how the extent changes within the accounting period (SEEA, EEA, Section 14.20). The accounts record the total area of each ecosystem classified by type within a specified area.

Carbon stock accounts

Carbon stock accounts record the amount of carbon stored within an ecosystem in an accounting area and describe how totals have changed within the accounting period.

Ecosystem services accounts

Ecosystem services accounts show the contributions of ecosystems to benefits used in economic and other human activity. Ecosystem services are central to the ecosystem accounting framework since they provide the link between ecosystem assets on the one hand, and the benefits derived and enjoyed by people on the other.

Carbon sequestration services

Carbon sequestration service accounts describe the gross amount of carbon dioxide equivalent sequestered by an ecosystem in an accounting area over an accounting period. The total sequestration is split according to carbon sequestered in soil and vegetation.

Coastal protection services

Physical

Coastal protection services, physical accounts describe the length of coastline, count of dwellings, and number of people afforded protection by various ecosystems from storm surge within the accounting period.

Valuation

Coastal protection services, valuation accounts describe the cost of seawall construction and cost to annually service the seawall as an economic replacement cost for the services provided by the ecosystem within the accounting period.

Ecosystems

Saltmarsh

Saltmarsh are coastal wetlands that are regularly inundated with tidal sea water and consist of salt tolerant species of grasses and herbs. Saltmarshes are found in temperate, subtropical and some tropical climatic regions and provide coastal protection by stabilising sediments and reducing wave action. Saltmarsh provide important habitat for small fish and invertebrates as well as grounds for feeding and roosting by migratory birds.

Intertidal seagrass

Seagrass are flowering plants that grow underwater. They have roots, horizontal stems (rhizomes), vertical branches and leaves (usually green) for photosynthesis. Seagrass are an important food source for marine animals such as dugongs and turtles, and provide important habitat for fisheries. Seagrass grow on all types of substrates in temperate to tropical climatic regions in the intertidal, subtidal or deep-water zones. Intertidal seagrass refers to seagrass that is present in the area of coastline between the high and low tide marks.

Mangroves

Mangroves are coastal wetlands that are regularly inundated with tidal sea water comprised of salt tolerant woody shrubs and trees. Mangroves are found in tropical and subtropical climatic zones and provide coastal protection by stabilising sediments and reducing wave action. Mangroves are important breeding grounds and habitat for fish and other marine life.

Kelp 

Kelp are fast growing large brown algae which grow in cool shallow, near shore, waters. Kelp grow in a dense ‘forest like’ manner and provide food and shelter to marine life in the ecosystem. Kelp is a non-taxonomic name used for large, brown, macroalgae belonging to the Order Laminariales, however the definition can be expanded to include other habitat forming large, brown, macroalgae in the Order Fucales (see Layton, et al., 2020).

Land use

Land use reflects both the activities undertaken and the institutional arrangements put in place for a given area for the purposes of economic production, or the maintenance and restoration of environmental functions (SEEA Technical Note: Land Accounting, Section 17). Table 2 provides the definitions for each land use present in the National Ocean Account.

Table 2: Land use classes used in National Ocean Account
Land UseDescription
Nature conservationProtected areas managed mainly for science, wilderness protection, conservation of specific natural features or species management. Also includes national parks, heritage agreements, voluntary conservation arrangements, registered property agreements, and recreation areas with primarily native cover.
Managed resource protectionThese areas are managed primarily for the sustainable use of natural resources. This includes areas with largely unmodified natural systems that are managed primarily to ensure the long-term protection and maintenance of biological diversity, water supply, aquifers or landscapes, while providing a sustainable flow of natural products and services.
Other minimal useAreas of land that are largely unused (in the context of the prime use) but may have ancillary uses. This may be a deliberate decision by the land manager or the result of other circumstances. The land may be available for use but remain unused for various reasons.
Grazing native vegetationLand uses based on grazing by domestic stock on native vegetation where there has been limited or no deliberate attempt at pasture modification. Some change in species composition may have occurred. This class is used when there is greater than 50 per cent dominant native species.    
Production native forestsCommercial production from native forests and related activities on public and private land.
Grazing modified pasturesLand used for pasture and forage production, both annual and perennial, based on significant active modification or replacement of the initial vegetation.
Plantation forestsLand on which plantations of trees or shrubs (native or exotic species) have been established for production, or environmental and resource protection purposes. This includes farm forestry.
Dryland croppingLand that is under cropping but where no irrigation is used. Crops include cereals, beverage and spice crops, hay and silage, oilseed, sugar, cotton, and pulses.
Dryland horticultureLand used for crop plants that are intensively cultivated, usually involving a relatively high degree of nutrient, weed and moisture control. Includes fruit trees, vine fruits, shrub berries and vegetables.
Irrigated pasturesLand used for irrigated pasture production, both annual and perennial, based on a significant degree of modification or replacement of the native vegetation. Includes irrigated woody fodder plants, legumes and grasses.
Irrigated croppingLand under irrigated cropping. Crops include cereals, beverage and spice crops, hay and silage, oilseeds, sugar, cotton, and pulses and irrigated cereal crops which are cut for straw.
Irrigated horticultureLand used for irrigated crop plants that are intensively cultivated, usually involving a relatively high degree of nutrient, weed and moisture control. Includes land under netting to protect crops from hail or birds.
Urban intensive usesLand within urban areas with residential or industrial infrastructure. Includes manufacturing and industrial sites, urban residential areas and land allocated to providing commercial or public services resulting in substantial interference to the natural environment (cemeteries, sportsgrounds, land used by energy utilities, airports, railways). It also includes land which is zoned for urban residential development where houses or apartments have not yet been constructed but infrastructure, such as roads and street lights, is in place and it is clear that the intended land use is urban residential.
Intensive horticulture and animal productionLand used for intensive forms of plant or animal production often with special purpose improvements used for production. Includes nursery stock grown in containers, shadehouses or glasshouses, and animal sheds and yards. Also includes land used for cultivating fish and crustaceans (aquaculture).
Rural residential and farm infrastructureLand within rural areas with houses and or other residential infrastructure with or without associated agricultural activity. Includes remote communities (less than 20 residences or buildings), farm buildings and other farm infrastructure. Rural residential generally refers to areas with blocks larger than 0.2ha located in a rural setting (away from the main urban setting).
Mining and wasteLand from which minerals, precious stones and coal is being extracted (open cut and deep-shaft mines, quarries and tailings dumps and dams) and land associated with waste disposal activities (landfills, incinerators, sewerage infrastructure and effluent ponds).
WaterLand used for water includes lakes (natural or human-made bodies of mainly static water surrounded by land), reservoirs and dams, rivers, wetlands and estuaries. It also includes artificial open channels which provide the supply, distribution or removal of water for irrigation purposes, or for a significant infrastructure function (such as salt interception, land reclamation, or drainage between water features for environmental management purposes). 
No DataArea with no land use classification available

Data sources

Saltmarsh

Saltmarsh data was sourced from an early draft of an experimental earth observation based product commissioned from James Cook University by the Clean Energy Regulator and supplied to the ABS.

The product is built from USGS Landsat 8 Level 2, Collection 2, Tier 1 observations with each cell given a binary saltmarsh present/saltmarsh absent classification. 

The model is in active development and there are known limitations in areas where training data is hard to access and potential misclassification in non-saltmarsh areas that are regularly inundated. Accordingly, pre- and post- classification filters were applied to the data by James Cook University researchers, including masking out areas based on tidal probability and removing isolated pixels. The 95% Confidence Interval for total extent of saltmarsh calculated from the national level data set was 722,486 - 1,346,200 ha. This is the confidence interval for the data at its source resolution and without any account pre-processing applied (see Spatial Pre-processing under “Methods”) and does not directly apply to the total extent reported in the accounts.

Intertidal seagrass

Intertidal seagrass data was sourced from an experimental earth observation based product commissioned from the University of New South Wales by DCCEEW and supplied to the ABS.

The product is built from a multi-temporal mosaic of Sentinel-2 Collection 2A satellite imagery with each 10m pixel modelled for given a modelled seagrass occurrence probability value from 0 to 1 indicating the likelihood of seagrass occurring in the pixel. A value of 0.7 was used as the threshold for seagrass to be considered present in the cell. The threshold of 0.7 was selected to balance commission and omission errors in the presence/absence classifications. Using an Australia-wide dataset, a non-parametric confidence interval was calculated for the presence/absence map at the 0.7 threshold. Using this confidence interval, area multipliers are 3.38% for the upper 95% area and 9.68% for the lower 95% area.

Mangroves

Mangrove data was sourced from Geoscience Australia (GA)/Digital Earth Australia (DEA) Mangrove Canopy Cover product. This product provides information about the extent and canopy density of mangroves for each year between 1987 and 2021 for the entire Australian coastline. The product is built from earth observation data (the Joint Remote Sensing Research Program Landsat fractional cover) with a resolution of 30m. Canopy class predictions are only made for areas within the Global Mangrove Watch layers developed by the Japanese Aerospace Exploration Agency. Only data for 2021 was used in phase 2 of the National Ocean Account.

Carbon stocks

The dataset used in Young et al. (2020) was used to model carbon stocks. The data is raster data at a 100m resolution, with one raster providing the ecosystem and another providing the megagrams (tonnes) of carbon stored.

Land use

The 2015-16 National scale land use data from the Australian Bureau of Agricultural and Resource Economics and Sciences (ABARES) provides a spatial representation of how Australia’s land resources are used at a 250m resolution.

Population and dwellings

Census mesh block counts provided the usual resident population and total dwelling count per mesh block from the 2021 Census.

Length of coastline

The GA DEA coastlines product was used to determine Australia’s coastline, which includes both the mainland and all islands. The 2020 annualised shoreline was used as it was the most recent finalised shoreline. 

Methods

Statistical geography

The statistical geography for the accounts was developed to provide consistency and to facilitate alignment of input datasets. All data was on An Australia Albers Equal Area Projection using the GDA 94 datum.

The National Ocean Ecosystem Account is presented at a range of geographic scales, including:

  • national,
  • state, and
  • regional ecological boundaries.

State and territory boundaries

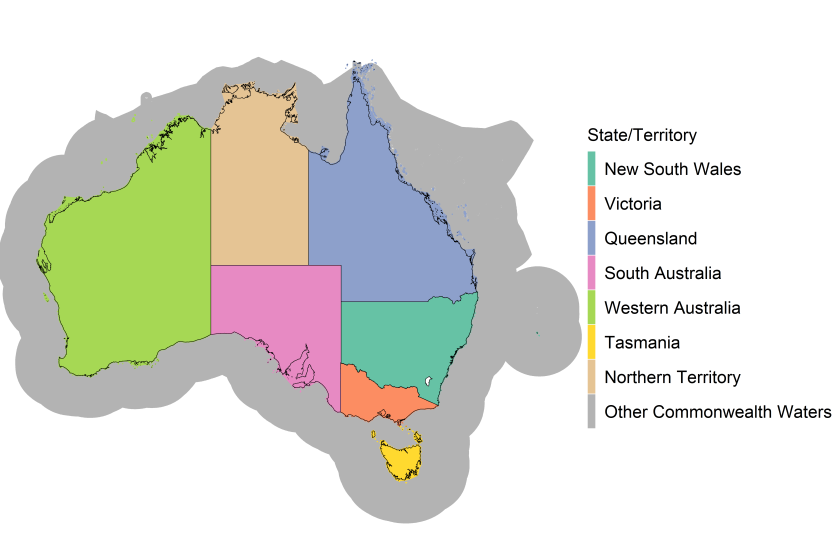
A spatial layer for State and Territory boundaries was built using the Seas and Submerged Lands Act 1973 - Australian Maritime Boundaries 2020 and the Coastal Waters (State/Territory Powers) Act 1980 - Australian Maritime Boundaries 2020. State and Territory boundaries were defined by the spatial layer provided for the Coastal Waters (State/Territory Powers) Act 1980 and remaining areas that fell outside these boundaries but within the boundaries defined in the Seas and Submerged Lands Act 1973 – Australian Maritime Boundaries 2020 were allocated to Other Commonwealth Waters. Jervis Bay does not appear in the spatial layer for the Coastal Waters (State/Territory Powers) Act 1980 and was manually added to the dataset. For consistency with the National Land Account and the National Land Cover Account figures for Jervis Bay have been included in New South Wales totals. State/Territory waters extend approximately 3 nautical miles from the terrestrial boundary and are shown in in figure 1.

Figure 1: State, Territory, and Other Commonwealth Waters

A map of Australia showing the state and territory coastal water boundaries in different colours. Waters that fall outside state coastal water boundaries but within the Australian maritime boundaries are classified as Other Commonwealth Waters, and are shown in grey.
A map of Australia showing the state and territory coastal water boundaries in different colours. The land area of each state is fully coloured in with the colour extending out into the areas of ocean allocated to the state in the account. In general, this is approximately 3 nautical miles from the coast. In South Australia Spencer and St Vincent Gulfs are fully coloured in the same colour used to identify South Australia (pink). Waters that fall outside state coastal water boundaries but within the Australian maritime boundaries are classified as Other Commonwealth Waters and are shown in grey.

Primary sediment compartments

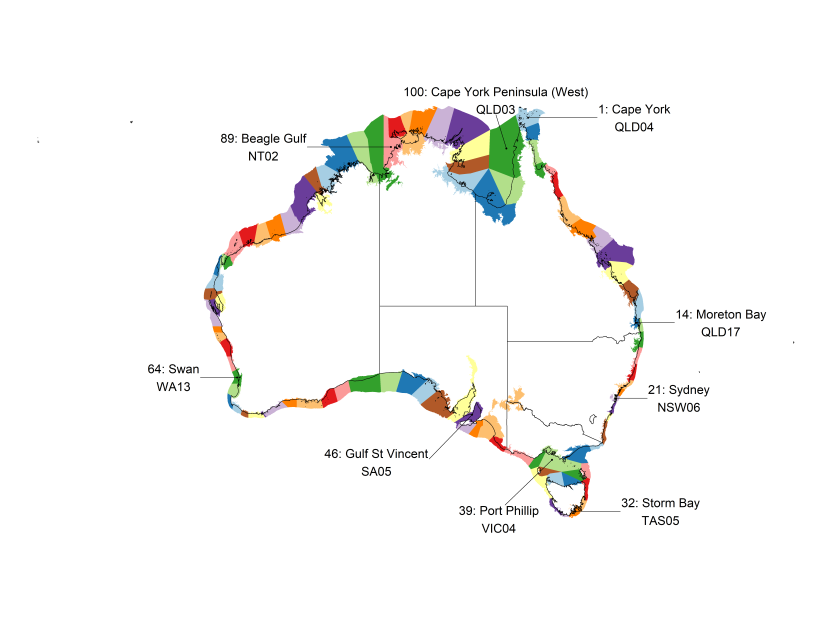
Based on user consultation, reporting based on ecological boundaries rather than administrative boundaries was determined to be the most appropriate division. Due to the spatial extent of the ecosystems in these accounts, a regional geography that encompassed both terrestrial and marine environments was required. Geoscience Australia’s Primary sediment compartments have been determined to be the most relevant divisions for substate reporting (figure 2). The data can be downloaded from Geoscience Australia

The Primary Coastal Sediment Compartment data set represents a regional (1:250 000 - 1:100 000) scale compartmentalisation of the Australian coastal zone into spatial units within (and between) which sediment movement processes are considered to be significant at scales relevant to coastal management. The data set was generated and attributed using expert panel knowledge of coastal geomorphology and processes, and represent compartment boundaries along the coast. Environmental attributes used to determine the location of compartment (point) boundaries are given in priority order below.

  1. Gross lithological/geological changes (e.g. transition from sedimentary to igneous rocks).
  2. Geomorphic (topographic) features characterising a compartment boundary (often bedrock-controlled) (e.g. peninsulas, headlands, cliffs).
  3. Dominant landform types (e.g. large cuspate foreland, tombolos and extensive sandy beaches versus headland-bound pocket beaches).
  4. Changes in the orientation (aspect) of the shoreline.

Figure 2: Primary sediment compartments

Plot showing primary sediment compartments
Plot showing primary sediment compartments with Australian state borders overlayed. Moving around Australia clockwise from Cape York the following sediment compartments are labelled: 1: Cape York (QLD04) of the northernmost point of Australia 14: Moreton Bay (QLD17) which includes Brisbane 21: Sydney (NSW06) which includes Sydney 32: Storm Bay (TAS05) which includes Hobart 39: Port Phillip (VIC04) which includes Melbourne 46: Gulf St Vincet (SA05) which includes Adelaide 64: Swan (WA13) which includes Perth 89: Beagle Gulf (NT02) which includes Darwin 100: Cape York Peninsula (West) (QLD03) which is immediately west of the northernmost point of Australia

Combined state/territory and primary sediment compartments

A combined state/territory and primary sediment compartment layer was created by intersecting the primary sediment compartment layer with the state/territory layer. This combined layer was used when calculating zonal statistics. Where there were gaps in the resulting layer due to low tide elevations manual assignment to regions was performed. 

Where account data was in a gridded (raster) format the combined state/territory and primary sediment compartment layer was rasterised using the centroid approach for boundary cells.

Spatial pre-processing

All spatial datasets and geography layers were projected on an Australia Albers Equal Area Projection using the GDA 94 datum (EPSG:3577).

Saltmarsh

The saltmarsh spatial data was warped using a mode resample to be consistent with the 30m resolution of the DEA Mangrove raster. Cells in the saltmarsh raster that indicated saltmarsh was present that were also coded as mangrove present in the 2021 DEA mangrove raster were treated as saltmarsh absent to maintain consistency between the two ecosystem accounts and prevent double counting of extent area.

Intertidal seagrass

The intertidal seagrass raster was masked according to the DEA NIDEM Intertidal Extent that was resampled to match the 10m resolution of the seagrass occurrence probability raster, with only probability values for cells in the confirmed intertidal range retained. Probability values were dichotomised such that cells with a likelihood probability values of less that 0.7 assigned a value of 0 ('seagrass absent') and equal to or greater than 0.7 a value of 1 ('seagrass present').


Extent

Saltmarsh

Estimates of saltmarsh extent by land use were calculated by spatially intersecting saltmarsh extent data provided by James Cook University and the national scale land use data from the Australian Bureau of Agricultural and Resource Economics and Sciences (ABARES). Land use cells within the extent of the saltmarsh spatial data that did not have a classification were recoded to “No data”. Saltmarsh by land use accounts were created by aggregating the intersecting area of saltmarsh extent and land use category by primary sediment compartments or state/territory.


Intertidal seagrass

The intertidal seagrass extent stock position was calculated by cross tabulating the seagrass presence/absence data with a rasterised version of the state/territory and primary sediment compartment geography layer. The stock position was calculated by summing the count of seagrass present cells in the relevant region and multiplying by 100 to convert to total area in square meters before converting to hectares for the final accounts.

As the product is experimental in nature and training data was limited in certain areas some sediment compartments were excluded from the accounts. This exclusion was based on a combination of a) no data reported for the sediment compartment in the August 2022 release of the National Ocean Account and/or b) there being no historical records. Consideration was also given to expert supported anecdotal evidence of seagrass in the area. Recherche, King Island, and Northwest Tasmania primary sediment compartment data were also excluded due to limitations in the existing intertidal mask, although some seagrass is historically reported in these sediment compartments.

Coastal protection

Physical

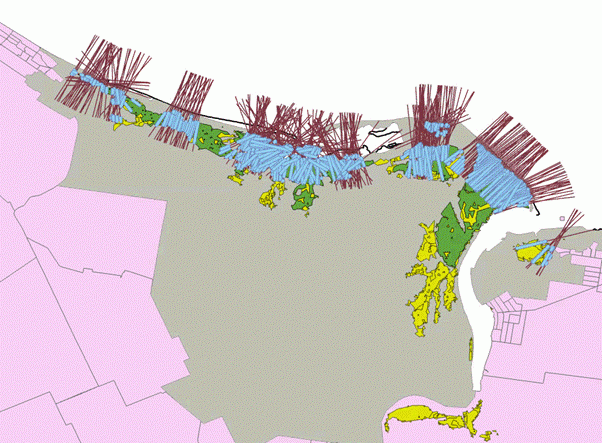
A model has been used to determine coastal protection offered by saltmarsh and mangrove ecosystems. Saltmarsh and mangroves that were within 200m of the coastline and had a defined belt width (perpendicular to the coast) of at least 40m for saltmarsh and at least 90m for mangroves, were assumed to provide coastal protection services. The protection afforded by these ecosystems was considered to be up to 1km from the coastline. Figure 3 shows for illustrative purpose how mangroves were determined to be in scope for coastal protection services.

Figure 3 shows a section of coastline highlighting mangroves that were considered to provide coastal protection in blue. Yellow is total extent of mangroves in the area, green is mangrove forests with a belt width of at least 90m, and the purple lines are transects that extend 1km inland from the coast. Any meshblocks that the purple lines intersect are included in the count of coastal protection for people and dwellings.

Figure 3: Diagram of the coastal protection model used

A section of coastline with mangroves present and 1 kilometre transect lines running perpendicular to the coast to select in scope mangroves.
The image is showing a section of Australia's coastline highlighting mangroves that were considered to provide coastal protection and meshblocks (that contain dwelling and people counts) being offered coastal protection by these mangroves. This image shows extent of mangroves along with mangroves that are at least 90 metres in width and are therefore considered to be offering coastal protection. The image also shows perpendicular transect lines that extend 1km inland from the coast. Any meshblocks that intersect the transect lines are included in the count of coastal protection for people and dwellings.
Length of coastline protected

Length of coastline protected was calculated by spatially clipping DEA’s annualised coastline that runs along saltmarsh and/or mangroves that are defined to be in scope for coastal protection. The accuracy of the length of coastline depends on the scale of the maps used to make the determination. Length of the coastline protected includes both mainland coastline and the length of all islands.

More information on total length of Australia's coastline as reported by Geoscience Australia can be found here Coastline lengths.

Number of dwellings and people protected

This metric is a count of the people and number of dwellings that are afforded protection by saltmarsh and/or mangroves. The count of dwellings and people protected is calculated from the dwelling and population counts of the meshblocks that were within 1km of the coastline and behind the in-scope saltmarsh and/or mangrove extent (as shown in figure 3). The number of dwellings and people in these meshblocks was summed for each state and territory to give region level accounts. Some meshblocks are very large and cover more than the 1km radius considered in scope, in these cases there may be an overcount of dwellings and population protected.

Data for dwelling count and population count came from the 2021 census. The person count was based on Persons Usually Resident. This is the count of people who usually reside in that meshblock, which may or may not be where they were on Census Night.

For the dwelling count, a dwelling was defined as a structure which is intended to have people live in it, and which is habitable on Census Night. Unoccupied private dwellings are also counted with the exception of those in caravan parks, marinas and manufactured home estates.

Monetary

Service replacement cost

The cost to replace the service provided by the ecosystem is a recommended valuation technique in the United Nations SEEA Ecosystem Account standards (paragraphs 9.50-9.51) and was endorsed through user consultation as a suitable measurement of the ecosystem service. A model that estimates the value of coastal protection provided by saltmarsh and mangroves has been created by estimating the cost to build and maintain infrastructure that would provide the same service.

The total replacement cost is estimated as the per meter cost of seawall construction, multiplied by the length of coastline that currently receives coastal protection services from saltmarsh and/or mangroves.

The service replacement cost is estimated as the estimated annual capital depreciation of seawall infrastructure that would provide a similar service. A straight line depreciation model has been assumed. 

Due to the variable nature of the coastline and seawall construction options a range of per metre values have been used based on estimates provided by Ware and Banhalmi-Zakar (2017), which were increased in line with the Producer Price Index to produce 2021 values. A mean of these values was used to simplify the model, producing a per metre value of seawall construction of $11,600. Expected lifespan values of between 25 and 100 years were used, resulting in a minimum and maximum annual services value estimate. The mean estimated cost is based on a lifespan of 62.5 years.

Carbon stock

Saltmarsh

Carbon stocks in saltmarsh ecosystems were calculated by multiplying the average tonnes of carbon (tC) per hectare in a sediment compartment in the data used by Young et al. (2021) by the total saltmarsh extent in the sediment compartment as recorded in the accounts. Where carbon stock data was not available for a sediment compartment the average tC per hectare was imputed.

Sequestration

Saltmarsh

Carbon sequestration of saltmarsh has been calculated using BlueCAM. BlueCAM uses Australian data to estimate abatement from carbon and greenhouse gas sources and sinks arising from coastal wetland restoration (via tidal restoration) and aligns with the Intergovernmental Panel for Climate Change guidelines for national greenhouse gas inventories. BlueCAM includes carbon sequestered in soils and biomass and avoided emissions from alternative land uses (Lovelock, Adame et al. 2022). Gross sequestration in soils and biomass was calculated on a per sediment compartment by state basis using the extent reported in the accounts. Avoided emissions from alternative lands uses were not included. Carbon sequestration in this account is gross carbon sequestration and expressed in tonnes of carbon dioxide equivalent per year (tCO2e yr-1). 

Glossary

Additions

An increase in the area or value of the stock within an ocean ecosystem. The change could be due to increase in extent, density, persistence, or value being measured.

BlueCAM

Is a carbon accounting model developed by the Clean Energy Regulator (CER) that uses Australian data to estimate abatement from carbon and greenhouse gas sources and sinks arising from coastal wetland restoration (via tidal restoration). Technical documentation is available from the CER

Blue carbon ecosystem

The term ‘blue carbon ecosystem’ recognises the ability of coastal and marine ecosystems to capture and store large amounts of carbon in their soils, roots and plants making them a significant ‘carbon sink’.

Carbon dioxide equivalent (CO2e)

Greenhouse gases include carbon dioxide, methane, nitrous oxide and others. Carbon dioxide equivalent is a standardised measure used to represent emissions or sequestration of various greenhouse gases based on their global warming potential compared to carbon dioxide. 

Carbon sequestration

Carbon sequestration refers to the process of capturing, removal and storage of carbon from the earth's atmosphere. Gross carbon sequestration refers to the total carbon sequestered by the ecosystem and does not account for the carbon that the ecosystem emits. Carbon sequestration in this account refers to gross carbon sequestration.

Closing stock

Physical stock at the end of the reference period.

Hectare

A unit of area equal to 10,000 square metres.

Opening stock

Physical stock at the beginning of an accounting period.

Reductions

A decrease in the area or value for the stock within an ocean ecosystem. The change could be due to decrease in extent, density, persistence, or value being measured.

Abbreviations

Show All

$dollar
$mmillion dollars
'000thousands
ABARESAustralian Bureau of Agricultural and Resource Economics and Sciences
ABSAustralian Bureau of Statistics
BlueCAMBlue Carbon Accounting Model
CERClean Energy Regulator
DCCEEWDepartment of Climate Change, Energy, the Enviroment and Water
DEADigital Earth Australia
EEZExclusive economic zone
EPSGEuropean Petroleum Survey Group
GAGeoscience Australia
GDPGross Domestic Product
GDAGeocentric Datum of Australia
hahectare
MtCMillion tonnes of carbon
No.Number of
Ocean PanelHigh Level Panel for a Sustainable Ocean Economy
OPGGSAOffshore Petroleum and Greenhouse Gas Storage Act
SEEASystem of Environmental Economic Accounting
SEEA CFSystem of Environmental Economic Accounting Central Framework
SEEA EASystem of Environmental Economic Accounting - Ecosystem Accounting
SNASystem of National Accounts
TBDTo be determined
tCO2e yr-1Tonnes of carbon dioxide equivalent per year

References

Geoscience Australia (2022). DEA Mangrove Canopy Cover (Landsat). https://cmi.ga.gov.au/data-products/dea/634/dea-mangrove-canopy-cover-landsat

Layton, C, Coleman, M. A., Marzinelli, E. M., Steinberg, P, D., Swearer, S. E., Vergés, A., Wernberg, T., & Johnson, C. R. “Kelp Forest Restoration in Australia.” Frontiers in Marine Science 7 (2020). https://doi.org/10.3389/fmars.2020.00074.

Lovelock, C. E., Adame, M.F., et al. (2022). "An Australian blue carbon method to estimate climate change mitigation benefits of coastal wetland restoration." Restoration Ecology e13739.

Lymburner, L., Bunting, P., Lucas, R., Scarth, P., Alam, I., Phillips, C., Ticehurst, C., & Held, A. (2020). Mapping the multi-decadal mangrove dynamics of the Australian coastline. Remote Sensing of Environment, 238, 111185. https://doi.org/10.1016/j.rse.2019.05.004

Lyons, Mitchell. (2022). “Experimental Intertidal Seagrass Map for Australia - map delivery”. Report prepared for Department of Climate Change, Energy, the Environment and Water. University of New South Wales. 27 October 2022.

United Nations et al. (2016). SEEA Technical Note: Land Accounting. Available at: https://seea.un.org/sites/seea.un.org/files/seea_technical_note_-_land_jan_2017_draft.pdf

United Nations et al. (2021). System of Environmental-Economic Accounting— Ecosystem Accounting (SEEA EA). White cover publication, pre-edited text subject to official editing. Available at: https://seea.un.org/ecosystem-accounting

Verhagen, H. (2012). "The use of mangroves in coastal protection." COPEDEC 2012: Proceedings of the 8th International Conference on Coastal and Port Engineering in Developing Countries, Chennai, India, 20-24 February 2012.

Ware, D. and Z. Banhalmi-Zakar (2017). Funding coastal protection in a changing climate: Lessons from three projects in Australia. N. C. C. A. R. Facility. Gold Coast.

Young, M. A., O. Serrano, et al. (2021). "National scale predictions of contemporary and future blue carbon storage." Sci Total Environ 800: 149573.
Back to top of the page