National Ocean Account, Experimental Estimates methodology

This is not the latest release View the latest release
Reference period
August 2022
Released
25/08/2022

Overview

Background

The Department of Climate Change, Energy, the Environment and Water (DCCEEW), and the Australian Bureau of Statistics (ABS) have partnered to develop Australia’s first National Ocean Ecosystem Account (the National Ocean Account). The National Ocean Account aims to support decision making about the sustainable use and management of blue carbon ecosystems that underpin Australian marine industries.

Concepts

The National Ocean Ecosystem Account is part of a suite of environmental-economic accounts produced by the ABS based on the United Nations System of Environmental-Economic Accounting (SEEA). The SEEA framework extends the boundaries of the System of National Accounts (SNA) to include environmental resources, which occur outside economic production boundaries measured by the SNA. Environmental-economic accounts deliver important extensions to SNA accounts

The ecosystem accounts are based on the SEEA Ecosystem Accounting (SEEA EA) framework. This framework uncovers the interactions between ecosystems and the economy by looking at ecosystems and their contribution to human well-being in the form of identifiable ecosystem services.

For the National Ocean Ecosystem Account the tables align with the SEEA EA where possible. Where data are unavailable to complete the tables, 'NA' has been used to maintain the SEEA account framework.

Scope

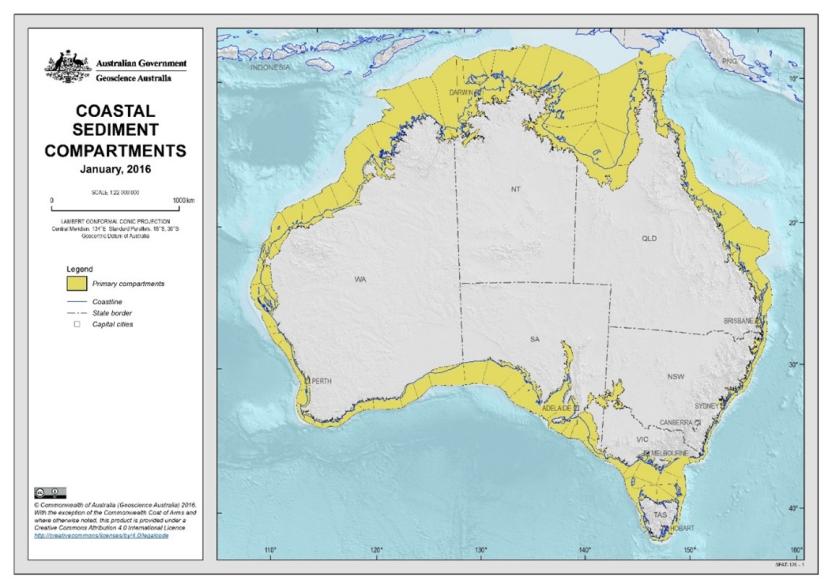
The scope of the National Ocean Account includes ecosystem extent, condition and carbon asset stocks for kelp, seagrass, saltmarsh and mangroves as well as two ecosystem services: carbon sequestration and coastal protection (see Table 1). Table 2 outlines the accounts to be included in stage 1 of the release in August 2022. This method document outlines the compilation method for the first stage of the accounts.

In scope components of the National Ocean Account
MangroveSaltmarshSeagrassKelp
ExtentExtentExtentExtent
ConditionConditionCondition/ThreatsThreats
Carbon stocksCarbon stocksCarbon stocksCarbon stocks
Carbon sequestrationCarbon sequestrationCarbon sequestrationCarbon sequestration
Coastal protectionCoastal protectionnana
Valuation of coastal protectionValuation of coastal protectionnana
Components of the National Ocean Account, Stage 1
MangroveSeagrass
ExtentExtent
ConditionCondition
Carbon stocksCarbon stocks
Carbon sequestrationCarbon sequestration
Coastal protectionna
Valuation of coastal protectionna

Data collection

Primary data sources

The primary data sources that were used to compile the National Ocean Ecosystem Accounts are listed below.

Mangrove extent, characteristic of condition

 Digital Earth Australia (DEA) Mangrove Canopy Cover (Landsat).  This product provides information about the extent and canopy density of mangroves for each year between 1987 and 2021 for the entire Australian coastline. 

The product consists of a sequence (one per year) of 30m resolution maps that are generated by analysing the Landsat fractional cover developed by the Joint Remote Sensing Research Program and the Global Mangrove Watch layers developed by the Japanese Aerospace Exploration Agency.

Seagrass extent and condition

Seamap Australia – National Marine Benthic Habitat Map.

Seamap Australia provides a synthesis of all national benthic habitat mapping data into one spatial data product using a national benthic marine classification scheme for the Australian continental shelf location. Seamap Australia – National Marine Benthic Habitat Map

Collation of spatial seagrass data (meadow extent polygons, species presence/absence points) from 1984 - 2014 for the Great Barrier Reef World Heritage Area (GBRWHA) (NESP TWQ 3.1, TropWATER, JCU) | eAtlas

This dataset summarises 30 years of seagrass data collection (1984-2014) within the Great Barrier Reef World Heritage Area. The Site data describes seagrass at 66,210 sites; while the Meadow data describes seagrass at 1,169 individual or composite meadows. The data includes information on species, meadow type and age and reliability of the data. The dataset is available as shapefiles, GIS layer packages, and/or a CSV file. Data represented in this dataset has been collected by the TropWATER Seagrass Group and CSIRO in a GIS database.

NESP MaC Project 1.13 – Synthesizing three decades of seagrass spatial data from Torres Strait and Gulf of Carpentaria 2021-2022 (JCU) | eAtlas

This data is an overview of the NESP Marine and Coastal Hub small-scale study - "Synthesizing three decades of seagrass spatial data from Torres Strait and Gulf of Carpentaria".

All three datasets were reprojected to GDA94 datum with Australia Albers EPSG3577 projection. Datasets were then combined on a per sediment region basis. If data was available for a primary sediment compartment in either of the TropWATER spatial layers then all data in that sediment compartment was removed from the seamap spatial layer. This was done to retain the additional detail in the TropWATER data and prevent double counting.

Carbon stocks

Carbon stocks were modelled using the estimates for the extend of seagrass and mangroves. The dataset used in the paper below was used to generate per hectare carbon estimates for mangrove and seagrass.

National scale predictions of contemporary and future blue carbon storage - PubMed (nih.gov)

Carbon sequestration

Carbon sequestration was modelled based on the BlueCAM carbon model, using the account extent estimates for seagrass and mangroves.

Blue carbon accounting model (BlueCAM) technical overview (cleanenergyregulator.gov.au)

BlueCAM uses Australian data to estimate abatement from carbon and greenhouse gas sources and sinks arising from coastal wetland restoration (via tidal restoration) and aligns with the Intergovernmental Panel for Climate Change guidelines for national greenhouse gas inventories. BlueCAM includes carbon sequestered in soils and biomass and avoided emissions from alternative land uses (Lovelock, Adame et al. 2022)  

Coastal protection

Mesh Blocks | Australian Bureau of Statistics (abs.gov.au)

Mesh Blocks are the smallest geographic areas defined by the ABS and form the building blocks for the larger regions of the Australian Statistical Geography Standard (ASGS).

Census mesh block counts, 2021 | Australian Bureau of Statistics (abs.gov.au)

This dataset contains counts of the total usual resident population and total dwelling count from the 2021 Census for Mesh Blocks.

Seawall infrastructure cost:

Funding Coastal Protection_ACCARNSI_Discussion_Paper_1_Final.pdf (jcu.edu.au)

Estimates of seawall construction cost as at 2017

Producer Price Indexes, Australia, June 2022 | Australian Bureau of Statistics (abs.gov.au)

This dataset contains a range of producer price indexes in the Australian economy, comprising mining, manufacturing, construction and services industries. These values were used to convert the 2017 seawall constructions costs to 2022 values.

Seawall Design - Coastal Engineering Solutions

This webpage provides estimates of approximate lifespan of a seawall

Data processing

Statistical geography

The statistical geography for the accounts was developed to provide consistency and to facilitate alignment of input datasets. All data was on An Australia Albers Equal Area Projection using the GDA 94 datum.

The National Ocean Ecosystem Account is presented at a range of geographic scales, including:

  • national,
  • state, and
  • regional ecological boundaries


National Oceans Account boundary

This is the geographic extent of Australia, including Australia’s marine waters out to the Exclusive Economic Zone (EEZ), and excluding external territories such as Antarctica. 

State and Territory boundaries

The state and territory boundaries for offshore areas is defined under the Offshore Petroleum and Greenhouse Gas Storage Act (OPGGSA). The boundaries are set out in a Schedule to the OPGGSA Act and are thus referred to as the Scheduled Areas Boundaries, the data can be downloaded from http://pid.geoscience.gov.au/dataset/ga/144572.

Regional boundaries

Based on user consultation, reporting based on ecological boundaries rather than administrative boundaries was determined to be the most appropriate division. Due to the spatial extent of the ecosystems in these accounts, a regional geography that encompassed both terrestrial and marine environments was required. Geoscience Australia’s Primary sediment compartments have been determined to be the most relevant divisions for substate reporting (figure 1). The data can be downloaded from Geoscience Australia. Where these sediment compartments cover water that is outside Australia’s EEZ, this area has not been included in the accounts.

The Primary Coastal Sediment Compartment data set represents a regional (1:250 000 - 1:100 000) scale compartmentalisation of the Australian coastal zone into spatial units within (and between) which sediment movement processes are considered to be significant at scales relevant to coastal management. The data set was generated and attributed using expert panel knowledge of coastal geomorphology and processes, and represent compartment boundaries along the coast. Environmental attributes used to determine the location of compartment (point) boundaries are given in priority order below.

Gross lithological/geological changes (e.g. transition from sedimentary to igneous rocks).

Geomorphic (topographic) features characterising a compartment boundary (often bedrock-controlled) (e.g. peninsulas, headlands, cliffs).

Dominant landform types (e.g. large cuspate foreland, tombolos and extensive sandy beaches versus headland-bound pocket beaches).

Changes in the orientation (aspect) of the shoreline.

Sediment compartments

Map delineating 100 primary coastal sediment compartments for the Australian coast.

Primary sediment compartments

Metrics

Table 3 shows the metrics to be produced in the account tables.

Metrics for each ecosystem account
AccountMangroveSeagrassSaltmarshkelp
ExtentArea haArea haArea haArea ha
Condition/threatCanopy cover changeDensity of coverTBDTBD
     
Coastal protectionkm of coastlinenakm of coastlinena
 Service replacement cost $,000naService replacement cost $,000na
 No. of dwellings protected (census)naNo. of dwellings protected (census)na
 Population (usual residence, census) Population (usual residence, census) 
     
Carbon stockMtCMtCMtCMtC
Carbon sequestrationtCO2e yr-1*tCO2e yr-1tCO2e yr-1tCO2e yr-1

*tonnes of carbon dioxide equivalent per year

Extent

Hectares of mangrove and seagrass nationally, in each state and in each sediment compartment are reported for this metric. The scope for seagrass extent is limited to data with mapped seagrass extent, therefore it does not include some areas of seagrass further offshore for which there is no mapped data available. Extent of mangroves is limited to the boundaries as defined by the Global Mangrove Watch layers. Any mangroves that fall outside of these boundaries are not included in these estimates.

Mangrove

Mangrove extent accounts have been created using Geoscience Australia’s DEA Mangrove Cover Product (Geoscience Australia 2022) at the source 30m resolution. The data provides detail on extent of mangroves as per the cover classes shown in table 4. The extent accounts have been compiled using the same methodology as was used to compile the National Land Account, see here for further details; National Land Account, Experimental Estimates methodology, 2016 | Australian Bureau of Statistics (abs.gov.au).

Seagrass

Extent of seagrass has been calculated using data from both Seamap.org and data from the Centre for Tropical Water & Aquatic Ecosystem Research (TropWATER) published on EAtlas (see data sources for further details).

Seagrass data produced by TropWATER and sourced from EAtlas are used in preference to other sources of information. The scope of the TropWATER data includes the Great Barrier Reef, the Torres Strait and the Gulf of Carpentaria. TropWATER data contains polygons describing the area of shallow water seagrass, as well as point data for deeper water seagrass. As it is not possible to calculate the area of the deeper seagrass from the point data, this has been defined as out of scope for the National Ocean Account. Because of this, the account will necessarily be an underestimation of total seagrass in Australian waters. Further work is required to map deep water seagrass beds to allow for this underestimation to be rectified in future accounts.

TropWATER data include a flag for meadow persistence (see below). The equivalent is not present in the Seamap data. Where available this metric has been included in the extent account. Definitions of the persistence categories are as follows:

  • Enduring: enduring meadow form; seagrass presence, biomass, and area expected to be stable over time and meadow expected to be a permanent feature apart from extreme events or sustained long term impacts
  • Transitory: Seagrass is present in less than 90% of surveys (Gulf of Carpentaria and Torres Strait Meadows) or is not persistent over time and expected to have naturally occurring variation (Great Barrier Reef World Heritage Area)
  • Unknown: Fewer than five surveys of the meadow recorded in input datasets 
Mangrove canopy cover classes
DEA Mangroves ClassDescriptor
Not observedNo valid data available
Not mangroveWet or not persistently green
Woodland (20 – 50% canopy cover)Annual greenness consistent with Woodland
Open Forest (50 – 80% canopy cover)Annual greenness consistent with Open Forest
Closed Forest (> 80% canopy cover)Annual greenness consistent with Closed Forest

Condition / characteristic of condition

Mangroves

The mangrove characteristic of condition account uses the Geoscience Australia DEA Mangrove Canopy Cover (Landsat) change product. Analysis of this product presents change in mangrove cover from the previous year. For instance, the change in mangrove canopy cover from 1987 to 1988 gives the characteristic of condition category for 1988. These yearly characteristics of condition are compiled into a timeseries from 1989 onwards. Change classes are described in table 5.

Mangrove canopy cover change classes
Mangrove Change ClassYear 1 MangrovesYear 2Mangroves
Loss of forestClosed forest or Open forestNo mangrove
Loss of woodlandWoodlandNo mangrove
Major reduction in canopy coverClosed forestWoodland
Minor reduction in canopy coverClosed forestOpen Forest
Minor reduction in canopy coverOpen forestWoodland
No change in mangrove coverNo mangrove changeNo change
Mangrove establishmentNo mangroveWoodland , Open Forest or Closed Forest
Increase in canopy coverWoodlandOpen Forest
Increase in canopy coverOpen ForestClosed Forest
Major increase in canopy coverWoodlandClosed Forest
No dataNo mangroveNo mangrove
No dataNot observedAny class
No dataAny classNot observed

Seagrass

Condition data for seagrass is very sparse, especially at a national scale. Several metrics have been used to provide an indication of either characteristics of seagrass condition or threat to seagrass, depending on the data available for a region. Where data for a particular metric is not available in a region, the relevant cells in the tables have been filled with na (data not available).

Density and persistance of cover for seagrass meadows has been included as a metric of condition. This data is available in TropWATER data for the Gulf of Carpentaria, Torres Strait, and Great Barrier Reef World Heritage Area made available by TropWATER.

Future releases of the National Ocean Account will include further metrics for seagrass threat to include areas that do not have density data.

Coastal protection

A model has been used to determine which mangroves provided coastal protection. Mangroves that were within 200m of the coastline and had a belt width of at least 90m were assumed to provide costal protection services. The protection afforded by these mangroves forests was considered to be 1km from the coastline.  Figure 2 shows how mangroves were determined to be in scope for protection services.

Figure 2 shows a section of coastline showing which mangroves were considered to provide coastal protection.  Yellow is total extent of mangroves in the area, green is mangrove forests with a width of at least 90m, and the purple lines are transects that extent 1km inland from the coast. Any meshblocks that the purple lines transect will be included in the count of coastal protection for people and property.

Diagram of the coastal protection model used

diagrams of the section of coastline with total mangroves shown, mangroves that have a 90m belt width and transect lines reaching 1km from the coast

Section of coastline showing which mangroves were considered to provide coastal protection.

Meters total coastline

This is a measure of the length of total coastline that is covered by mangrove stands as described above. The accuracy of the length of coastline depends on the scale of the maps used to make the determination. Geoscience Australia’s DEA Coastlines Product (annualised shoreline 2020, in a GDA_1994_Australia_Ablers projection) was used to calculate length of the coastline that includes both mainland coastline and the length of all islands. As distinguished from mainland coastline. 

More information on total length of Australia's coastline as reported by Geoscience Australia can be found here Coastline lengths.

Service replacement cost $000

The cost to replace the service provided by the ecosystem is a recommended valuation technique in the United Nations SEEA Ecosystem Account standards (paragraphs 9.50-9.51) and was endorsed through user consolation as a suitable measurement of the ecosystem service. A model that estimates the value of coastal protection provided by mangroves and saltmarsh has been created by estimating the cost to maintain built infrastructure that would provide the same service.

The total replacement cost is estimated as the per meter cost of seawall construction, multiplied by the length of coastline that currently receives coastal protection services from mangroves.

The service replacement cost is estimated as the estimated annual capital depreciation of seawall infrastructure that would provide a similar service. Straight line depreciation has been assumed model.

Due to the variable nature of the coastline and seawall construction options a range of per meter values have been used based on estimates provided by Ware and Banhalmi-Zakar (2017), which were increased in line with the Producer Price Index to produce 2021 values. A mean of these values was used to simplify the model, producing a per meter value of seawall construction of $11,600. Expected lifespan values of between 25 and 100 years were used, resulting in a minimum and maximum estimate. The mean estimated cost is based on a lifespan of 62.5 years

Number of dwellings and population protected

This metric is a count of the population and number of dwellings that are afforded protection by mangroves. The count was derived through counting the meshblocks that are within 1km of the coastline behind the in- scope mangrove patches, as shown in figure 2. The number of dwellings and population in these meshblocks was then summed for each sediment compartment and state. As some meshblocks are very large and cover more than the 1km radius considered in scope, in some cases this will lead to an over count of dwellings and population protected.

Data for dwelling count and population count come from the 2021 census. The population count was based on Persons Usually Resident: This is the count of people where they usually live, which may or may not be where they were on Census Night.

For the dwelling count, a dwelling was defined as a structure which is intended to have people live in it, and which is habitable on Census Night. Unoccupied private dwellings are also counted with the exception of those in caravan parks, marinas and manufactured home estates.

Carbon stock

Estimates of carbon stocks for mangrove, saltmarsh and seagrass have been calculated by Young, et al. (2021) (see data section above). These data were used to produce an average value of carbon per hectare of mangrove or seagrass, which was then applied to the extent data to produce estimates of tonnes of carbon. The input spatial raster data was at a resolution of 100m and provided a modelled amount of carbon stored in a vegetated coastal ecosystem in Mg/C ha. The raster was reprojected of to GDA94 datum with Australia Albers EPSG3577 projection.

Carbon sequestration

Carbon sequestration of seagrass and mangrove have been calculated using the Blue Carbon Method (Lovelock et al. 2022) (see data sources above), based on the extent of mangrove forests and seagrass meadows that we have produced in this publication.

The assumptions used for mangrove forests assumed a normal distribution of age centred around the mid-point of an expected life of mangrove. Mangroves live up to 100 years. The mid point of 50 years was chosen for calculation and growth was assumed to increase by one for the year measured. An age-stock estimate of mangroves would help to distribute sequestration more precisely but unlikely to be available in the near future.

The assumptions for seagrass meadows were based around the maturation age of most seagrass genus (10 years) and sequestration based on the increment over the year of that as a generalised assumption for measuring carbon sequestered.

Carbon sequestered in soil and vegetation were included in the calculation of final carbon sequestration services.

The final use of carbon sequestration services were indirectly attributed to the emissions of industries and households based on proportions built from extracting information from the National Greenhouse Gas Inventory. For the 2021 proportions from 2020 have been used as recent greenhouse gas industry estimates by industry are not available. It is worth noting that between 2011, 2016 and 2020 the proportions do not see significant change over time. These proportions are used to allocate final carbon sequestration services by mangrove forests and seagrass between divisions as reported in the National Greenhouse Gas Inventory by Economic Sector.

Glossary

Additions

An increase in the area or value of the stock within an ocean ecosystem. The change could be due to increase in extent, density, persistence, or value being measured.

BlueCAM

Is a carbon accounting model developed by the Clean Energy Regulator that uses Australian data to estimate abatement from carbon and greenhouse gas sources and sinks arising from coastal wetland restoration (via tidal restoration).

Additional information can be found in the Primary data sources section.

Blue carbon Ecosystem

Environments that support mangroves, seagrasses, tidal marshes and kelp. The term ‘blue carbon’ recognises the ability of these ecosystems to capture and store large amounts of carbon in their soils, roots and plants making them a significant ‘carbon sink’.

Closed Forest

Refers to mangrove forests with canopy cover of 80-100%.

Additional information can be found in the Primary data sources section.

Closing stock

Physical stock at the end of the reference period.

Hectare

A unit of area equal to 10,000 square metres.

Mangrove canopy cover

Refers to mangrove forests with canopy cover of 20-50%.

Additional information can be found in the Primary data sources section.

Mangroves not observed

Refers to absence of mangrove forests.

MtC

Stands for metric (M) tonnes (t) of carbon dioxide (CO2).

Open Forest

Refers to mangrove forests with canopy cover of 50-80%.

Additional information can be found in the Primary data sources section.

Opening stock

Physical stock at the beginning of an accounting period.

Reductions

A decrease in the area or value for the stock within an ocean ecosystem. The change could be due to decrease in extent, density, persistence, or value being measured.

tCO2e

Stands for tonnes (t) of carbon dioxide (CO2) equivalent (e).

Abbreviations

Show all

ABSAustralian Bureau of Statistics
ASGSAustralian Statistical Geography Standard
BlueCAMBlue Carbon Accounting Model
BSUBasic Spatial Unit
CSIROCommonwealth Scientific and Industrial Research Organisation
DCCEEWDepartment of Climate Change, E nergy, the Enviroment and Water
DEADigital Earth Australia
EEZExclusive economic zone
GBRWHAGreat Barrier Reef World Heritage Area
GDPGross Domestic Product
GISGeographic information system
JCUJames Cook University
MtCMillion tonnes of carbon
NAData Not Available
NESPNational Environmental Science Program
Ocean PanelHigh Level Panel for a Sustainable Ocean Economy
OPGGSAOffshore Petroleum and Greenhouse Gas Storage Act
SEEASystem of Environmental Economic Accounting
SEEA CFCentral Framework
SEEA EASystem of Environmental Economic Accounting - Ecosystem Accounting
SNASystem of National Accounts
TBDTo be determined
tCO2e yr-1Tonnes of carbon dioxide equivalent per year
TropWATERThe Centre for Tropical Water and Aquatic Ecosystem Research

References

Coastal Engineering Solutions. "Seawall Design."   Retrieved July 13, 2022, 2022, from http://www.coastengsol.com.au/seawall-design.

Geoscience Australia (2022). DEA Mangrove Canopy Cover (Landsat). https://cmi.ga.gov.au/data-products/dea/634/dea-mangrove-canopy-cover-landsat

Lovelock, C. E., M. F. Adame, et al. (2022). "An Australian blue carbon method to estimate climate change mitigation benefits of coastal wetland restoration." Restoration Ecology e13739.

Verhagen, H. (2012). "The use of mangroves in coastal protection." COPEDEC 2012: Proceedings of the 8th International Conference on Coastal and Port Engineering in Developing Countries, Chennai, India, 20-24 February 2012.

Ware, D. and Z. Banhalmi-Zakar (2017). Funding coastal protection in a changing climate: Lessons from three projects in Australia. N. C. C. A. R. Facility. Gold Coast.

Young, M. A., O. Serrano, et al. (2021). "National scale predictions of contemporary and future blue carbon storage." Sci Total Environ 800: 149573.

Back to top of the page