Life expectancy estimates are important summary measures of the population health of Aboriginal and Torres Strait Islander people and are used to inform many significant government policies. Most notably, life expectancy estimates are used to measure progress toward the first target of the National Agreement on Closing the Gap.
Life expectancy at birth is an output of the broader suite of life tables and is produced using data from death records, the Census of Population and Housing and the Census Post Enumeration Survey (PES).
- Death records provide data on deaths of Aboriginal and Torres Strait Islander people by age, sex and location recorded by state/territory registrars on the death registration form (DRF) and the medical certificate of cause of death (MCCD).
- The Census provides a count of Aboriginal and Torres Strait Islander people by age, sex and location.
- The PES is a survey conducted shortly after the Census to assess coverage of the Census, including for Aboriginal and Torres Strait Islander people.
Data from the Census and the PES were used to produce the official population estimates for Aboriginal and Torres Strait Islander Australians, known as the Estimated Resident Population.
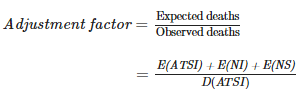
Data linkages between the Census and death records, and data linkages between the Census and PES, were used to produce adjusted death totals that account for potential underreporting and differences in reporting of Aboriginal and/or Torres Strait Islander status.
A key feature of the method is the conceptual consistency between the numerator (adjusted deaths) and the denominator (population estimates) used to calculate life expectancy.
The ABS also produces comparable life expectancy estimates for the non-Indigenous population.
Life tables
A life table is a statistical model used to represent mortality of a population. In its simplest form, a life table is generated from age-specific death rates and the resulting values are used to measure mortality, survivorship and life expectancy.
To construct a life table, data on deaths that occur in a period and estimates of the population (at the mid-point of the period) are required, disaggregated by age and sex. This is to understand the population within each age and sex category (as those are the people exposed to the risk of dying), and how many people in those age and sex categories died over the period.
The first step in compiling a life table is the calculation of age-specific death rates (ASDRs) for the population of interest. ASDRs are calculated as:
\(\Large ASDR_{a,s} = {Deaths_{a,s} \over Population_{a,s}}\)
- ASDRₐ,ₛ is the age-specific death rate for age group a and sex s.
- Deathsₐ,ₛ is the number of deaths that occurred over the specified period for age group a and sex s.
- Populationₐ,ₛ is the population at the mid-point of the specified period for age group a and sex s.
The next step is to derive the probability of dying. The probability of dying is the proportion of people of a given age or age group who die within that age group (denoted by qx), calculated using ASDRs. These probabilities are then applied to a hypothetical group of newborn babies (typically 100,000 in size) to calculate life expectancy at different ages. The life tables in this release include:
- lx – the number of persons surviving to exact age x
- qx – the proportion of persons dying between exact age x and exact age x+n (where n is the width of the age interval) within a specified period. It is the probability of dying, from which all other functions of the life table are derived
- Lx – the number of person years lived within the age interval x to x+n (where n is the width of the age interval)
- ex – life expectancy at exact age x.
A life table may be complete or abridged. Complete life tables are those constructed using single year of age categories. Abridged life tables are those constructed using age groupings. Life tables in this release are abridged life tables, using five-year age groups and are presented separately for males and females. Age-specific death rates for five-year age groups provide more reliable estimates, as single year numbers of Aboriginal and Torres Strait Islander deaths in states and territories were relatively small. Life tables assume that as a group of new-born babies pass through life they will experience the probabilities of dying of each age group, as they age. Life tables thus constitute a hypothetical model of mortality, and, although based upon age-specific death rates from a real population during a particular period of time, do not describe the future mortality of this group.