Estimates of Aboriginal and Torres Strait Islander Australians methodology

Latest release
Reference period
30 June 2021

Explanatory notes

Introduction

Estimates of the Aboriginal and Torres Strait Islander population are produced following each Census (every five years).

  • Preliminary estimates are released in the year following the Census.
  • Final estimates are released two years following the Census.

Estimates and Projections, Aboriginal and Torres Strait Islander Australians, 2011 to 2036 provide estimates and projections of the Aboriginal and Torres Strait Islander population for years in between Censuses and are derived using assumptions about future fertility, paternity, life expectancy and migration.

Scope

Australia's estimated resident population (ERP) includes all people who usually live in Australia (regardless of nationality, citizenship or legal status), with the exception of foreign diplomatic personnel and their families.

Geographic coverage

These data cover Australia and its states and territories, Remoteness Areas and Indigenous Regions, as defined by the Australian Statistical Geography Standard (ASGS) Edition 3.

The category, ‘Other Territories’ is included in the Australia total, and includes Christmas Island, the Cocos (Keeling) Islands, Jervis Bay Territory and Norfolk Island.

Sources

Estimates of the Aboriginal and Torres Strait islander population are based on the Census, Post Enumeration Survey (PES) and other demographic information. Further information on each component can be found in the Technical note – Methodology used in Aboriginal and Torres Strait Islander population estimates.
Technical note – Methodology used in Aboriginal and Torres Strait Islander population estimates

Introduction

Final Aboriginal and Torres Strait Islander estimates supercede the preliminary Aboriginal and Torres Strait Islander estimates released on 21 September 2022 in Estimates of Aboriginal and Torres Strait Islander Australians.

Method of estimation

Aboriginal and Torres Strait Islander population estimates are based on the Census of Population and Housing and are calculated using a similar process to that used for the total Australian population.

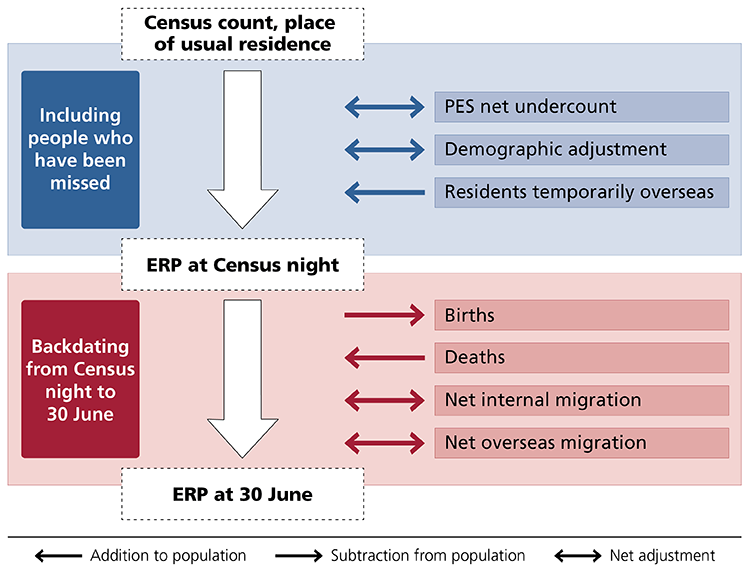
We calculate the rebased Australian population estimate at 30 June in a Census year by:

  1. Adjusting Census counts of Australian usual residents to account for people missed, counted more than once, or counted in error in the Census (based on PES results)
  2. Demographically adjusting Census counts or net undercount estimates based on coherence with other data sources and to remove implausible demographic features
  3. Adding usual residents temporarily overseas on Census night
  4. Adjusting for births, deaths and migration from 30 June to Census night.

The steps are illustrated in the following diagram.

Diagram showing how different elements of the ERP rebasing process are connected.

The diagram shows how different elements of the ERP rebasing process are connected. The process is in two parts and begins with the Census numbers for persons at place of usual residence at census night. The first part of the process starts with adding in persons who were missed by the Census by using a number of estimates. PES net undercount estimates are included first. Then Australian residents who are temporarily overseas are added in. Demographic confrontation with other sources of population datasets also informs how many persons were missed. This first process gives us the ERP for Australia at Census night. The second part of the process is about taking the ERP at Census night back to 30 June 2021. Births that have occurred in between this period are removed. Deaths that have occurred in the same period are added back into the population count. Persons who have moved between states and territories from 30 June to Census night are moved back. Persons who have moved into or, out of, Australia during this period are also moved back. That is how we arrive at ERP for 30 June 2021. 

The 2021 Census of Population and Housing

The ABS used the results of the 2021 Census as the main data source to produce the rebased population estimates for Aboriginal and Torres Strait islander Australians. The Census counted 812,500 Aboriginal and Torres Strait Islander people in Australia (excluding Other Territories) on Census night.

Asking a person’s Indigenous status may be considered personal and sensitive. As a result, some people choose not to answer this question in the Census. If no answer is provided to the question, the Census does not impute a value for the missing response. This is also true where person records are imputed for dwellings (either private or non-private) that were deemed occupied on Census night but for which no Census form was received. In the 2021 Census;

  • there were 1,233,500 records (4.9% of the total Census count) where Indigenous status was not stated
  • of these, 12.2% (or 0.6% of the total Census count) were set to not stated because the Indigenous status question was blank on returned Census forms
  • the remaining, and majority (87.8%) of, records had a not stated Indigenous status because they were wholly imputed records for non-responding dwellings deemed occupied on Census night.

The Census Post Enumeration Survey

The Census Post Enumeration Survey (PES) is run shortly after each Census to independently measure Census coverage.

The 2021 PES included people from approximately 45,100 households across Australia. Information was collected for everyone present in the household. This included basic demographic information, the address where each person was on Census night, and any other addresses where each person may have been included on a Census form.

Results from the survey were used to determine the number of people who were counted in the Census and the number of people who should have been counted in the Census. The difference is referred to as net undercount.

Net undercount is used as one of the inputs for compiling the Aboriginal and Torres Strait Islander population estimates. In the PES, Indigenous status is collected from every person (that is, there is no non-response). The PES is therefore able to estimate the net undercount of the Aboriginal and Torres Strait Islander population.

The not stated responses for Indigenous status in the Census drive the higher net undercount we see for Aboriginal and Torres Strait Islander population. This is because we don’t know the Indigenous status for these people (and don’t impute it).  Net undercount can only be calculated for known Indigenous status.

Net undercount

In the 2021 Census, the net undercount of the Aboriginal and Torres Strait Islander population was 170,800 people. This equates to a net undercount rate of 17.4%, which is similar to the rate for the 2016 Census (17.5%). This net undercount number is derived by calculating the difference between the PES Aboriginal and Torres Strait Islander population estimate (983,300) and the Aboriginal and Torres Strait Islander population Census count (812,500).

Empirical Bayes Estimation

Some state and territory estimates of net undercount for the Aboriginal and Torres Strait Islander population have relatively high standard errors and therefore the raw PES estimates are not used in calculating the Aboriginal and Torres Strait Islander population estimates below the national level. Instead, the Empirical Bayes method (as used in 2016) is used to produce smoothed net undercount rates for 18 regions of Australia. Each of these regions was a customised geographic area designed to capture the varied collection issues in different parts of Australia, as an input into the Empirical Bayesian estimation method. Victoria, Tasmania, South Australia, and the Northern Territory were separated into two regions (split between capital city and balance of state), while New South Wales, Queensland and Western Australia were separated into three regions (with the balance of state split). The Australian Capital Territory was treated as a single region.

This method smooths the raw PES estimate of the net undercount based on the Census characteristics of the region (specifically the proportion of Aboriginal and Torres Strait Islander persons and the level of Census non-response in the region and the Census enumeration strategy).

The aim of smoothing is to provide stable estimates with lower standard errors. The overall amount of smoothing used in each region was determined by two factors: the standard error for each region and an overall smoothing constant.

Maximum likelihood estimation was chosen to calculate the smoothing constant. Maximum Likelihood is the preferred approach in contemporary literature and external application, and is considered more robust than Method of Moments. The Method of Moments was initially implemented in 2006 (and used in 2011 and 2016), and was based on statistical literature dating from the early 80’s.

The difference between Method of Moments and Maximum Likelihood is relatively small with respect to the large standard errors. Therefore, changing the estimation method to Maximum Likelihood is unlikely to make a statistically significant change to the estimates.

Regions with high standard errors required more smoothing.

For further information on estimating the Aboriginal and Torres Strait Islander resident population, see Methodological News, Sep 2022 | Australian Bureau of Statistics (abs.gov.au)

Comparison between PES and Empirical Bayes net undercount errors – 30 June 2021
PES standard error (%)Empirical Bayes standard error (%)
New South Wales3.61.9
Victoria6.44.2
Queensland3.32.7
South Australia64.3
Western Australia5.14
Tasmania44.1
Northern Territory2.51.9
Australian Capital Territory11.76.8
Australia1.81.8

Calculating rebased estimated resident population

Estimates of the Aboriginal and Torres Strait Islander population on Census night, which have been adjusted for net undercount (as noted above) were then further adjusted to compile population estimates at 30 June. This involved adding back Australians temporarily overseas at the time of the Census, and backdating to the 30 June using data on births, deaths and interstate and overseas migration, which occurred between the two dates. Minor demographic adjustments were then made to address anomalies in age and sex composition. All these additional adjustments added in 500 people at the national level.

Treatment for Age Heaping in the Northern Territory

When respondents are unsure of their age or the age of others they are reporting on behalf of, they may round their ages to those ending in 0 or 5. This produces systematic spikes for ages ending in 0 or 5, a phenomenon known as age heaping.

Age heaping is a relatively common demographic issue in developing countries and is generally not observed in the total Australian population, except in the Northern Territory, where it is evident in Census counts and population estimates for the Aboriginal and Torres Strait Islander population.

While we have not traditionally applied an adjustment for age heaping, the increasing demand for data by single year of age for key reporting purposes has necessitated a demographic treatment to ensure the best possible estimates are produced by age for the Northern Territory’s Aboriginal and Torres Strait Islander population.

Estimates of the Aboriginal and Torres Strait Islander population for the Northern Territory released in this publication are adjusted for age heaping using the Sprague method. For further information, please see Technical Note 2 in Estimates of Aboriginal and Torres Strait Islander Australians, June 2011.

Quality declaration - summary

Institutional environment

For information on the institutional environment of the Australian Bureau of Statistics (ABS), including the legislative obligations of the ABS, financing and governance arrangements, and mechanisms for scrutiny of ABS operations, please see ABS Institutional Environment.

Relevance

This publication contains estimates of the Aboriginal and Torres Strait Islander, non-Indigenous and total populations of Australia at 30 June 2021, based on results of the 2021 Census of Population and Housing. Estimates are disaggregated by age and sex for Australia, states/territories, Remoteness Areas and Indigenous Regions. Only total estimates for Statistical Areas Level 2 and Local Government Areas are available.

Timeliness

Estimates of the Indigenous and non-Indigenous populations are produced for 30 June of each Census year. Preliminary estimates for 30 June 2021 were released on 21 September 2022 in Estimates of Aboriginal and Torres Strait Islander Australians.

A time series of estimates of the Indigenous population, based on estimates from the most recent Census, are produced once every five years. Estimates for the period 2011 to 2036 are scheduled for release in 2024 in Estimates and Projections, Aboriginal and Torres Strait Islander Australians, 2011 to 2036.

Accuracy

The estimates presented in this publication are based on results of the 2021 Census of Population and Housing, adjusted for net undercount as measured by the Post Enumeration Survey (PES).

The goal of the Census is to obtain a complete measure of the number and characteristics of people in Australia on Census night and their dwellings. To achieve this, extensive effort is put into Census form design, collection procedures, and processing procedures.

In a large and complex exercise such as the Census, it is inevitable that a small number of people will be missed and some will be counted more than once. In Australia, more people are missed from the Census than are counted more than once. The net effect when both factors are taken into account is net undercount.

The ABS conducts the PES shortly after the Census to determine how many people were missed in the Census and how many were counted more than once. For 2021, the net undercount of the Indigenous population was 170,800 persons.

There were 1,233,500 Census records (4.9% of the total Census count) with unknown Indigenous status in the 2021 Census. For a detailed discussion of unknown Indigenous status in the 2021 Census see Understanding change in counts of Aboriginal and Torres Strait Islander Australians: Census.

The extent of undercoverage of Aboriginal and Torres Strait Islander Australians in the 2021 Census and the relatively small sample size of the PES to adjust for that undercoverage means the estimates should be interpreted with caution.

Coherence

The estimates presented in this publication are not consistent with, and should not be compared with, estimates based on 2016 or other Censuses, for a number of reasons including:

Estimates of the Indigenous population for the period 2011 to 2036, based on the 2021 estimates presented in this publication, are scheduled for release in 2024 in Estimates and Projections, Aboriginal and Torres Strait Islander Australians, 2011 to 2036.

Interpretability

This publication contains detailed Explanatory Notes, a Technical note and a Glossary that provides information on the data sources, terminology, classifications and other technical aspects associated with these statistics.

Accessibility

Estimates of the Aboriginal and Torres Strait Islander and non-Indigenous populations of Australia data are available in a variety of formats on the ABS website. The main features, which has the key estimates commentary and the data cubes (in Microsoft Excel spreadsheet format), are available free on the web.

The ABS observes strict confidentiality protocols as required by the Census and Statistics Act (1905). This may restrict access to data at a very detailed level which is sought by some users.

Glossary

Show all

Aboriginal and/or Torres Strait Islander

People who identified themselves, or were identified by another household member, as being of Aboriginal origin, Torres Strait Islander origin, or both Aboriginal and Torres Strait Islander origin.

Australian Statistical Geography Standard (ASGS)

The ASGS defines all the regions for which the ABS releases statistics within the one framework and is used by the ABS for the collection and dissemination of geographically classified statistics. It is the current framework for understanding and interpreting the geographical context of statistics released by the ABS.

For more information, please refer to Main Structure and Greater Capital City Statistical Areas, Australian Statistical Geography Standard (ASGS) Edition 3

Birth

The delivery of a child, irrespective of the duration of pregnancy, who, after being born, breathes or shows any other evidence of life such as heartbeat.

Census

A census is the complete enumeration of a specific population at a point in time (as opposed to a survey, which enumerates a sample of the population). When the word is capitalised, "Census" refers to the national Census of Population and Housing. The Census is run by the ABS every five years and aims to count every person in Australia on Census night.

Death

Death is the permanent disappearance of all evidence of life after birth has taken place. The definition excludes all deaths prior to live birth. For the purposes of the ABS Death Registrations collection, a death refers to any death which occurs in, or en route to Australia and is registered with a state or territory RBDM.

Dwelling

A dwelling is a structure which is intended to have people live in it, and which is habitable on Census Night. Some examples of dwellings are houses, motels, flats, caravans, prisons, tents, humpies and houseboats.

There are private and non-private dwellings:

A private dwelling is normally a house, flat, part of a house, or even a room; but can also be a house attached to, or rooms above, shops or offices; an occupied caravan or unit in a caravan park or craft in a marina; occupied dwelling in a manufactured home estate; occupied self-care unit in accommodation for the retired or aged; a houseboat; or tent if it is standing on its own block of land. An occupied caravan situated on a residential allotment is also classed as a private dwelling. Private dwellings can be either occupied or unoccupied.

Non-private dwellings are those dwellings not included above, which provide a communal or transitory type of accommodation. They are classified according to their function. These dwellings include hotels, motels, guest houses, prisons, religious and charitable institutions, defence establishments, hospitals and other communal dwellings. Only occupied non-private dwellings are included in the Census.

Estimated resident population (ERP)

The official measure of the population of Australia is based on the concept of usual residence. It refers to all people, regardless of nationality, citizenship or legal status, who usually live in Australia, with the exception of foreign diplomatic personnel and their families. It includes usual residents who are overseas for less than 12 months over a 16 month period. It excludes overseas visitors who are in Australia for less than 12 months over a 16 month period.

Indigenous geography structure

Data are also presented according to the Indigenous Structure of the ASGS. Under this classification, areas are defined as follows:

  • Indigenous Locations (ILOCs): Represent small Aboriginal and Torres Strait Islander communities (urban and rural) with a minimum population of 90 Aboriginal and Torres Strait Islander usual residents. An ILOC is an area designed to allow the release of statistics relating to Aboriginal and Torres Strait Islander people with a high level of spatial accuracy whilst maintaining the confidentiality of individuals. ILOCs are aggregates of one or more SA1s.
  • Indigenous Areas (IAREs): Are medium sized geographical areas designed to facilitate the release of more detailed statistics for Aboriginal and Torres Strait Islander Peoples. IAREs provide a balance between spatial resolution and population size, which provides the ability to release more detailed socio-economic attribute data than is available on ILOCs. IAREs are aggregates of one or more ILOCs.
  • Indigenous Regions (IREGs): Are large geographical areas loosely based on the former Aboriginal and Torres Strait Islander Commission (ATSIC) boundaries. The greater population of IREGs enables greater cross classification of variables when compared with IAREs and ILOCs. IREGs do not cross state or territory borders and are aggregates of one or more IAREs.

For more information, please refer to Indigenous Structure, Australian Statistical Geography Standard (ASGS) Edition 3

Indigenous status

Indigenous Status indicates whether a person identifies as being of Aboriginal and/or Torres Strait Islander origin. Indigenous status is reported (either by an individual or a person responding to a survey or Census on their behalf) in response to the question: Is the person of Aboriginal or Torres Strait Islander origin?

Interstate migration

The movement of people over a state or territory boundary for the purpose of changing their place of usual residence. Net interstate migration is the number of arrivals minus the number of departures.

Local Government Areas (LGA)

An ABS approximation of the officially gazetted Local Government Areas (LGAs) as defined by each state and territory local government department. LGAs cover incorporated areas of Australia, which are legally designated areas for which incorporated local governing bodies have responsibility. The major areas of Australia not administered by incorporated bodies are the northern parts of South Australia and all the Australian Capital Territory and Other Territories. These regions are identified as 'Unincorporated' in the ABS LGA structure.

For more information, please refer to Non ABS Structures, Australian Statistical Geography Standard (ASGS) Edition 3

Median age

For any distribution the median value is that which divides the relevant population into two equal parts, half falling below the value and half exceeding it. Thus, the median age is the age at which half the population is older and half is younger.

Net undercount

The difference between the actual number of people who were counted in the Census (including imputations) and an estimate of the number of people who should have been counted in the Census. This estimate is based on the PES conducted after each Census. For a category of person (for example, based on age, sex and state of usual residence), net undercount is the result of Census undercount, overcount, differences in classification between the PES and Census, and imputation error.

Post Enumeration Survey (PES)

The Census PES is a household survey conducted following the Census. The PES allows the ABS to estimate the number of people missed in the Census and the number counted more than once or in error. Historically more people are missed than are counted more than once in Australia, leading to a net undercount. PES estimates of net undercount are used to adjust Census counts for use in ERP.

Rebasing of population estimates

After each Census, the ABS uses Census counts (adjusted for undercount) to construct a new base population figure for 30 June of the Census year. Rebasing is the process of updating population estimates for the five years between Censuses, to incorporate information from the most recent Census.

Relative Standard Error (RSE)

The RSE is the standard error expressed as a percentage of the estimate to which it refers, and is useful when comparing the variability of estimates of different sizes.

Remoteness Areas (RA)

The ASGS defines RAs into five classes of relative remoteness across Australia. Each RA is created from the grouping of Statistical Areas Level 1 (SA1) identifying a (non-contiguous) region in Australia having a particular degree of remoteness.

The five classes of remoteness are: Major Cities of Australia, Inner Regional Australia, Outer Regional Australia, Remote Australia and Very Remote Australia.

For more information, please refer to Remoteness Structure, Australian Statistical Geography Standard (ASGS) Edition 3

Standard Error (SE)

A measure of the variation among the estimates from all possible samples, and thus a measure of the precision with which an estimate from a particular sample approximates the average result of all possible samples. The units of the SE are the same as the variable of interest.

State or territory of usual residence

The state or territory of usual residence of:

  • the population (estimated resident population)
  • the mother (birth collection)
  • the deceased (death collection).

Statistical Areas Level 1 (SA1)

An area defined in the ASGS and designed as the smallest unit for the release of Census data. They generally have a population of 200 to 800 people, and an average population of about 400 people. SA1s in remote and regional areas generally have smaller populations than those in urban areas. There are 61,845 SA1s and they cover the whole of Australia without gaps or overlaps. Deaths data is not available at this level of geography.

For more information, please refer to Main Structure and Greater Capital City Statistical Areas, Australian Statistical Geography Standard (ASGS) Edition 3

Statistical Areas Level 2 (SA2)

A general-purpose medium-sized area defined in the ASGS and built from whole SA1s. They aim to represent communities that interact together socially and economically. SA2s are based on officially gazetted suburbs and localities. In urban areas, SA2s largely conform to one or more whole suburbs, while in rural areas they generally define the functional zone of a regional centre. SA2s generally have a population range of 3,000 to 25,000 people, and an average population of about 10,000 people. There are 2,473 SA2s and they cover the whole of Australia without gaps or overlaps. SA2s are the base unit for preparing sub-state mortality statistics.

For more information, please refer to Main Structure and Greater Capital City Statistical Areas, Australian Statistical Geography Standard (ASGS) Edition 3

Statistical Areas Level 3 (SA3)

An area defined in the ASGS and built up from SA2s which provides a standardised regional breakup of Australia. SA3s aim to create a standard framework for the analysis of ABS data at the regional level through clustering groups of whole SA2s that have similar regional characteristics. Their boundaries reflect a combination of widely recognised informal regions as well as existing administrative regions such as State Government Regions in rural areas and Local Government Areas in urban areas. SA3s generally range in population from 30,000 to 130,000 people. There are 359 SA3s and they cover the whole of Australia without gaps or overlaps.

For more information, please refer to Main Structure and Greater Capital City Statistical Areas, Australian Statistical Geography Standard (ASGS) Edition 3

Statistical Areas Level 4 (SA4)

An area defined in the ASGS and designed for the output of labour force data and to reflect labour markets. In rural areas, SA4s generally represent aggregations of multiple small labour markets with socioeconomic connections or similar industry characteristics. Large regional city labour markets are generally defined by a single SA4. Within major metropolitan labour markets SA4s represent sub-labour markets. SA4s are built from whole SA3s. They generally have a population over 100,000 people to enable accurate labour force survey data to be generated. There are 108 SA4s and they cover the whole of Australia without gaps or overlaps.

For more information, please refer to Main Structure and Greater Capital City Statistical Areas, Australian Statistical Geography Standard (ASGS) Edition 3

Usual residence

Within Australia, usual residence is the address of the dwelling at which a person considers themselves to currently live, either having lived there for some time or intending to live there for some time.

The usual residence of a newborn is that of the mother.

Abbreviations

Show all

ABSAustralian Bureau of Statistics
ACTAustralian Capital Territory
ASGSAustralian Statistical Geography Standard
Aust.Australia
ERPestimated resident population
IAREIndigenous Areas
ILOCIndigenous Locations
IREGIndigenous Regions
NSWNew South Wales
NTNorthern Territory
PESPost Enumeration Survey
QldQueensland
RARemoteness Area
RSErelative standard error
SASouth Australia
SA1Statistical Areas Level 1
SA2Statistical Areas Level 2
SA3Statistical Areas Level 3
SA4Statistical Areas Level 4
SEstandard error
Tas.Tasmania
Vic.Victoria
WAWestern Australia
Back to top of the page