4. COVID-19 and the 2021 Census
An independent view of the quality of statistical outputs from the 2021 Census of Population and Housing
Overview

The 2021 Census was conducted during the COVID-19 pandemic when many parts of Australia were in lockdown and movements within, into and out of Australia were tightly controlled. The results from the Census, therefore, tell the story of changed circumstances for many Australians and provide insights into the impact of the pandemic on populations in our cities, towns, rural and remote areas.
These changes in population movement, coupled with various access restrictions caused by the pandemic and associated health orders across states and territories, introduced additional complexity in the running of Census data collection and processing.
This section of the Panel’s report looks firstly at the preparations made and implemented by the ABS to support the successful enumeration of the 2021 Census when large parts of south eastern Australia were experiencing some kind of COVID-19 restrictions. The second part of this section focuses on COVID-19’s impact on selected data items.
4.1 Census operations and the pandemic
The 2021 Census built on the approach used in the 2016 Census. Nearly four in five Australian households completed their Census online, with no in-person contact from the ABS, having received instructions in the mail or having had a paper form dropped off or delivered to their letterbox. Many households also used the new Census Digital Service to complete their Census without receiving instructions and therefore without contact from the ABS. This proved to be especially useful given the disruptions to field operations because of COVID-19 restrictions – people could easily access help, and they did, and in much larger numbers than in previous censuses.
Notwithstanding this, as before, the 2021 Census relied on field staff and running the Census during the pandemic introduced numerous challenges to field operations. In response to the emergence of the pandemic, the ABS developed a Census COVIDSafe Plan to manage field staff and community safety during operations. This plan was implemented in 2020 during the major large-scale Census test, which was conducted in areas across Australia, including in some areas that were under COVID-19 restrictions. This experience, including lessons learned and outcomes achieved, provided confidence to the ABS, stakeholders and field staff that the 2021 Census could safely go ahead.
These preparations proved invaluable as more than half of the Australian population was in lockdown at some stage during the Census enumeration period. In addition, the situation was very fluid as many parts of south eastern Australia moved in and out of lockdown restrictions throughout the Census ‘response window’ in early August 2021 as follows:
- Leading up to Census night, Victoria entered a state-wide lockdown which remained in place for Greater Melbourne and Shepparton until after Census night. Most of regional Victoria had restrictions lifted on 10 August.
- Greater Sydney and many parts of regional New South Wales were also in lockdown restrictions during the Census response period.
- South East Queensland was in lockdown shortly before Census night but this was lifted on 8 August. However, Cairns and Yarrabah were placed in lockdown on 8 August for a short period.
- The Australian Capital Territory was placed in lockdown shortly after Census night on 12 August.
This resulted in a significant disruption of some aspects of field operations, particularly in New South Wales and Victoria. Also, while most of regional and remote Australia was not in lockdown during the Census, many of these areas had tight labour markets due to interstate and national border closures. This resulted in difficulties recruiting field staff. Several measures were used to minimise the impact of these challenges:
- Before Census night, restrictions on staff movements impacted the number of field staff available to deliver paper forms in some parts of the country. In response, the ABS commenced delivery earlier than planned, mailed paper forms to many regional towns and utilised Australia Post’s Unaddressed Mail Service to distribute instructions to large numbers of rural and remote postcodes. The Unaddressed Mail Service approach supported households to participate in the event of a delay in delivery of their Census form.
- The ABS engaged with aged care facilities and hospitals prior to Census night and special arrangements were made to collect data from residents and patients where required. In some establishments, particularly in New South Wales, key Census data was provided by the facility rather than individually collected from residents on Census forms. This in turn, led to the collection of a limited amount of key demographic data for residents in these facilities. However, where direct collection did occur, lockdowns and restricted access led to reduced response in hospitals.
- In locations where the ABS was unable to provide planned face-to-face support, alternative assistance was offered, including through the ABS website, online video guides in multiple languages and assistance over the phone.
- After Census night, dwellings that had not responded received reminder letters delivered in the mail or a visit by a Census field officer. In response to hard lockdowns, the ABS delayed early field visits in Greater Melbourne and Greater Sydney and mailed paper forms instead. Despite restrictions, field staff were eventually deployed across all areas of Australia and operated in accordance with local requirements according to the Census COVIDSafe Plan.
Restricted field operations also presented new and unique challenges to determining whether dwellings were occupied - this was due to the combination of a ‘no contact’ approach in some areas coupled with the ways in which occupancy was expected to have changed due to COVID-19. However, the ABS had developed a probability model in the lead up to the 2021 Census to improve the accuracy of determining whether a dwelling was occupied or not on Census night. This was used during Census processing when there wasn’t enough information from the field to make a determination. The model was also used in validating the final occupancy results for the Census.
The COVID-19 pandemic affected not only the field operations of the 2021 Census, but also data processing operations. The data processing workforce was impacted by the COVID-19 waves in 2021 and 2022 and additional data assurance was required to understand COVID-19 impacts on the data. These additional assurance activities were focused on validating Census data using other data sources and reconciling the large number of Census forms submitted using the new self-service option on the Census Digital Service. Nevertheless, the ABS was able to manage these shifting circumstances and release data on time on 28 June 2022.
4.2 COVID-19 and 2021 Census results
In light of the challenges raised in running the 2021 Census, the Panel sought to understand the possible COVID-19 impact on the quality of Census data by examining this impact on a number of ‘first release data items’, that is on data items to be released by the ABS on 28 June 2022. It is anticipated that COVID-19 impacts will also be apparent in some of the ‘second release’ data items (e.g. Labour force, Employment, Journey to work) due for release in October 2022. This timeframe for second release data items means that they were not available to contribute to the Panel’s analysis.
4.2.1 People at their usual residence on Census night
Pandemic restrictions improved some aspects of Census data quality due to less movement of the population on and around Census night, resulting in more people being counted at home than otherwise would have been the case. As a result, the 2021 Census has more accurately captured household and family data such as income.
The proportion of people counted who were at their usual residence on Census night in 2021 was 96.1% (see Table 4.2.1). This is higher than observed in the 2016 and 2011 Censuses (95.1% and 95.2%, respectively). This increase reflects more people staying at home and less interstate travel. The highest proportion of people reporting being at home on Census night was in Victoria (97.5%) where Greater Melbourne was under ’stay at home’ orders. The greatest proportional increase was in Queensland (+1.4% points) but the level was still lower than other eastern states and territories. Only the Northern Territory had a decrease in the proportion, which was due to an increase in the number of visitors counted from elsewhere in Australia in 2021, many of whom may have travelled to Northern Territory from other states to escape COVID-19 lockdowns.
| 2016 (%) | 2021(%) | % point change 2016-2021 | |
|---|---|---|---|
| New South Wales | 95.8 | 97.0 | 1.2 |
| Victoria | 96.3 | 97.5 | 1.1 |
| Queensland | 93.5 | 94.9 | 1.4 |
| South Australia | 95.7 | 96.2 | 0.5 |
| Western Australia | 94.0 | 94.0 | 0.0 |
| Tasmania | 95.2 | 95.7 | 0.5 |
| Northern Territory | 85.2 | 82.5 | -2.6 |
| Australian Capital Territory | 95.3 | 96.9 | 1.6 |
| Australia (b) | 95.1 | 96.1 | 1.0 |
(a) Excludes overseas visitors.
(b) Includes Other Territories.
4.2.2 Overseas visitors
Overseas visitors in the Census are those people who indicate they would usually be resident in Australia for less than a year. As expected, due to Australian international border restrictions during the pandemic, significantly fewer overseas visitors were counted in the 2021 Census compared to previous censuses (see Table 4.2.2). In the 2021 Census, 61,860 people reported that they were visiting Australia from overseas, compared with 315,531 people in 2016 and 219,442 people in 2011. A decrease was observed across all states and territories, with the largest decreases observed in New South Wales, Queensland and Victoria. The impact of this decrease is evident in other Census data, such as the number of people counted in hotel accommodation.
| 2011 | 2016 | 2021 | |
|---|---|---|---|
| New South Wales | 62,084 | 95,913 | 17,458 |
| Victoria | 44,149 | 73,120 | 12,918 |
| Queensland | 65,814 | 83,946 | 14,902 |
| South Australia | 10,446 | 14,362 | 3,619 |
| Western Australia | 24,902 | 31,243 | 7,540 |
| Tasmania | 2,192 | 2,964 | 1,046 |
| Northern Territory | 6,162 | 8,980 | 3,205 |
| Australian Capital Territory | 3,656 | 4,878 | 1,151 |
| Australia (a) | 219,442 | 315,531 | 61,860 |
(a) Includes Other Territories.
4.2.3 New migrants and year of arrival
The impact of the pandemic and border restrictions is also evident in the number of new migrants to Australia in 2020 and 2021. People who respond that they were born overseas are then asked for their year of arrival in Australia. 2021 Census data shows a large decrease in the number of people who arrived in 2020 and 2021 compared with previous years, as shown in Figure 4.2.1. While 321,529 people reported that they arrived in 2019, only 127,532 reported arriving in 2020. Similarly, the number of people reporting their year of arrival as 2021 is low (38,590), noting that this does not represent the full year due to the Census taking place in August 2021.
Note: Excludes overseas visitors. Includes Other Territories.
The data for 2021 is part-year up to approximately August 2021 when the Census was undertaken.
4.2.4 People staying in non-private dwellings
With less movement of the population and a decrease in overseas visitors during the pandemic, there was a significant reduction in the number of people staying in some types of non-private dwellings. Notably, Table 4.2.3 shows that there were 171,646 people staying in hotel, motel and bed & breakfast accommodation in 2021, compared with 327,775 in 2016 (a 47.6% decrease). There was also a noticeable reduction in people staying in residential colleges, which decreased from 69,009 in 2016 to 56,888 in 2021 (a 17.6% decrease) even though there had been quite a large increase in the number of residential colleges.
| 2011 | 2016 | 2021 | % change 2011-2016 | % change 2016-2021 | |
|---|---|---|---|---|---|
| Hotel, motel, bed and breakfast | 265,488 | 327,775 | 171,646 | 23.5 | -47.6 |
| Residential college, hall of Residence | 57,044 | 69,009 | 56,888 | 21.0 | -17.6 |
(a) Includes Other Territories and overseas visitors.
4.2.5 Private dwelling occupancy
In the Census, dwelling occupancy refers to a dwelling being occupied on Census night. Changes in private dwelling occupancy are impacted by several factors: available dwelling stock; people travelling and away from home on Census night; overseas visitors and usual residents returning from overseas; and other demographic changes such as migration. As indicated earlier, many of these factors have been impacted by the COVID-19 pandemic.
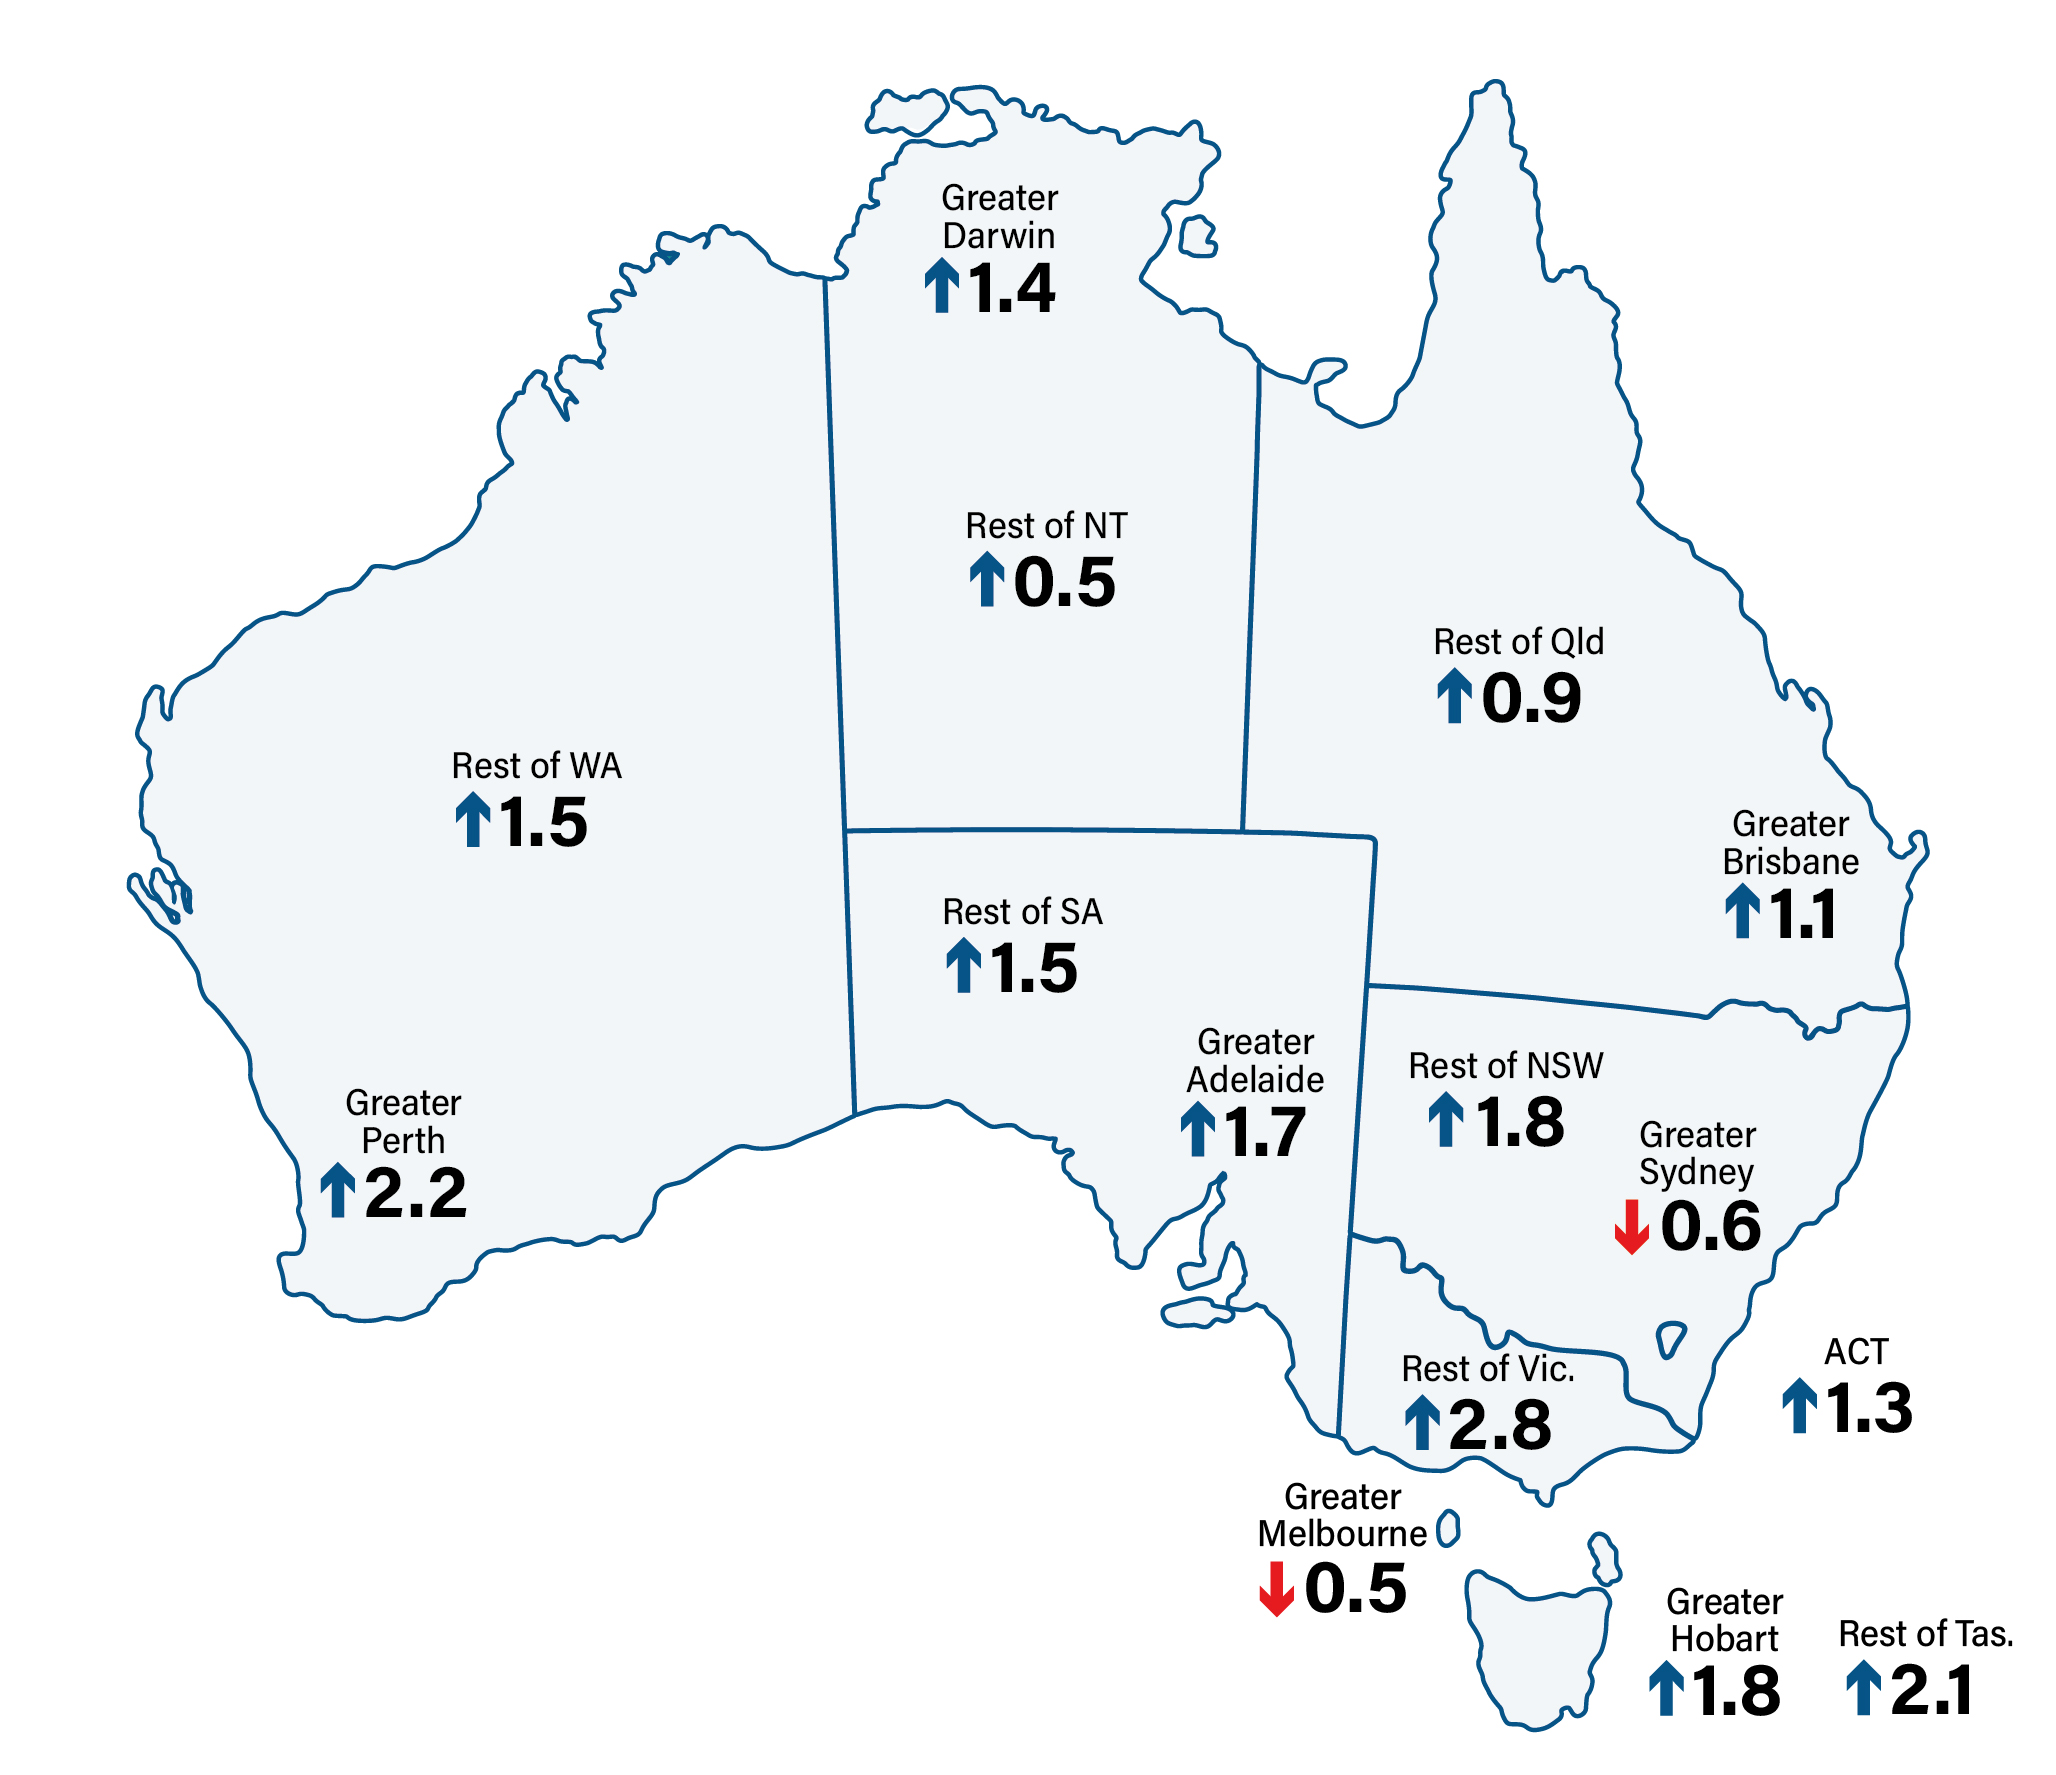
Private dwelling occupancy in 2021 was 90.4% compared with 89.5% in 2016 (and 89.8% in 2011). This increase in occupancy is noteworthy given the 9.6% growth in private dwellings between the 2016 and 2021 Censuses compared with 8.6% between the 2011 and 2016 Censuses. The increase in dwelling occupancy was observed across all states and territories but varied within states/territories, with reduced rates of occupancy apparent in Greater Melbourne and Greater Sydney (see Figure 4.2.2). For example, the proportion of private dwellings in Victoria that were occupied outside of Melbourne increased by 2.8 percentage points, while the proportion in Melbourne decreased by 0.5 percentage points. A similar pattern was observed for New South Wales (a decrease of 0.6 percentage points in Sydney) and outside of Sydney (an increase of 1.8 percentage points).
Figure 4.2.2 Increase in the proportion of occupied private dwellings
Image
Description
Note: The map shows percentage point increase and decrease for greater capital cities and rest of state/territory.
4.3 Implications for data quality

Through appropriate planning and risk management, including the testing of procedures and systems in the 2020 Census Test, disruptions to Census field operations due to the pandemic were largely overcome without impacting the quality of Census data. Also, new online self-service options, developed to improve the Census experience in 2021, were popular with households across Australia and helped to minimise the impact of COVID-19 restrictions on the delivery of Census forms and other field work.
COVID-19’s impact on peoples’ movements within, into and out of Australia are clearly reflected in the 2021 Census data across a range of items, as noted above. It is worth highlighting that, as a consequence of reduced population movement in the two years prior to, and during the time of, the Census, more people were counted at home in the 2021 Census than previously. This has enhanced data quality as it resulted in less imputation and the collection of more complete information about families and households, including data such as household income.
In addition, the decrease in visitors from overseas and in international students due to COVID-19 restrictions saw fewer people staying in certain types of non-private dwellings such as hotels and halls of residence. This, in turn, has resulted in a related decrease in the number of imputed persons in these dwellings and a likely associated improvement in data quality.