3.2 Census Post Enumeration Survey estimates of net undercount
An independent view of the quality of statistical outputs from the 2021 Census of Population and Housing
Overview

Net undercount for any category of person is the difference between the Post Enumeration Survey estimate of the number of people who should have been counted in that category and the actual Census count including persons imputed into non-responding dwellings during Census processing.
Net undercount is often presented as a rate. The rate is the net undercount (or overcount) as a percentage of the Post Enumeration Survey estimate for a given population (i.e. as a percentage of the number of people who should have been counted in the Census).[1] The disaggregations of net undercount (together with Census and other administrative data) are used in the compilation of the official population estimates for Australia, the Estimated Resident Population.
The total net undercount from the Post Enumeration Survey can be examined by the components of persons counted on Census forms, and persons imputed (see Section 3.2.2). This enables examination of the number of persons missed in the Census, the number of persons counted more than once or in error in the Census, and overcount due to over-imputation. Each of these components is important for understanding the quality of the 2021 Census data.
For 2021, the ABS produced a new coverage measure called gross coverage. Conceptually, gross coverage is a measure of the population that the Census counted (or received a form for) as a proportion of the population that the Census should have counted. It is the Census count, with the overcount and imputed persons removed as a proportion of the Post Enumeration Survey population estimate, expressed as a percentage. Gross coverage is useful for understanding how well the population was captured in the Census, and the proportion of the population for which the full suite of data was obtained. It is an important lens for understanding the quality of Census data.
For comparability with the Post Enumeration Survey, all Census counts in Section 3.2 are presented on a usual residence basis and exclude Other Territories.
[1] For more information on the Post Enumeration Survey or net undercount, see Australian Bureau of Statistics (2022). 2021 Census overcount and undercount. Available at https://www.abs.gov.au/statistics/people/population/2021-census-overcount-and-undercount/2021.
3.2.1 Australia as a whole
The 2021 Census counted 25,417,999 usual residents of Australia (excluding Other Territories), who were in the country on Census night (including 898,484 persons who were imputed into non-responding dwellings assumed to be occupied on Census night). This was 190,044 persons fewer than the Post Enumeration Survey estimate of the usual resident population who were present in Australia on Census night. This equates to a total net undercount rate of 0.7%, down from 1.0% in 2016.
The net undercount rate for persons on Census forms decreased from 3.7% to 2.8% between 2016 and 2021, and the net overcount rate for persons imputed also decreased from 2.7% in 2016 to 2.1% in 2021 (see Table 3.2.1). Both decreases are consistent with an improvement in data quality.
As these estimates are based on a sample, they are subject to sampling errors. The sampling errors are shown for the core estimates of the net undercount in Table 3.2.1. More detailed estimates are shown in Appendix C. The net undercount rates are also subject to other types of errors such as non-response bias, recall error, matching error, and invalidity of the assumptions in the model to adjust for non-response. These are also discussed in Appendix C.
| 2001 | 2006 | 2011 | 2016 | 2021 | |
|---|---|---|---|---|---|
| Net undercount rate (%) for persons on Census forms | na (a) | 3.9 | 3.4 | 3.7 | 2.8 |
| Net overcount rate (%) for persons imputed | na (a) | 1.2 | 1.7 | 2.7 | 2.1 |
| Total Net undercount rate (%) | 1.8 | 2.7 | 1.7 | 1.0 | 0.7 |
| Standard error (SE) | 0.1 | 0.2 | 0.2 | 0.2 | 0.2 |
(a) Data not available for 2001.
Notes: Percentages may not add exactly due to rounding in cells. Excludes Other Territories and overseas visitors.
3.2.2 Analysis of net undercount
The overall net undercount can be disaggregated into a number of components of undercount and overcount, as shown in Table 3.2.2. These components are described as follows.
Gross undercount for persons on Census forms
This comprises persons missing from completed Census forms and persons in dwellings missed in the Census (i.e. dwellings not known to Census). Gross undercount in the 2021 Census was estimated to be 1,032,660 persons, or 4.0% of the population. In 2016, this component represented 4.9% of the population (1,150,588 persons).
Gross overcount for persons on Census forms
This comprises persons included on Census forms multiple times or included in error (e.g. they were not in Australia on Census night but were included on a Census form). Gross overcount in the 2021 Census was estimated to be 314,788 persons, or 1.2% of the population, the same proportion as in 2016 (274,673 persons). This indicates that the introduction of the No-Census Number option in 2021 which was used to encourage response (see Appendix E), and potentially may have also introduced a risk of greater duplication in responses from dwellings, but did not in the event result in increased overcoverage as most duplicate dwellings were removed in processing.
Net undercount for persons on Census forms
This measure is the difference between gross undercount and gross overcount, for persons on Census forms, reflecting the extent to which undercount has been offset by overcount. Net undercount for persons on Census forms was estimated to be 717,872 persons, or 2.8% of the population in 2021. The corresponding figure was 3.7% in 2016 (875,915 persons).
Net overcount for persons imputed
This component largely represents over-imputation of persons during Census processing. Over-imputation occurs when too many people are imputed into non-responding dwellings, either because the non-responding dwelling was incorrectly deemed to be occupied on Census night, or too many people were imputed into a dwelling that was correctly deemed to be occupied. The net contribution of the latter was relatively small. People were also incorrectly imputed into non-private dwellings on Census night, either due to an overestimate of the Census night occupancy of non-private dwellings, or because people were counted a second time on a form from their private dwelling residence. This process provides the balance of the over-imputation.
In the 2021 Census, net overcount for imputed persons was estimated to be 527,828, or 2.1% of the population. The corresponding figure for 2016 was 649,509 persons (2.7% of the population).
The ABS has reported that the process of determining whether a home is occupied on Census night has become more difficult with the increase in the number of people living in high-density, secure buildings and the decreasing likelihood of making doorstep contact. In 2021, COVID-19 lockdowns in some areas of Australia meant that doorstep contact was reduced, however, the introduction of self-service options on the Census website made it easier for people to report if they would not be at home on Census night. In addition, an occupancy determination model was developed for 2021 which helped to more accurately determine whether a dwelling was occupied or unoccupied on Census night in the absence of reliable field information. These two innovations have helped ameliorate the impact of restricted field activities due to the pandemic. More details of the impact of imputation are shown in Appendix C.
Total net undercount
This is the net result of the components of undercount and overcount. Total net undercount for 2021 was 190,044 persons, or 0.7% of the population. This was a decrease of 16.1% from the corresponding figure for 2016 (226,407 persons or 1.0% of the population).
This section refers to total net undercount when distinguishing from the components of overcount and undercount for persons on Census forms or persons imputed. For the remainder of this report, total net undercount is abbreviated to net undercount unless an explicit distinction is required.
Persons on Census forms (a) | Persons imputed (b) | Total | |||
|---|---|---|---|---|---|
Gross undercount (c) | Gross overcount (d) | Net undercount | Net overcount (e) | Net undercount | |
no. | no. | no. | no. | no. | |
2021 | 1,032,660 | 314,788 | 717,872 | 527,828 | 190,044 |
2016 | 1,150,588 | 274,673 | 875,915 | 649,509 | 226,407 |
Change (%) | -10.2 | 14.6 | -18.0 | -18.7 | -16.1 |
% (f) | % (f) | % (f) | % (f) | % (f) | |
2021 | 4.0 | 1.2 | 2.8 | 2.1 | 0.7 |
2016 | 4.9 | 1.2 | 3.7 | 2.7 | 1.0 |
Change (% points) | -0.9 | 0.0 | -0.9 | -0.7 | -0.3 |
(a) Excludes Late Returns and Quality Flagged Census records.
(b) Persons are imputed into dwellings that were non-responding in the Census and deemed to be occupied on Census night.
(c) Persons missing from Census forms and persons in dwellings missed in the Census.
(d) Persons included in error, or multiple times.
(e) Net overcount for Census imputed persons represents over-imputation. This column includes a small contribution from Late Returns and Quality Flagged Census records.
(f) Percentages are calculated using Post Enumeration Survey population estimate as the denominator.
Note: Excludes Other Territories and overseas visitors.
It is important to note that the Post Enumeration Survey is designed to provide the best measure of Census coverage at a single point in time, rather than as a time series across Censuses. Therefore, the Post Enumeration Survey estimates of undercount and overcount are not strictly comparable over time due to changes in both Census and Post Enumeration Survey methodologies. For example:
- a new estimation process was introduced in the 2006 Post Enumeration Survey, along with the inclusion of remote areas and discrete communities[1] in the Post Enumeration Survey sample;
- Automated Data Linking between Post Enumeration Survey and Census person records was introduced in 2011;
- the 2016 Census underwent a number of changes to its collection methodology, with some changes to Post Enumeration Survey enumeration procedures as a result; and
- the 2021 Post Enumeration Survey introduced further changes to the collection methodology, namely the use of the Address Register (rather than an area-based frame) as the survey frame and the widespread use of telephone interviewing (using an approach letter to elicit response). There were also improvements made to enumeration procedures as well as changes made due to COVID-19 lockdowns.
[1] See Glossary
3.2.3 Analysis of gross coverage
While net undercount provides a picture of the net coverage error in the Census, as a single measure it can conceal the elements that help us understand the quality of Census coverage; for example, where high gross measures of overcount and undercount net out to a small net undercount. Gross coverage enables us to look at how well the population was captured without the added layers of people counted more than once or in error (overcount), and imputed people (where no Census form was received for a dwelling deemed occupied on Census night).
Figure 3.2.1 shows net undercount and gross coverage error. Gross coverage error is 100 minus gross coverage; for example, if gross coverage is 90%, the gross coverage error is 10%.
In 2016, the net undercount rate was 1.0% and the gross coverage error rate was 7.1%. In 2021, the net undercount rate dropped to 0.7% and the gross coverage error rate dropped to 6.1%, similar to 2011, indicating that better coverage was achieved compared to 2016.
Note: Excludes Other Territories and overseas visitors.
3.2.4 State and/or territory of usual residence
Figure 3.2.2 shows the total net undercount rate for all states and territories for the past three censuses.
In 2021, as in previous censuses, the Northern Territory recorded the highest total net undercount rate of all states and territories (6.0%) up from 5.0% in 2016 but lower than 6.9% in 2011. The Australian Capital Territory recorded the lowest total net undercount rate (-0.6%, i.e. a net overcount). This is consistent with previous Post Enumeration Surveys, although this is the second Census in a row when the Australian Capital Territory has recorded a net overcount.
While the two territories continue to reflect the minimum and maximum total net undercount rates, trends across the states have shifted, with New South Wales, Victoria and Queensland experiencing decreases in net undercount in 2021 compared to 2016 and 2011. In contrast, South Australia, Western Australia and Tasmania reversed the trend experiencing increases in net undercount in 2021 compared to 2016. Western Australia’s net undercount in 2021 was higher than the previous two Censuses.
Note: Excludes overseas visitors. Australia excludes Other Territories.
The components of overcount and undercount for the states and territories are shown separately in Table 3.2.3. The net undercount rates for persons on Census forms are similar for the six states but differ markedly for the Northern Territory (10.4%) and the Australian Capital Territory (1.6%). The largest improvements between 2016 and 2021 have been in New South Wales and Victoria, with net undercount rates (for persons on Census forms) both decreasing by 1.5 percentage points. The largest decline has been in the Northern Territory and Western Australia, with net undercount increasing by 1 percentage point and 0.8 percentage points respectively. In contrast, the net overcount for persons imputed is lower in all states and territories in 2021 when compared with 2016, except for the Northern Territory, which has remained stable. The Northern Territory has the highest net overcount rate for persons imputed, which is not surprising given the Census non-response rate was also the highest in the Northern Territory.
NSW | Vic. | Qld | SA | WA | Tas. | NT | ACT | |
|---|---|---|---|---|---|---|---|---|
| % | % | % | % | % | % | % | % |
2021 | ||||||||
Net undercount rate for persons on forms | 2.1 | 2.2 | 3.4 | 2.6 | 4.6 | 3.5 | 10.4 | 1.6 |
Net overcount rate for persons imputed | 2.2 | 1.9 | 2.4 | 1.7 | 1.6 | 1.9 | 4.4 | 2.2 |
Total Net undercount rate | 0.0 | 0.3 | 1.0 | 1.0 | 3.0 | 1.6 | 6.0 | -0.6 |
2016 | ||||||||
Net undercount rate for persons on forms | 3.6 | 3.7 | 4.1 | 3.0 | 3.8 | 3.0 | 9.4 | 1.4 |
Net overcount rate for persons imputed | 2.8 | 2.3 | 2.8 | 2.8 | 3.4 | 2.9 | 4.4 | 2.5 |
Total Net undercount rate | 0.8 | 1.4 | 1.3 | 0.2 | 0.4 | 0.1 | 5.0 | -1.1 |
2011 | ||||||||
Net undercount rate for persons on forms | 3.7 | 2.6 | 3.4 | 2.3 | 4.5 | 3.2 | 8.9 | 2.0 |
Net overcount rate for persons imputed | 1.8 | 1.6 | 1.7 | 1.2 | 1.9 | 1.2 | 2.0 | 1.3 |
Total Net undercount rate | 1.9 | 1.1 | 1.8 | 1.1 | 2.5 | 2.0 | 6.9 | 0.7 |
Notes: Excludes Other Territories and overseas visitors.
Percentages may not add exactly due to rounding in cells.
Comparing net undercount rates with gross coverage error for states and territories (Figure 3.2.3) shows that both net undercount and gross coverage error have decreased in New South Wales, Victoria, Queensland, and the Australian Capital Territory. While net undercount has increased in South Australia, the gross coverage error has remained stable, indicating good Census coverage with less over-imputation. In Western Australia and Tasmania both net undercount and gross coverage error have increased, while in Northern Territory the net undercount has increased but the gross coverage error has decreased indicating better coverage by the Census despite an increase in the net undercount.
Note: Excludes Other Territories and overseas visitors.
3.2.5 Age and sex
Previous censuses (both in Australia and overseas) have observed that young adults are more likely to be missed, whereas older adults are more likely to be counted or overcounted in a census. Newborn children are often mistakenly omitted from census forms, and younger males are also traditionally more likely to be missed than females as they tend to be more mobile and more likely to be working away from home. As can be seen from Figure 3.2.4, these trends hold true for the 2021 Census. Relatively high total net undercount rates were observed for the 20-24, 25-29 and 30-34 year age groups (2.1%, 1.7% and 1.7%, respectively) and the highest total net undercount rate was observed for 10-14 year olds (2.3%). In contrast, older age groups had lower total net undercounts (usually overcounts), with the largest net overcount of 2.0% observed for people aged 85 and over, and 1.5% observed for people aged 75-79 years.
Males are more likely to be missed in the census compared to females. In 2021, the total net undercount rate for males was 1.3% while for females it was 0.2% and this is consistent with previous censuses. The total net undercount rates for males and females were 1.5% and 0.4% for 2016, respectively, and 2.2% and 1.2% for 2011, respectively. For males, those aged 30-34 years had the highest total net undercount rate of all age groups (3.6%) followed by 20-24 year olds (3.0%). For females, those aged between 10-14 years had the highest total net undercount at 2.2%. This was a similar pattern to the 2011 Census. Total net undercount for children aged 0-4 years more than halved in 2021 compared to 2016 (1.7% compared to 5.1%, respectively).
Note: Excludes Other Territories and overseas visitors.
Figure 3.2.5 shows that net overcount for imputed persons is more evenly spread across nearly all age groups in 2021 compared with 2016, and this appears to be driven by changes in Census imputation methodology with younger adults more likely to be imputed in 2021 than in previous censuses. As in previous censuses, people aged 0-19 years have much lower rates of over-imputation, while in 2021 people aged 85 years and over had the highest. In 2016, there were consistently higher rates of over-imputation for people aged 55 years and over and this has reduced in 2021.
Note: Excludes Other Territories and overseas visitors.
Figure 3.2.6 shows the net undercount for persons on Census forms by age. While total net undercount remains highest in the young adult age groups, particularly for 20-24 and 25-29 year olds, overall it is generally lower and more evenly spread across all age groups in 2021 than was the case in 2016.
Note: Excludes Other Territories and overseas visitors.
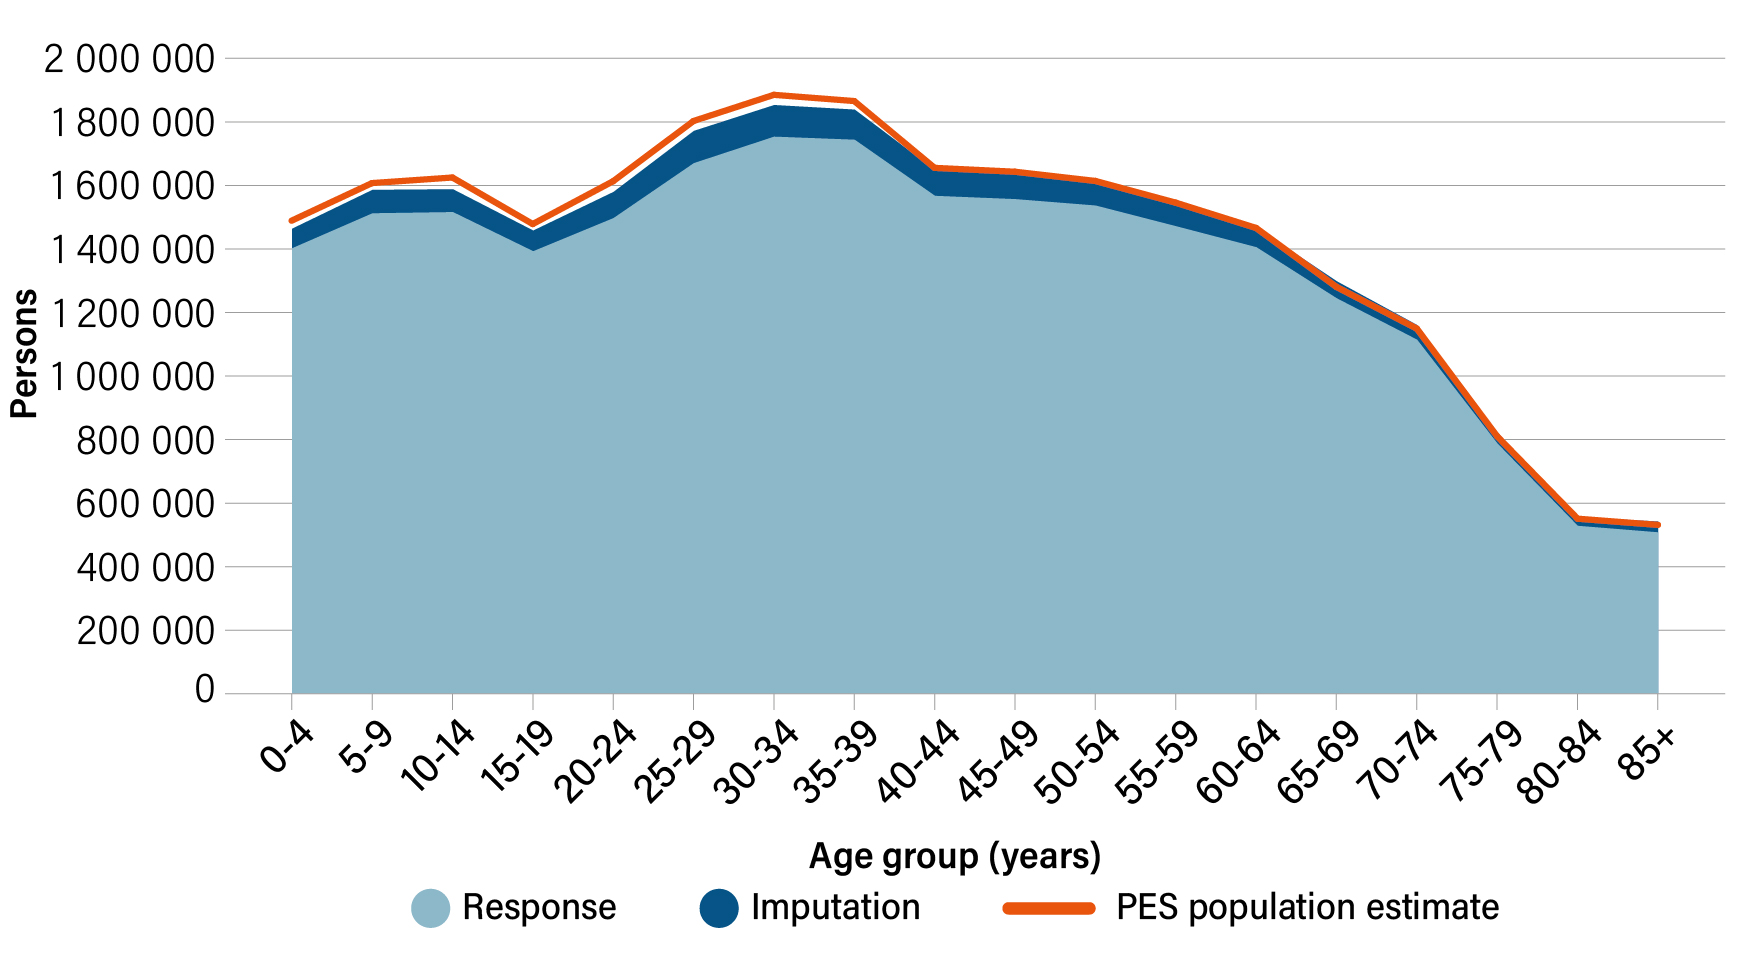
Figure 3.2.7 illustrates the overall outcome: the total Census count (responses plus imputation) is lower than the Post Enumeration Survey population estimate for younger age groups and very close to the estimates for people aged 40 to 64 years. For people aged 65 years and over, the Census counts (including imputation) are slightly larger than the Post Enumeration Survey population estimates. There has been an improvement in the imputation approach used in 2021 with the counts including imputed persons being closer to the Post Enumeration Survey estimates than was the case in 2016, especially for people under the age of 40 years.
Figure 3.2.7 Census night population of usual residents: 2021 Census versus Post Enumeration Survey estimates by age group
Image
Description
Note: Excludes Other Territories and overseas visitors.
3.2.6 Country of birth
The net undercount rates for country of birth in Figure 3.2.8 are displayed for the 10 highest ranked countries (in terms of population residing in Australia), according to the 2021 Census.
While there has always been some non-response to the Country of birth question, with increasing uptake of the online Census, non-response has decreased. For those who do not respond to the question, since Census does not impute a country of birth for these people, they are not included in Census counts for these categories. However, they contribute to net undercount estimates based on the category in which they should have been counted, as reported in the Post Enumeration Survey. There were 1,372,273 people (5.4%) whose country of birth was not stated in the 2021 Census or for whom the response was unable to be coded to a country, a decrease from 1,622,118 people (6.9%) in 2016.
Reflecting the overall decrease in net undercount seen across the population, there has been a decrease in net undercount compared to 2016 across nearly all of the top 10 countries of birth listed. The exception is New Zealand, with a net undercount rate of 8.5% in 2021, up from 5.5% in 2016. Persons born in South Africa have the second highest rate in 2021 (6.3%), followed by Australia (6.2%). Persons born in Italy had the lowest net undercount of the top 10 countries in 2021 at 1.8% and this was a significant decrease from 5.5% in 2016.
Note: Excludes Other Territories and overseas visitors.
People who have come to Australia from other countries and whose first language is not English may find completing a Census form more difficult than other Australians. For several censuses, special strategies have been employed to promote an understanding of the Census among migrants and to provide assistance in a range of languages.
3.2.7 Implications for Census quality
The Post Enumeration Survey shows that the Census population data, adjusted by the Post Enumeration Survey, is fit-for-purpose for its important use in rebasing the Estimated Resident Population at the national and state and/or territory level.
The total net undercount is small at the national level (0.7%) and for the states and territories with the exception of the Northern Territory and Western Australia. The Northern Territory continues to have the highest total net undercount.
Aboriginal and Torres Strait Islander peoples continue to be under-represented in the Census. The Post Enumeration Survey estimates the net undercount rate to be about 17% for each of the last three Censuses (for more see Section 3.5 Aboriginal and Torres Strait Islander peoples) despite increased investment in the enumeration of this population. COVID-19 lockdowns and border closures had an impact on the availability of field staff within states and interstate, and it is likely that these factors had an impact on the enumeration of Aboriginal and Torres Strait Islander peoples in some areas. The enumeration of Aboriginal and Torres Strait Islander peoples continues to be a priority area for attention by ABS. Despite this high net undercount, the Post Enumeration Survey enables the Estimated Resident Population estimates for this population to be rebased.
The net undercount rate for persons on Census forms (2.8%) has decreased compared with 2016 (3.7%), reflecting in particular a decrease in persons missing from Census forms (4% in 2021 compared to 4.9% in 2016), while persons counted more than once or in error has remained stable at 1.2%. The net overcount rate for persons imputed has decreased from 2.7% to 2.1%. This reduction in over-imputation is the result of improvements in the correct identification of occupancy in the Census, even though this was more difficult because of pandemic-based contact restrictions at the time of the Census. The Post Enumeration Survey also shows that while age skewing in the Census data has improved in 2021 compared to 2016, there are not enough persons aged 39 years and under in the Census counts.