Report on the quality of 2021 Census data: Statistical Independent Assurance Panel to the Australian Statistician

An independent view of the quality of statistical outputs from the 2021 Census of Population and Housing

Released
28/06/2022

Executive summary

Decorative banner

The 2021 Census was conducted at a unique time in Australia’s history, with enumeration occurring during the COVID-19 pandemic when much of south-eastern Australia was in lockdown on or about Census night. All censuses aim to provide a timely, contemporary, and detailed view of the circumstances of Australia’s people and communities, but the 2021 Census is particularly important as it provides a view of Australians and Australia during the pandemic.

In recognition of the importance of Census data, particularly at the time of a pandemic, and the importance of being transparent about data quality, the Australian Statistician established the 2021 Census Statistical Independent Assurance Panel (the Panel) in late 2020 to provide assurance and transparency for the 2021 Census data.

The Panel has concluded that the 2021 Census data is fit-for-purpose, is of comparable quality to the 2011 and 2016 Censuses and can be used with confidence.

The high response rate for private dwellings (96.1%) was an outstanding achievement given the challenges provided by the pandemic and is comparable to response rates seen in other countries, such as Canada and the United Kingdom, which undertook censuses during the pandemic, and higher than that of New Zealand, where the census was conducted pre-pandemic.

The 2021 Census paints a comprehensive and detailed picture of Australia’s population. This was enhanced by the inclusion of two new topics, namely Long-term health conditions and Australian Defence Force service, which were the first significant changes to the information collected on the Census since 2006.

In forming its view, the Panel examined a number of key topics, including Sex, Age, Income, counts of Aboriginal and Torres Strait Islander peoples, Country of birth, Language, Ancestry and Religion. The Panel’s analysis revealed that the items reviewed have results which are consistent with previous censuses and/or independent data sources and/or align with observations consistent with expected societal change or pandemic impacts, especially when interpreted in association with the Australian Bureau of Statistics (ABS) quality assessments.

The 2021 Census population counts align well with expectations. Counts of the population at the national and state and/or territory level derived from the 2021 Census, adjusted by the Post Enumeration Survey, compare well to the Estimated Resident Population, Australia’s official population estimate, and can be used to rebase these estimates.[1] Key quality indicators from the Post Enumeration Survey support the comparability of the 2021 and 2016 Censuses, with some improvements observed. The net undercount rate for persons on Census forms decreased from 3.7% to 2.8% between 2016 and 2021, and their gross overcount has remained stable at 1.2%.

The Panel considers that the Census is clearly fit-for-purpose for all of its uses, including the most important uses like rebasing the population estimates.

Alongside these findings, the Panel has made several observations.


[1] The Panel is not in a position to make a judgment about data quality below the state and/or territory level due to time constraints.

Conducting the 2021 Census during the pandemic

The 2021 Census was conducted at a time when many parts of Australia were in lockdown and movements within, into and out of Australia were tightly controlled. The ABS faced difficulties with recruitment of field officers, reflecting a tight labour market, and other challenges caused by the pandemic, such as restrictions on the movement of field staff both intra and interstate. Nevertheless, through appropriate planning, risk management, and rigorous testing, disruptions to Census field operations due to the pandemic were largely overcome without impact on the quality of Census data or safety of the public and Census staff. The Panel considers that the ABS’s approach to conducting the 2021 Census during the pandemic was impressive and well managed.

The Panel observed the expected impact of COVID-19 on peoples’ movements within, into and out of Australia across a range of census data items, including the expected declines in foreign student populations and the impact of almost no permanent migration for an extended period. In addition, more people were counted at home in the 2021 Census than previously, due to reduced population movement prior to and during the time of the Census. This has enhanced data quality.

Innovations in the Census

The ABS introduced a number of important innovations in the 2021 Census and these served Australians well by improving the Census experience. The introduction of new online self-service options greatly assisted data collection, as did the total redevelopment of the online Census form. The form’s ease of use proved especially useful given the disruptions to field operations because of COVID-19 restrictions – people could easily access help and the online form, which they did, and in much larger numbers than in previous censuses.

Opportunities for future Censuses

In reviewing the 2021 Census data, the Panel identified some opportunities to enhance future censuses. The Australian Bureau of Statistics should consider:

  1. Reviewing the results from the Census and Post Enumeration Survey for insights into any systemic gaps in the Address Register.
  2. New opportunities for improving response rates in remote and regional areas, including innovations in enumeration methods.
  3. Innovative solutions, including the use of administrative data, to improve the undercount of Aboriginal and Torres Strait Islander peoples, in partnership with Aboriginal and Torres Strait Islander peoples.
  4. Opportunities to refine and enhance further the processes of occupancy determination and imputation for non-responding households, using administrative data.
  5. Analyse the level of improvement to census data from the use of electricity data, with a view to the potential use of dwelling level data in the 2026 Census.
  6. Continue to develop innovative options to enhance user experience and encourage response for the 2026 Census.
  7. As part of the consideration of content for the 2026 Census, evaluate the two new topics, Australian Defence Force service and Long-term health conditions, to inform the value of their continued inclusion in the 2026 Census.
  8. The Statistical Independent Assurance Panel should be continued for future Censuses to provide greater transparency, accountability and assurance.

2021 Census Statistical Independent Assurance Panel

Decorative banner

This report has been authored by the 2021 Census Statistical Independent Assurance Panel. Members of the Panel are:

  • Panel Chair Professor Sandra Harding, AO
  • Ms Leanne Liddle
  • Professor Peter McDonald, AM
  • Mr Peter Morrison
  • Mr Dennis Trewin, AO
  • Mr Stephen Walters

The Statistical Independent Assurance Panel acknowledges the Traditional Owners and Custodians of Country across Australia and their continuing connection to land, waters and Community. We pay our respects to their cultures and their Elders past and present.

Recommended citation: Harding, S. Liddle, L., McDonald, P., Morrison, P., Trewin, D., Walters, S. (2022). Report on the quality of 2021 Census data. Retrieved from https://www.abs.gov.au/census/about-census/census-statistical-independent-assurance-panel-report

PDF version of the report

Decorative banner

A file containing the full report is also available. See Report on the quality of 2021 Census data - PDF file

Transmission and Acceptance Letters

Decorative banner

Professor Sandra Harding, the Panel Chair, provided the Panel's report to Dr David Gruen, the Australian Statistician. Professor Harding's transmission letter and Dr Gruen's acceptance letter can be found in Census Statistical Independent Assurance Panel findings.


1. Introduction

An independent view of the quality of statistical outputs from the 2021 Census of Population and Housing

Released
28/06/2022

1.1 Background

Decorative banner

The Australian Bureau of Statistics (ABS) conducts a Census of Population and Housing (the Census) every five years. The data collected provides valuable information for policy making and research and is used widely, including setting electoral boundaries and other such applications.

On 18 June 2020, the ABS announced that Census night for Australia’s 18th Census would be 10 August 2021. The ABS planned the 2021 Census to achieve three strategic outcomes:

  • Smooth running: The Census process is easy, simple, and secure.
  • Strong support: Governments, businesses and the community have confidence in the Census and there is a high level of community participation.
  • High quality data: Census data is high quality and widely used to inform on policy and areas of importance to Australia.

As in 2016, the 2021 Census was planned to be multi-modal, with the expectation that approximately 75% of Australian households would complete their Census online. This expectation was exceeded, with nearly 80% of responding households completing their Census online. This was enabled by the development of an entirely new online Census form and digital service, as well as the implementation of a communication campaign that supported a window of time to complete the Census, rather than a single night. The overall dwelling response rate for Australia was 96.1%, an excellent outcome given the target of greater than 95% and the challenges of the pandemic.

People were actively encouraged to complete their Census form online. A letter was delivered to most households with a unique login ID and instructions to complete online. Paper forms were delivered to households where completing online was less likely to be preferred or possible, and paper forms were also available on request to everyone in Australia. The ABS ensured a range of innovative approaches were used so that the enumeration of the entire population was as complete as possible. For the first time, people could complete their Census online without having a Census login code (see Appendix E).

The 2021 Census collected responses on two new topics: Long-term health conditions and Australian Defence Force service. These were the first significant changes to the information collected in the Census since 2006. Changes were also made to the way certain topics were collected. Notably, response categories of 'Aboriginal' and 'Torres Strait Islander' were added to the Ancestry question; respondents had the option of identifying as non-binary sex; and the Language question was updated to refer to language used (rather than language spoken), to enable inclusion of sign languages such as Auslan.

The emergence of the world-wide COVID-19 pandemic in early 2020 introduced a range of challenges across the globe for people, communities, governments, businesses, and countries. Australia experienced the pandemic through several waves during 2020, 2021 and 2022, resulting in the 2021 Census being conducted at a unique and challenging time in Australia’s history. Much of south-eastern Australia was in lockdown on or about Census night, equating to over half of Australia’s population. The ABS’s response was impressive and well managed. Further details on ABS’s management of the Census in the pandemic are available in Section 4 of this report ‘COVID-19 and the 2021 Census’.

The 2021 Census data, collected at such an important and unique time in Australia’s history, provides a timely, contemporary, and detailed view of the circumstances of Australia’s people and communities during the COVID-19 pandemic.

In recognition of the importance of Census data, and the importance of being transparent about data quality, the Australian Statistician established the 2021 Census Statistical Independent Assurance Panel (the Panel). The Panel was established in late 2020 to provide assurance and transparency for the 2021 Census data.

Such a panel had first been established following the 2016 Census. The Report on the Quality of 2016 Census data produced by the 2016 Census Independent Assurance Panel noted that the establishment of an Independent Assurance Panel should be repeated for future censuses. The ABS accepted this suggestion and all other opportunities identified by the 2016 Census Independent Assurance Panel. More information on how the opportunities identified in the 2016 report were addressed is provided in Appendix A.

1.2 Purpose of this report

Decorative banner

This report presents the findings of the Panel following its review of the quality of the 2021 Census data and provides information to enable governments, the community, and other stakeholders to make an informed judgment about the fitness-for-purpose and credibility of the 2021 Census data.

1.3 The 2021 Census Statistical Independent Assurance Panel

Decorative banner

The Panel, comprising a group of experts with diverse experience and backgrounds, was tasked by the Australian Statistician to provide an independent assessment of the quality and fitness- for-purpose of the 2021 Census of Population and Housing data.

The Terms of Reference for, and membership of, the Panel are in Appendix D.

The Panel undertook this review as a body independent of the Australian Statistician.

1.4 Scope and approach of this report

Decorative banner

This report provides a high-level analysis of the quality of the 2021 Census data and focuses on key aspects of the Census data. It does not provide detailed quality reports on all data items or geographies.

The Panel was provided access to data from the 2021, 2016 and 2011 Censuses, data from the 2021 Post Enumeration Survey, information on Census processes, and other information as requested. The Panel was also provided Secretariat support from the ABS and engaged throughout the review process with ABS and Census officials.

Under its Terms of Reference, the Panel was required to consider the quality effects of Census design, enumeration, and processing, and to compare the 2021 Census results with the previous two Censuses and various other ABS and non-ABS data sets. The Panel also compared the quality indicators of the Census outputs against selected international censuses. The Panel’s assessment of quality was also guided by the accuracy framework described in Appendix C.

2. About the Census

An independent view of the quality of statistical outputs from the 2021 Census of Population and Housing

Released
28/06/2022

Overview

Decorative banner

The ABS conducts a Census of Population and Housing every five years as required by the Commonwealth Census and Statistics Act 1905. Regularly taking a census provides a comprehensive snapshot of the nation and enables the updating and maintenance of an accurate time series of Australia’s official population estimates.[1]

The Census counts everyone in Australia on Census night and asks about where they were on the night (referred to as their place of enumeration), their place of usual residence and numerous other questions. In 2021, Census night was designated as 10 August. While Census night is the reference night in respect of which people are asked to complete their Census forms, there is no requirement for people to complete their Census form on Census night. The ABS emphasised this in 2021 with a message to the public that they had a ‘window’ of time (before, on and after Census night) to respond to the Census, to increase response (for more detail see Section 2.3).

While the public were encouraged to complete their Census in this ‘window’, the online Census form was open for approximately 10 weeks. Paper forms were accepted for as long as practicable to allow as many people as possible to respond, with the last paper form included in Census processing having been received in December 2021.

The Census collects data on a broad range of topics including Marital status, Family size, Occupation, Language used at home, Country of birth, Australian citizenship, Income, and Ancestry. In 2021, two new questions, on Long-term health conditions and Australian Defence Force service, were included in the Census. In addition, a third response category was added to the Sex question, to allow people to identify as non-binary sex. Also, the Ancestry question was expanded to add tick boxes for Aboriginal and Torres Strait Islander ancestries.


[1] Australian Bureau of Statistics (2019). Planning the 2021 Census. Available at https://www.abs.gov.au/statistics/research/planning-2021-census#more-information

2.1 Uses of the Census

Decorative banner

The purpose of the Census is to measure the number and key characteristics of persons and dwellings in Australia on Census night. This provides a reliable basis to estimate the population for each state and territory and local government area.

The Census also provides the characteristics of the Australian population and its housing for small areas and specific population groups. Census data is used by individuals, organisations, and government to make informed decisions on issues that impact the lives of all Australians.

The ABS identifies four main uses for the Census.[1]

  1. Allocation of government funds and support for elections
    The official population estimates, which are based on Census population counts, are used in the process of allocation of Commonwealth funds to state, territory and local governments, including Goods and service tax (GST) entitlements, and to determine the number of seats each state and territory has in the House of Representatives. The GST entitlements of the states and territories will amount to more than $80 billion in 2022-23.[2] The population estimates are also used as part of the process for determining electoral boundaries for both Australia and most states and territories.
  2. Planning and administration
    The Census provides the characteristics of the population and its housing to support the planning, administration and policy development activities of governments, business and other users. For example, these characteristics have been used to inform the planning of new hospitals and schools.
    While information from other sources provides useful input, only the Census can provide accurate information, nation-wide, and for small geographic areas and population groups.
  3. Use in other ABS statistics
    Census data form the basis of many of the ABS’s most widely used products and services. One is the official population estimates, which are updated each quarter. Population estimates are used in compiling the monthly employment and unemployment statistics and the National Accounts. The Census counts of people and dwellings for each geographic area are also used in the framework for selecting the samples for ABS household surveys.
    In recent years, the ABS has sought to further maximise the use of the Census. Along with other Commonwealth partner agencies, it has linked Census data with a wide range of administrative data to create the Multi-Agency Data Integration Project (MADIP), a secure dataset designed to improve and expand the range of statistical and research insights about Australia. MADIP combines data from the Census with information on health, education, government payments, employment, income and taxation, and employment.
  4. Community uses
    The ABS releases Census results in analytical articles, QuickStats, Community Profiles, TableBuilder and DataPacks.[3] Governments, members of the public, businesses, researchers and community groups use these products to find comprehensive information for small geographic areas and population groups as well as for states, territories and the country as a whole. In addition to direct engagement with ABS products, many people access ABS statistics indirectly, such as through media articles and reporting of aspects of ABS findings.


[1] Australian Bureau of Statistics (2011). How Australia Takes a Census, 2011: Uses of Census Data [Government Paper]. Retrieved from http://www.abs.gov.au/ausstats/abs@.nsf/lookup/2903.0Main%20Features132011

[2] Australian Government (2022). Part 3: General revenue assistance’, Budget 2022-23. Available at https://budget.gov.au/2022-23/content/bp3/download/bp3_13_part_3.pdf

[3] These are standard Census products available from the ABS website.

2.2 How the Census, Post Enumeration Survey, and Estimated Resident Population are related

Decorative banner

One of the most important and well-known uses of the Census is its contribution to Australia’s official population estimates, the Estimated Resident Population. The Estimated Resident Population is compiled through a combination of Census population counts, Post Enumeration Survey estimates, and other administrative sources.[1]

The Post Enumeration Survey[2] is a survey of about 50,000 dwellings, conducted soon after the completion of the Census period. It provides an independent benchmark of the completeness of Census counts. Key changes introduced for the 2021 Post Enumeration Survey were the use of a telephone-first interview approach, and the use of the Address Register (a comprehensive list of all known physical addresses within Australia) for the survey frame.

The Post Enumeration Survey interview process determines whether a person in the sample should have been counted in the Census, and the category in which they should have been counted (such as age, sex, or state of usual residence and whether they are of Aboriginal and/or Torres Strait Islander origin). A matching process determines if they were counted, how many times they were counted, and the characteristics they were counted with. This is done by directly linking Post Enumeration Survey persons and dwellings to their matching Census forms (where they exist). This enables estimates of net overcount or net undercount, which are then applied as part of the five-yearly rebasing of the Estimated Resident Population.

The Estimated Resident Population is a population estimate by geographic area, age and sex and is used to inform many planning decisions by governments and investment decisions by businesses. It is used to plan and forecast needs for housing, schools, hospitals, shopping centres, child and aged care services and transport infrastructure. It is used in the National Agreement on Closing the Gap and more broadly in a range of forecasting and modelling. The Estimated Resident Population is also used to guide the distribution of government funds to states and territories, which flow on to smaller areas such as local governments and is a major factor in the determination of electoral boundaries. The calculation and frequent updating of the Estimated Resident Population is part of the statutory role of the ABS. The Estimated Resident Population forms the basis of the population projections made from time to time by the ABS.

After every census, the Estimated Resident Population is recalibrated, or rebased. Rebasing is done by adding the net overcount or net undercount from the Post Enumeration Survey to the new Census population counts. Further demographic and time adjustments are then made before the Estimated Resident Population data is finalised. Further information on this process is provided at Appendix B.

The Post Enumeration Survey is important as it provides:

  • an independent measure of the completeness of the Census counts;
  • a critical component for rebasing of the Estimated Resident Population to the latest Census; and
  • assistance in identifying improvements for future censuses.


[1] For more information on the Estimated Resident Population, see National, State and Territory Population. This can be accessed at: https://www.abs.gov.au/statistics/people/population/national-state-and-territory-population/latest-release [2] Information regarding the structure and methodology of the Post Enumeration Survey can also be found at: Australian Bureau of Statistics (2022). 2021 Census overcount and undercount. Available at  https://www.abs.gov.au/statistics/people/population/2021-census-overcount-and-undercount/2021

2.3 Key features of the 2021 Census

Decorative banner

As in 2016, the 2021 Census was ‘digital first’. Most households received Census instructions in the mail to complete online, while paper forms were readily accessible via an automated phone service or through online self-help. Some areas where there were, for example, higher numbers of older people or areas where previous Census response had been lower, received a paper form upfront. People living in remote areas and most people experiencing homelessness had help from Census field staff.

The enumeration model for 2021 built on the success of the 2016 approach, which was based on mail out areas (areas which meet criteria for residential address mailability) and drop off areas (areas with poor address information or difficult to access by mail). The proportion of mail out areas increased from 80% in 2016 to 85% in 2021.

There were three phases of enumeration for the 2021 Census - Approach, Reminder and Visit:

  • Approach phase, when letters and, in some areas, paper forms were mailed to addresses (85% of dwellings), with deliveries by early August. The letters requested online participation on Census night but with the option of requesting a paper form. The remaining dwellings (15% of dwellings) were visited by a field officer who hand delivered a paper form. People in these areas still had the option of completing their forms online with online access codes printed on the paper forms. The aim of the approach phase was to ensure that all dwellings were ‘enabled’ by Census night, having received either a letter or a paper form by that date.
  • Reminder phase began after Census night with the start of reminder activities to prompt response. The standard reminder was a letter with online access codes mailed to non-responding dwellings in mail out areas.
  • Visit phase, when field officer visits to non-responding dwellings commenced. Visits to non-responding dwellings in drop off areas commenced earlier than in mail out areas because reminder letters could not be sent to these addresses.

A key feature of the 2021 Census was a change in the messaging about when people should complete their Census. In 2021, Census Instruction Letters were delivered to dwellings across Australia with the banner ‘It’s time to complete your Census – online form open now'. This messaging, reinforced by the Census media campaign, subtly encouraged households to complete their Census as soon as they received their materials and therefore before Census night on 10 August. The letters also emphasised 12 August as a date after which the household may receive contact from the ABS. This messaging was designed to provide a ‘response window’, whereas in previous censuses only Census night was highlighted. Encouraging households to complete their Census early gave them greater flexibility, potentially increasing overall Census response. It was also designed to smooth the response over Census night and thereby assist the ABS in its management of operations. Census results show that the ‘response window’ influenced the timing of response in the 2021 Census, with more than 3 million private dwellings responding before Census night, significantly more than responded early in previous censuses (see Figure 2.3.1). While a significant number still responded on Census night (over 2.5 million), the window was effective in prompting early response and smoothing the submission of Census forms.

Figure 2.3.1 Timing of private dwelling response during 2021 Census field operations

Line chart as described in the paragraph above and the description for this image.
The graph has a line showing the number of private dwellings responding to the Census daily from 26 July 2021 to 10 October 2021. Census night is marked on the graph. The graph shows that more than 3 million dwellings had responded before Census night and over 2.5 million responded on Census night.

Note: Data excludes remote area operations.

Strategies were put in place to maximise the coverage and response of specific population groups, geographic areas and dwelling types. Prioritised population groups included Aboriginal and Torres Strait Islander peoples in urban, regional and remote areas, people from culturally and linguistically diverse backgrounds, people experiencing homelessness, people in aged care, incarcerated people and people with disabilities. As in 2016, various strategies were put in place but engagement with stakeholders was a key strategy across all population groups, with the level of engagement scaled up for 2021. Information hubs were a new aspect of face-to-face assistance in 2021, with Census engagement staff setting up information booths in the community to answer questions, issue paper forms and raise awareness.

A Remote Area Strategy was developed to enhance the enumeration of remote Aboriginal and Torres Strait Islander communities across Australia, covering 51% of the country and including more towns than in 2016. A key change for 2021 was the move to an Aboriginal and Torres Strait Islander led engagement model with a strong emphasis on collaboration with communities and local staff employed where possible. In these areas, the Census was conducted, as in previous years, over an extended period to ensure that Census field staff could cover vast areas and help people complete the Census through face-to-face interviews where required. As in previous censuses recruitment difficulties were experienced in some parts of the country, in particular remote areas, and these were exacerbated by COVID-19 restrictions which limited the movement of field staff within lockdown areas and across state and territory borders. An innovation in the management of remote field operations was the use of a dedicated mobile app, called ‘MyWork’, which greatly improved monitoring of operations and the timely response to issues.

Following the events of Census night in the 2016 Census, when the ABS took down the online form as a precautionary measure after experiencing a series of Distributed Denial of Service attacks, and the recommendations that emerged from several subsequent reviews, the ABS prioritised security and performance, as well as data quality and accessibility in the redevelopment of its ‘digital service’ for the 2021 Census. The digital service included a new public Census website, the online form and a range of self-service options to make it easier for people to complete their Census. In preparation for the 2021 Census, the ABS worked closely with the Australian Cyber Security Centre who provided substantial insight into the development of robust census systems. In addition, the ABS welcomed a review by the Australian National Audit Office, taking all the recommendations from that review into account.

Names and addresses continue to be important data collected on the Census form. As a result of the 2021 Census Privacy Impact Assessment, which was conducted by external experts, names of respondents will be retained for 18 months and form addresses retained for 36 months.

2.4 The 2021 Census and the pandemic

Decorative banner

Running a census is a huge undertaking in normal circumstances but conducting one in a pandemic added complexity. While most of the population received their letters or paper forms and participated as planned, COVID-19 lockdowns progressively disrupted some aspects of Census enumeration, reducing contact with households and non-private dwellings such as hospitals and nursing homes.

In response to the emergence of the pandemic, the ABS had developed a Census COVIDSafe step-down plan and framework to manage field staff and community safety during operations. This plan was put through its paces during the major large-scale Census test in 2020, ultimately providing confidence to the ABS, stakeholders and field staff that the 2021 Census could go ahead. However, with more than half Australia’s population in lockdown at some stage during the Census enumeration period, aspects of field operations were significantly disrupted, particularly in New South Wales and Victoria. The ABS’s management of the Census in the pandemic is explained in more detail in Section 4 ‘COVID-19 and the 2021 Census’.

2.4.1 Occupancy determination

Restricted field operations presented new and unique challenges to determine whether dwellings were occupied due to the combination of a ‘no contact’ approach and ways in which expected occupancy has changed due to COVID-19. However, the ABS had developed a probability model for the 2021 Census to improve the accuracy of determining whether a dwelling was occupied or not on Census night. This was used during Census processing when there was insufficient information from the field to make a determination. The model was also used to validate the final occupancy results for the Census.

3. How the results of the 2021 Census compare

An independent view of the quality of statistical outputs from the 2021 Census of Population and Housing

Released
28/06/2022

Overview

Decorative banner.

A key data quality focus for the Panel has been the comparison of 2021 Census data against data from the 2011 and 2016 Censuses. These comparisons represent an important data quality check. The data chosen by the Panel for assessment was either based on direct relevance to quality such as response rates or their importance to users of the Census, such as counts of persons.

In addition to this analysis, the Panel developed an accuracy framework to explore what is meant by a high-quality census, and examined the accuracy achieved by the 2021 Census and the 2021 Post Enumeration Survey against that framework. This analysis is presented in Appendix C.

3.1 Measures of quality

An independent view of the quality of statistical outputs from the 2021 Census of Population and Housing

Released
28/06/2022

Overview

Decorative banner

There are three key measures of statistical quality used internationally that the Panel employed to assess the quality of the 2021 Census data:

  • undercount and overcount (see Section 3.2 and 3.5);
  • response rates, including item non-response rates (see Section 3.3); and
  • consistency with other data sources (see Sections 3.4, 3.5, 3.6 and 3.7).

The undercount and overcount estimates produced by the Post Enumeration Survey were used to obtain information on the number of people missed, or counted more than once, by the Census.

Dwelling and person response rates and item non-response rates for the Census were reviewed to see if there were any unusual observations in response patterns.

The data from the 2021 Census was compared against the 2016 and 2011 Censuses to check for unexpected differences.

3.1.1 Undercount and overcount

Decorative banner

Using the Post Enumeration Survey results, it is possible to estimate:

  • the number of people who either were counted more than once or in error in the Census (gross overcount);
  • the number of people who should have been counted in the Census but were missed (gross undercount); and
  • the net error for Census imputation into dwellings determined incorrectly to be occupied or unoccupied on Census night (net overcount for persons imputed).

The net difference is called the net undercount (or overcount).

In 2021, the ABS has also produced a new coverage measure called gross coverage, which sums the coverage errors. Conceptually, gross coverage aims to identify the population that the Census counted (or received a form for) as a proportion of the population that the Census should have counted. It is the Census count, with the overcount and imputed persons removed as a proportion of the Post Enumeration Survey population estimate, expressed as a percentage.

3.1.2 Response rates

Decorative banner

Response rates are standard measures used internationally to assess data quality for population and housing censuses. The Panel considered three types of response rates: dwelling response, person response, and item non-response. These measures are defined below and are used in this report to assess overall data quality.

The dwelling response rate is used to measure how many occupied private dwellings in Australia completed the Census. Dwelling response occurs when a form is returned for a private dwelling identified as occupied on Census night. The dwelling response rate is calculated as a percentage by dividing the number of responding private dwellings by the number of private dwellings identified as occupied on Census night (including those where no form was returned). The dwelling response rate excludes non-private dwellings. Most people were counted in a private dwelling on Census night.

The person response rate is used to measure how many people in Australia completed the Census. Person response occurs when a person is included on a form returned from either a private dwelling identified as occupied on Census night, or from a non-private dwelling. The person response rate is also calculated as a percentage by dividing the number of responding people by the total number of people in the Census counts (including those imputed into dwellings where no form was returned).

Unlike the dwelling response rate, the person response rate includes people in non-private dwellings. This takes into consideration responses on Census night from people who were in dwellings such as hotels, hospitals, nursing homes, boarding houses, mining camps and other staff quarters, among other non-private dwelling types.

It is important to note that the quality of these response measures depends on how well the ABS has determined the occupancy of private dwellings on Census night. If unoccupied dwellings are incorrectly classified as non-responding occupied dwellings, this will make the response rates appear lower than they were. Conversely, if non-responding occupied dwellings were mistakenly categorised as unoccupied this will make the response rates appear higher.

Item non-response rates are important for understanding the quality of individual data items. Item non-response is calculated as a percentage by dividing the number of households or people who provided a response to a particular question (item) by the number of households or people (including imputed people) for whom the question (item) would have been applicable.

3.1.3 Consistency with other data sources

Decorative banner

To assess the quality of key indicators and particular data items, 2021 Census data was compared against their equivalents from the 2016 and 2011 Censuses. While differences were anticipated (and found) given 10 years of population growth and societal change, and particularly given the 2021 Census was conducted during the COVID-19 pandemic, analysis was focussed on identifying unexpected and inexplicable differences that might point to data quality issues.

Comparisons were also made against the Estimated Resident Population as at June 2021. The Estimated Resident Population used for comparison was based on the 2016 Census updated using birth, death and migration data for the intercensal period.

The Panel also used trends in other relatable data sources to identify any trends in the Census data that might require further investigation. For the two new Census variables (Long-term health conditions and Australian Defence Force service), external data was used to assess their validity.

3.2 Census Post Enumeration Survey estimates of net undercount

An independent view of the quality of statistical outputs from the 2021 Census of Population and Housing

Released
28/06/2022

Overview

Decorative banner

Net undercount for any category of person is the difference between the Post Enumeration Survey estimate of the number of people who should have been counted in that category and the actual Census count including persons imputed into non-responding dwellings during Census processing.

Net undercount is often presented as a rate. The rate is the net undercount (or overcount) as a percentage of the Post Enumeration Survey estimate for a given population (i.e. as a percentage of the number of people who should have been counted in the Census).[1] The disaggregations of net undercount (together with Census and other administrative data) are used in the compilation of the official population estimates for Australia, the Estimated Resident Population.

The total net undercount from the Post Enumeration Survey can be examined by the components of persons counted on Census forms, and persons imputed (see Section 3.2.2). This enables examination of the number of persons missed in the Census, the number of persons counted more than once or in error in the Census, and overcount due to over-imputation. Each of these components is important for understanding the quality of the 2021 Census data.

For 2021, the ABS produced a new coverage measure called gross coverage. Conceptually, gross coverage is a measure of the population that the Census counted (or received a form for) as a proportion of the population that the Census should have counted. It is the Census count, with the overcount and imputed persons removed as a proportion of the Post Enumeration Survey population estimate, expressed as a percentage. Gross coverage is useful for understanding how well the population was captured in the Census, and the proportion of the population for which the full suite of data was obtained. It is an important lens for understanding the quality of Census data.

For comparability with the Post Enumeration Survey, all Census counts in Section 3.2 are presented on a usual residence basis and exclude Other Territories.


[1] For more information on the Post Enumeration Survey or net undercount, see Australian Bureau of Statistics (2022). 2021 Census overcount and undercount. Available at  https://www.abs.gov.au/statistics/people/population/2021-census-overcount-and-undercount/2021.

3.2.1 Australia as a whole

Decorative banner

The 2021 Census counted 25,417,999 usual residents of Australia (excluding Other Territories), who were in the country on Census night (including 898,484 persons who were imputed into non-responding dwellings assumed to be occupied on Census night). This was 190,044 persons fewer than the Post Enumeration Survey estimate of the usual resident population who were present in Australia on Census night. This equates to a total net undercount rate of 0.7%, down from 1.0% in 2016.

The net undercount rate for persons on Census forms decreased from 3.7% to 2.8% between 2016 and 2021, and the net overcount rate for persons imputed also decreased from 2.7% in 2016 to 2.1% in 2021 (see Table 3.2.1). Both decreases are consistent with an improvement in data quality.

As these estimates are based on a sample, they are subject to sampling errors. The sampling errors are shown for the core estimates of the net undercount in Table 3.2.1. More detailed estimates are shown in Appendix C. The net undercount rates are also subject to other types of errors such as non-response bias, recall error, matching error, and invalidity of the assumptions in the model to adjust for non-response. These are also discussed in Appendix C.

Table 3.2.1 Net undercount rate
20012006201120162021
Net undercount rate (%) for persons on Census formsna (a)3.93.43.72.8
Net overcount rate (%) for persons imputedna (a)1.21.72.72.1
Total Net undercount rate (%)1.82.71.71.00.7
Standard error (SE)0.10.20.20.20.2

(a) Data not available for 2001.               

Notes: Percentages may not add exactly due to rounding in cells. Excludes Other Territories and overseas visitors.

3.2.2 Analysis of net undercount

Decorative banner

The overall net undercount can be disaggregated into a number of components of undercount and overcount, as shown in Table 3.2.2. These components are described as follows.

Gross undercount for persons on Census forms

This comprises persons missing from completed Census forms and persons in dwellings missed in the Census (i.e. dwellings not known to Census). Gross undercount in the 2021 Census was estimated to be 1,032,660 persons, or 4.0% of the population. In 2016, this component represented 4.9% of the population (1,150,588 persons).

Gross overcount for persons on Census forms

This comprises persons included on Census forms multiple times or included in error (e.g. they were not in Australia on Census night but were included on a Census form). Gross overcount in the 2021 Census was estimated to be 314,788 persons, or 1.2% of the population, the same proportion as in 2016 (274,673 persons). This indicates that the introduction of the No-Census Number option in 2021 which was used to encourage response (see Appendix E), and potentially may have also introduced a risk of greater duplication in responses from dwellings, but did not in the event result in increased overcoverage as most duplicate dwellings were removed in processing.

Net undercount for persons on Census forms

This measure is the difference between gross undercount and gross overcount, for persons on Census forms, reflecting the extent to which undercount has been offset by overcount. Net undercount for persons on Census forms was estimated to be 717,872 persons, or 2.8% of the population in 2021. The corresponding figure was 3.7% in 2016 (875,915 persons).

Net overcount for persons imputed

This component largely represents over-imputation of persons during Census processing. Over-imputation occurs when too many people are imputed into non-responding dwellings, either because the non-responding dwelling was incorrectly deemed to be occupied on Census night, or too many people were imputed into a dwelling that was correctly deemed to be occupied. The net contribution of the latter was relatively small. People were also incorrectly imputed into non-private dwellings on Census night, either due to an overestimate of the Census night occupancy of non-private dwellings, or because people were counted a second time on a form from their private dwelling residence. This process provides the balance of the over-imputation.

In the 2021 Census, net overcount for imputed persons was estimated to be 527,828, or 2.1% of the population. The corresponding figure for 2016 was 649,509 persons (2.7% of the population).

The ABS has reported that the process of determining whether a home is occupied on Census night has become more difficult with the increase in the number of people living in high-density, secure buildings and the decreasing likelihood of making doorstep contact. In 2021, COVID-19 lockdowns in some areas of Australia meant that doorstep contact was reduced, however, the introduction of self-service options on the Census website made it easier for people to report if they would not be at home on Census night. In addition, an occupancy determination model was developed for 2021 which helped to more accurately determine whether a dwelling was occupied or unoccupied on Census night in the absence of reliable field information. These two innovations have helped ameliorate the impact of restricted field activities due to the pandemic. More details of the impact of imputation are shown in Appendix C.

Total net undercount

This is the net result of the components of undercount and overcount. Total net undercount for 2021 was 190,044 persons, or 0.7% of the population. This was a decrease of 16.1% from the corresponding figure for 2016 (226,407 persons or 1.0% of the population).

This section refers to total net undercount when distinguishing from the components of overcount and undercount for persons on Census forms or persons imputed. For the remainder of this report, total net undercount is abbreviated to net undercount unless an explicit distinction is required.


Table 3.2.2 Components of undercount and overcount


Persons on Census forms (a)

Persons imputed (b)

Total


Gross undercount (c)

Gross overcount (d)

Net undercount

Net overcount (e)

Net undercount


no.

no.

no.

no.

no.

2021

1,032,660

314,788

717,872

527,828

190,044

2016

1,150,588

274,673

875,915

649,509

226,407

Change (%)

-10.2

14.6

-18.0

-18.7

-16.1


% (f)

% (f)

% (f)

% (f)

% (f)

2021

4.0

1.2

2.8

2.1

0.7

2016

4.9

1.2

3.7

2.7

1.0

Change (% points)

 -0.9

0.0

 -0.9

 -0.7

 -0.3

(a) Excludes Late Returns and Quality Flagged Census records.

(b) Persons are imputed into dwellings that were non-responding in the Census and deemed to be occupied on Census night.

(c) Persons missing from Census forms and persons in dwellings missed in the Census.

(d) Persons included in error, or multiple times.    

(e) Net overcount for Census imputed persons represents over-imputation. This column includes a small contribution from Late Returns and Quality Flagged Census records.

(f) Percentages are calculated using Post Enumeration Survey population estimate as the denominator.

Note: Excludes Other Territories and overseas visitors.

It is important to note that the Post Enumeration Survey is designed to provide the best measure of Census coverage at a single point in time, rather than as a time series across Censuses. Therefore, the Post Enumeration Survey estimates of undercount and overcount are not strictly comparable over time due to changes in both Census and Post Enumeration Survey methodologies. For example:

  • a new estimation process was introduced in the 2006 Post Enumeration Survey, along with the inclusion of remote areas and discrete communities[1] in the Post Enumeration Survey sample;
  • Automated Data Linking between Post Enumeration Survey and Census person records was introduced in 2011;
  • the 2016 Census underwent a number of changes to its collection methodology, with some changes to Post Enumeration Survey enumeration procedures as a result; and
  • the 2021 Post Enumeration Survey introduced further changes to the collection methodology, namely the use of the Address Register (rather than an area-based frame) as the survey frame and the widespread use of telephone interviewing (using an approach letter to elicit response). There were also improvements made to enumeration procedures as well as changes made due to COVID-19 lockdowns.


[1] See Glossary

3.2.3 Analysis of gross coverage

Decorative banner

While net undercount provides a picture of the net coverage error in the Census, as a single measure it can conceal the elements that help us understand the quality of Census coverage; for example, where high gross measures of overcount and undercount net out to a small net undercount. Gross coverage enables us to look at how well the population was captured without the added layers of people counted more than once or in error (overcount), and imputed people (where no Census form was received for a dwelling deemed occupied on Census night).

Figure 3.2.1 shows net undercount and gross coverage error. Gross coverage error is 100 minus gross coverage; for example, if gross coverage is 90%, the gross coverage error is 10%.

In 2016, the net undercount rate was 1.0% and the gross coverage error rate was 7.1%. In 2021, the net undercount rate dropped to 0.7% and the gross coverage error rate dropped to 6.1%, similar to 2011, indicating that better coverage was achieved compared to 2016.

Note: Excludes Other Territories and overseas visitors.

3.2.4 State and/or territory of usual residence

Decorative banner

Figure 3.2.2 shows the total net undercount rate for all states and territories for the past three censuses.

In 2021, as in previous censuses, the Northern Territory recorded the highest total net undercount rate of all states and territories (6.0%) up from 5.0% in 2016 but lower than 6.9% in 2011. The Australian Capital Territory recorded the lowest total net undercount rate (-0.6%, i.e. a net overcount). This is consistent with previous Post Enumeration Surveys, although this is the second Census in a row when the Australian Capital Territory has recorded a net overcount.

While the two territories continue to reflect the minimum and maximum total net undercount rates, trends across the states have shifted, with New South Wales, Victoria and Queensland experiencing decreases in net undercount in 2021 compared to 2016 and 2011. In contrast, South Australia, Western Australia and Tasmania reversed the trend experiencing increases in net undercount in 2021 compared to 2016. Western Australia’s net undercount in 2021 was higher than the previous two Censuses.

Note: Excludes overseas visitors. Australia excludes Other Territories.

The components of overcount and undercount for the states and territories are shown separately in Table 3.2.3. The net undercount rates for persons on Census forms are similar for the six states but differ markedly for the Northern Territory (10.4%) and the Australian Capital Territory (1.6%). The largest improvements between 2016 and 2021 have been in New South Wales and Victoria, with net undercount rates (for persons on Census forms) both decreasing by 1.5 percentage points. The largest decline has been in the Northern Territory and Western Australia, with net undercount increasing by 1 percentage point and 0.8 percentage points respectively. In contrast, the net overcount for persons imputed is lower in all states and territories in 2021 when compared with 2016, except for the Northern Territory, which has remained stable. The Northern Territory has the highest net overcount rate for persons imputed, which is not surprising given the Census non-response rate was also the highest in the Northern Territory.

Table 3.2.3 Components of overcount and undercount rates, state/territory of usual residence
 

NSW

Vic.

Qld

SA

WA

Tas.

NT

ACT


%

%

%

%

%

%

%

%

2021

Net undercount rate for persons on forms

2.1

2.2

3.4

2.6

4.6

3.5

10.4

1.6

Net overcount rate for persons imputed

2.2

1.9

2.4

1.7

1.6

1.9

4.4

2.2

Total Net undercount rate

0.0

0.3

1.0

1.0

3.0

1.6

6.0

-0.6

2016

Net undercount rate for persons on forms

3.6

3.7

4.1

3.0

3.8

3.0

9.4

1.4

Net overcount rate for persons imputed

2.8

2.3

2.8

2.8

3.4

2.9

4.4

2.5

Total Net undercount rate

0.8

1.4

1.3

0.2

0.4

0.1

5.0

-1.1

2011

Net undercount rate for persons on forms

3.7

2.6

3.4

2.3

4.5

3.2

8.9

2.0

Net overcount rate for persons imputed

1.8

1.6

1.7

1.2

1.9

1.2

2.0

1.3

Total Net undercount rate

1.9

1.1

1.8

1.1

2.5

2.0

6.9

0.7

Notes: Excludes Other Territories and overseas visitors.

Percentages may not add exactly due to rounding in cells.

Comparing net undercount rates with gross coverage error for states and territories (Figure 3.2.3) shows that both net undercount and gross coverage error have decreased in New South Wales, Victoria, Queensland, and the Australian Capital Territory. While net undercount has increased in South Australia, the gross coverage error has remained stable, indicating good Census coverage with less over-imputation. In Western Australia and Tasmania both net undercount and gross coverage error have increased, while in Northern Territory the net undercount has increased but the gross coverage error has decreased indicating better coverage by the Census despite an increase in the net undercount.

Note: Excludes Other Territories and overseas visitors.

3.2.5 Age and sex

Decorative banner

Previous censuses (both in Australia and overseas) have observed that young adults are more likely to be missed, whereas older adults are more likely to be counted or overcounted in a census. Newborn children are often mistakenly omitted from census forms, and younger males are also traditionally more likely to be missed than females as they tend to be more mobile and more likely to be working away from home. As can be seen from Figure 3.2.4, these trends hold true for the 2021 Census. Relatively high total net undercount rates were observed for the 20-24, 25-29 and 30-34 year age groups (2.1%, 1.7% and 1.7%, respectively) and the highest total net undercount rate was observed for 10-14 year olds (2.3%). In contrast, older age groups had lower total net undercounts (usually overcounts), with the largest net overcount of 2.0% observed for people aged 85 and over, and 1.5% observed for people aged 75-79 years.

Males are more likely to be missed in the census compared to females. In 2021, the total net undercount rate for males was 1.3% while for females it was 0.2% and this is consistent with previous censuses. The total net undercount rates for males and females were 1.5% and 0.4% for 2016, respectively, and 2.2% and 1.2% for 2011, respectively. For males, those aged 30-34 years had the highest total net undercount rate of all age groups (3.6%) followed by 20-24 year olds (3.0%). For females, those aged between 10-14 years had the highest total net undercount at 2.2%. This was a similar pattern to the 2011 Census. Total net undercount for children aged 0-4 years more than halved in 2021 compared to 2016 (1.7% compared to 5.1%, respectively).

Note: Excludes Other Territories and overseas visitors.

Figure 3.2.5 shows that net overcount for imputed persons is more evenly spread across nearly all age groups in 2021 compared with 2016, and this appears to be driven by changes in Census imputation methodology with younger adults more likely to be imputed in 2021 than in previous censuses. As in previous censuses, people aged 0-19 years have much lower rates of over-imputation, while in 2021 people aged 85 years and over had the highest. In 2016, there were consistently higher rates of over-imputation for people aged 55 years and over and this has reduced in 2021.

Note: Excludes Other Territories and overseas visitors.

Figure 3.2.6 shows the net undercount for persons on Census forms by age. While total net undercount remains highest in the young adult age groups, particularly for 20-24 and 25-29 year olds, overall it is generally lower and more evenly spread across all age groups in 2021 than was the case in 2016.

Note: Excludes Other Territories and overseas visitors.

Figure 3.2.7 illustrates the overall outcome: the total Census count (responses plus imputation) is lower than the Post Enumeration Survey population estimate for younger age groups and very close to the estimates for people aged 40 to 64 years. For people aged 65 years and over, the Census counts (including imputation) are slightly larger than the Post Enumeration Survey population estimates. There has been an improvement in the imputation approach used in 2021 with the counts including imputed persons being closer to the Post Enumeration Survey estimates than was the case in 2016, especially for people under the age of 40 years.


Figure 3.2.7 Census night population of usual residents: 2021 Census versus Post Enumeration Survey estimates by age group

Line graph as described in the paragraph above and the description for this image.
The graph shows the number of people for the Census count (responses plus imputation) and Post Enumeration Survey estimates, by five year age groups from 0-4 years up to 85 plus years. The Census count for responding persons is shown as a pale blue band and the additional Census count for imputed persons is shown as a dark blue band. The Post Enumeration Survey estimate is shown as an orange line. The paragraph above describes the key results for this graph.

Note: Excludes Other Territories and overseas visitors.

3.2.6 Country of birth

Decorative banner

The net undercount rates for country of birth in Figure 3.2.8 are displayed for the 10 highest ranked countries (in terms of population residing in Australia), according to the 2021 Census.

While there has always been some non-response to the Country of birth question, with increasing uptake of the online Census, non-response has decreased. For those who do not respond to the question, since Census does not impute a country of birth for these people, they are not included in Census counts for these categories. However, they contribute to net undercount estimates based on the category in which they should have been counted, as reported in the Post Enumeration Survey. There were 1,372,273 people (5.4%) whose country of birth was not stated in the 2021 Census or for whom the response was unable to be coded to a country, a decrease from 1,622,118 people (6.9%) in 2016.

Reflecting the overall decrease in net undercount seen across the population, there has been a decrease in net undercount compared to 2016 across nearly all of the top 10 countries of birth listed. The exception is New Zealand, with a net undercount rate of 8.5% in 2021, up from 5.5% in 2016. Persons born in South Africa have the second highest rate in 2021 (6.3%), followed by Australia (6.2%). Persons born in Italy had the lowest net undercount of the top 10 countries in 2021 at 1.8% and this was a significant decrease from 5.5% in 2016.

Note: Excludes Other Territories and overseas visitors.

People who have come to Australia from other countries and whose first language is not English may find completing a Census form more difficult than other Australians. For several censuses, special strategies have been employed to promote an understanding of the Census among migrants and to provide assistance in a range of languages.

3.2.7 Implications for Census quality

Decorative banner

The Post Enumeration Survey shows that the Census population data, adjusted by the Post Enumeration Survey, is fit-for-purpose for its important use in rebasing the Estimated Resident Population at the national and state and/or territory level.

The total net undercount is small at the national level (0.7%) and for the states and territories with the exception of the Northern Territory and Western Australia. The Northern Territory continues to have the highest total net undercount.

Aboriginal and Torres Strait Islander peoples continue to be under-represented in the Census. The Post Enumeration Survey estimates the net undercount rate to be about 17% for each of the last three Censuses (for more see Section 3.5 Aboriginal and Torres Strait Islander peoples) despite increased investment in the enumeration of this population. COVID-19 lockdowns and border closures had an impact on the availability of field staff within states and interstate, and it is likely that these factors had an impact on the enumeration of Aboriginal and Torres Strait Islander peoples in some areas. The enumeration of Aboriginal and Torres Strait Islander peoples continues to be a priority area for attention by ABS. Despite this high net undercount, the Post Enumeration Survey enables the Estimated Resident Population estimates for this population to be rebased.

The net undercount rate for persons on Census forms (2.8%) has decreased compared with 2016 (3.7%), reflecting in particular a decrease in persons missing from Census forms (4% in 2021 compared to 4.9% in 2016), while persons counted more than once or in error has remained stable at 1.2%. The net overcount rate for persons imputed has decreased from 2.7% to 2.1%. This reduction in over-imputation is the result of improvements in the correct identification of occupancy in the Census, even though this was more difficult because of pandemic-based contact restrictions at the time of the Census. The Post Enumeration Survey also shows that while age skewing in the Census data has improved in 2021 compared to 2016, there are not enough persons aged 39 years and under in the Census counts.

3.3 Response rates

An independent view of the quality of statistical outputs from the 2021 Census of Population and Housing

Released
28/06/2022

Overview

Decorative banner

The overall response rates for the 2021 Census are higher than for the 2016 Census, but lower than those of the 2011 Census. They are similar to response rates achieved in other censuses in Canada and the United Kingdom (both conducted during the pandemic in 2021), and higher than the response rate in New Zealand, when their Census was conducted in 2018 (pre-pandemic). This was an excellent outcome for Australia given the challenges of conducting a Census during a pandemic.

In the 2016 Census, too many non-responding dwellings were deemed as occupied on the Census night that were unoccupied. This was due to dwellings being deemed occupied where there wasn’t sufficient information in the field to determine occupancy. This resulted in some dampening of estimated response rates. Improvements in response rates in 2021 are largely due to an increase in the number of responding dwellings as a proportion of all dwellings which may in part be due to the pandemic causing more people to be counted at home. Improvements are also related to improved occupancy determination. Irrespective, it is an important quality improvement in the 2021 Census.

3.3.1 Person response

Decorative banner

Person response rates can be viewed in two ways:

  • where people were on Census night (their state of enumeration); and
  • where people usually live (their state of usual residence).

In reviewing both indicators across each state and territory, the response rates achieved in 2021 were higher than those of 2016. They were also generally lower than those of 2011 with the exception of the Australian Capital Territory and Western Australia for place of enumeration, but they are comparable.

The person response rate (state of enumeration) for the 2021 Census was 95.8%, up from 94.8% in 2016 but lower than the rate in 2011 of 96.3% (see Figure 3.3.1). The highest person response rates were observed in the Australian Capital Territory (97%) and in South Australia (96.9%), while the lowest was for the Northern Territory (91.3%).

Notes: Includes overseas visitors. Includes Other Territories in the total for Australia.

Notes: Excludes overseas visitors. Includes Other Territories in the total for Australia.

3.3.2 Private dwelling response

Decorative banner

Across most of the states and territories, the response rates for occupied private dwellings reflected the pattern for Australia, namely higher in 2021 than in 2016 and lower than in 2011 (see Figure 3.3.3). Some of this is due to a higher level of response in 2021 and some may be due to the occupancy determination issue that was more prominent in 2016. However, Western Australia, the Northern Territory and the Australian Capital Territory are exceptions to this finding, with the rate achieved in 2021 higher than those achieved in both 2011 and 2016. Nevertheless, the rate for the Northern Territory continues to be lower than the other states and territories at 92.8% in 2021 and this reflects the difficulty in enumerating this part of Australia due to its remote nature, diversity of language groups, more transient population and a tighter labour market.

Note: Includes Other Territories in the total for Australia.

3.3.3 Non-private dwellings

Decorative banner

Approximately three per cent (2.9%) of the persons in the 2021 Census population counts were counted in non-private dwellings, down from about four per cent in 2016. The reduction reflects the impact of COVID-19 restrictions on movement in certain jurisdictions. Overall response rates were similar to 2016 (see Table 3.3.1). However, response rates in staff and nurses’ quarters show a marked decline, pointing to difficulty in enumerating settings including staff quarters in remote mining camps. The response rate for people in hospitals was also lower. This result is likely due to the difficulties in enumeration of hospitals during COVID-19 lockdowns.

Table 3.3.1 Response rate in non-private dwellings by type
Non-private dwelling type2011 (%)2016 (%)2021 (%)% point change 2011-2016% point change 2016-2021
Hotel, motel, bed and breakfast77.562.567.1-15.04.6
Staff and nurses' quarters75.468.157.4-7.3-10.7
Boarding school, residential college, hall of residence93.293.090.0-0.2-3.0
Hospital94.078.666.7-15.4-11.9
Accommodation for the aged, nursing home98.293.592.5-4.7-1.0
Other91.384.785.2-6.60.5
All non-private dwellings86.877.077.5-9.80.5

Note: Includes Other Territories and overseas visitors.

3.3.4 Mode of response

Decorative banner

As is the case in other countries, the 2021 Census relied on and strongly encouraged a digital first approach, while at the same time providing the option of a paper form for those unable or unwilling to complete online. Uptake of the online option by respondents has increased significantly over the past three censuses and has resulted in an associated increase in data quality, as online response is aided by: better sequencing through the form (skipping over questions that are irrelevant based on prior responses); the use of error messages to better guide respondents; and targeted supplementary questions to obtain more detailed responses from respondents.

Table 3.3.2 Dwelling online form uptake

Year

Australia (a)

New Zealand

Canada

UK - England & Wales


%

%

%

%

2011

34.3

34.0 (b)

53.9 

16.4  

2016

58.8

87.9 (c)

68.3  


2021

78.9


84.1 (d)

88.9 (e)

(a) Only includes occupied private dwellings that responded by paper or online form. This comparison excludes special form types used during enumeration. Includes Other Territories.

(b) The New Zealand Census was rescheduled due to the Christchurch earthquake in early 2011, and was held in 2013.

(c) The New Zealand Census was held in 2018 and was administered through the delivery of both dwelling and individual forms, and the measurement of online uptake completed reflects this. The online percentage is inflated because of the effect of the high non-response rate on the denominator. 

(d) The Canadian Census online response rate is the "Collection Internet Response Rate" rather than the final, sourced from https://www12.statcan.gc.ca/census-recensement/2021/ref/response-rates-eng.cfm

(e)  The UK Online Response Rate sourced from https://www.ons.gov.uk/peoplepopulationandcommunity/householdcharacteristics/homeinternetandsocialmediausage/articles/deliveringthecensus2021digitalservice/2021-10-               04#:~:text=With%2088.9%25%20of%20household%20responses,February%20to%2025%20June%202021).

The Australian Capital Territory had the highest online response of all the states and territories (93.2%), followed by Western Australia (82.4%) (see Table 3.3.3). Tasmania and South Australia had the lowest online response (61.3% and 71% respectively). The Northern Territory had the largest increase in the rate of online take up from 49.4% in 2016 to 74.9% in 2021. It should be noted that online uptake across areas is impacted by the mode of delivery and those states in which more paper forms were delivered had a lower online uptake.

Table 3.3.3 Mode of response for occupied private dwellings


2011 (%)

2016 (%)

2021 (%)

% point change 2011-2016

% point change 2016-2021

New South Wales

Online

35.5

60.0

80.0

24.5

19.9

Paper

64.5

40.0

20.0

-24.5

-19.9

Victoria

Online

32.7

58.9

79.8

26.2

20.9

Paper

67.3

41.1

20.2

-26.2

-20.9

Queensland

Online

34.0

58.3

78.3

24.4

20.0

Paper

66.0

41.7

21.7

-24.4

-20.0

South Australia

Online

30.7

52.0

71.0

21.3

19.0

Paper

69.3

48.0

29.0

-21.3

-19.0

Western Australia

Online

37.1

61.5

82.4

24.4

20.9

Paper

62.9

38.5

17.6

-24.3

-20.9

Tasmania

Online

31.1

45.0

61.3

14.0

16.3

Paper

68.9

55.0

38.7

-14.0

-16.3

Northern Territory

Online

33.8

49.4

74.9

15.6

25.6

Paper

66.2

50.6

25.1

-15.6

-25.6

Australian Capital Territory

Online

46.3

78.9

93.2

32.7

14.3

Paper

53.7

21.1

6.8

-32.7

-14.3

Australia (a)

Online

34.3

58.8

78.9

24.5

20.1

Paper

65.7

41.2

21.1

-24.5

-20.1

(a) Includes Other Territories.

Note: Only includes occupied private dwellings that responded by paper or online. This comparison excludes the special form types used during enumeration.

3.3.5 Item non-response

Decorative banner

As with overall non-response, total item non-response rates have declined since 2016 and are similar to 2011.

The main contributor to total item non-response is people who do not respond to the Census at all. While key variables (Age, Sex, Marital status and Usual residence) for a non-responding person are imputed (a process that attempts to fill in basic information for the people who didn’t respond to the Census), the remainder of the questions (data items) are set to either ‘not stated’ (and treated as ‘item non-response’) or not applicable, dependent on the imputed age of the person.

Figures 3.3.4 and 3.3.5 show item non-response rates for 2011-2021. The larger blue and orange bars represent the non-response rates which include imputed people (that is people who are not on a Census form). The shorter bars in the same graph show non-response rates for people who responded to the Census but did not answer a particular question. For those people who responded to the Census in 2021, item non-response is lower than in previous censuses for almost all items. Overall, the 2021 Census was more successful than previous censuses in getting people to complete more items as shown in Figure 3.3.4 and 3.3.5. Figure 3.3.6 shows item non-response for a range of dwelling variables.

Notes: Includes Other Territories. Includes overseas visitors for Age, Sex and Marital status.

na  not available

Notes: Includes Other Territories. Excludes overseas visitors.

(a) Non-response for these items is not impacted by dwelling non-response, as they are sequenced only to applicable householders dependent on responses to the Tenure type question (i.e. renters are sequenced to answer Landlord type/ rent questions, homeowners are sequenced to answer the Mortgage question).

(b) Occupied private dwellings being purchased, includes dwellings being purchased under a shared equity scheme.

(c) Occupied private dwellings being rented, includes dwellings being occupied rent free.

Note: Includes Other Territories. na not available.

3.3.6 Geographic distribution of response rates

Decorative banner

Analysis of changes in person response rates at the Statistical Area Level 4 (SA4) level between 2016 and 2021 in Table 3.3.4 show that, in 39.8% of the SA4s, the improvement has been more than one percentage point (SA4s are the largest sub-state regions in the Australian Statistical Geography Standard). Most of the inner-city areas across the nation fall into this category. For a further 46.6% of SA4s, there has been an improvement of less than one percentage point. In 13.6% of cases, there was a decline in response. This group is dominated by the more remote areas. This is where field staff recruitment difficulties were most prevalent.

Table 3.3.4 Change in dwelling response rates for SA4s (a), by state and territory


NSW

Vic.

Qld

SA

WA

Tas.

NT

ACT

Australia (b)

Number of SA4s

Increase of 1pp or greater

9

4

8

2

7

2

2

1

35

Increase less than 1pp

13

13

8

4

1

2

0

0

41

Decrease

6

0

3

1

2

0

0

0

12

Total

28

17

19

7

10

4

2

1

88

Proportion of SA4s

Increase of 1 pp or greater

32.1

23.5

42.1

28.6

70.0

50.0

100.0

100.0

39.8

Increase less than 1pp

46.4

76.5

42.1

57.1

10.0

50.0

0.0

0.0

46.6

Decrease

21.4

0.0

15.8

14.3

20.0

0.0

0.0

0.0

13.6

Total

100.0

100.0

100.0

100.0

100.0

100.0

100.0

100.0

100.0

(a) SA4s are the largest sub-state regions in the Australian Statistical Geography Standard.

(b) Excludes Other Territories and Migratory, Offshore and Shipping categories.

pp  percentage point

3.3.7 Implications for Census quality

Decorative banner

There have been increases in the person and dwelling response rates since 2016, nationally and for all states and territories. This is due to an increase in responding dwellings as a proportion of all dwellings and may also in part be due to improved occupancy determination. However, it should be noted that in some areas (mostly in remote areas), response rates have declined, and quality may be affected in these areas. Households completed the 2021 Census online at a much higher rate than previously, with about 79% of responding dwellings doing so and this will have had a positive impact on data quality. Item non-response rates were generally lower than in 2016, partly due to the lower number of imputed persons in 2021, and partly due to the high online form uptake. These will also lead to an improvement in data quality.

3.4 Population counts and age - sex distributions

An independent view of the quality of statistical outputs from the 2021 Census of Population and Housing

Released
28/06/2022

Overview

Decorative banner

This section provides comparisons of the age distributions of the population recorded in the 2021 Census for Australia and for states and territories with the corresponding age distributions estimated in the unrebased Estimated Resident Population at 30 June 2021.[1] It should be noted that the reference periods for the Census and the Estimated Resident Population differ, with the Census reference period some six weeks after that of the population estimates. Census counts are not backdated in this analysis.

Comparing the age distributions from the two sources provides information about the quality of both sources. The more alignment there is between the two and an understanding of the differences between them provide an indication of coherence and quality.

Both the Census and the Estimated Resident Population are potential sources of any difference observed between the two measures. The ABS investigates these differences and using data from the Census and from the Post Enumeration Survey, adds in numbers of Australian usual residents who were overseas on Census night, then re-estimates the Estimated Resident Population. This is referred to as rebased Estimated Resident Population. This rebased 2021 Estimated Resident Population will be released on 28 June 2022 and will form the basis of all population estimates from 2021 until the next Census in 2026.

Error in the Estimated Resident Population can arise from quality and coherence issues associated with the administrative data sources used for quarterly estimates. These can include delays in the reporting and registering of births and deaths, the use of preliminary estimates of net overseas migration and the quality of information collected on Incoming Passenger cards, and lags, quality and undercoverage of people reporting changes to their usual residence within Australia.

While some delay in registrations is observed each year across all jurisdictions, the pandemic has had a noticeable effect in increasing the delay of birth registrations, most particularly in Victoria where, for the June 2021 quarter, more than half of the records were received after the reference quarter. These delayed registrations are not included in the published Estimated Resident Population for 30 June 2021.

The Census is particularly useful in recalibrating or rebasing the Estimated Resident Population for geographic areas within Australia every five years, as the Estimated Resident Population is affected by the accuracy of measurement of people changing their place of usual residence in Australia which is based largely on Medicare data. Evidence shows that the pandemic and subsequent lockdowns have significantly affected intra and interstate movements over the last two years. The success of the national COVID-19 vaccination program has had a positive impact on the quality of administrative data used to estimate Australia’s state and territory population as the rollout of the vaccination program has seen large numbers of Australians updating their address information. However, this happened towards the end of the inter-censal period so would have been of limited benefit to the Estimated Resident Population estimates for 30 June 2021.

The Census counts used in this section eliminate overseas visitors before the comparison with Estimated Resident Population is made. A challenge in this regard is that the Census definition of a usual resident is not precisely the same as the definition of a usual resident in the Estimated Resident Population calculation. In the Census, a person is counted as a usual resident if they usually live in Australia or if they usually live in another country but are resident in Australia for one year or more. A usual resident for the Estimated Resident Population is a person who is in Australia for 12 months over a 16-month period around the reference date. However, significantly reduced levels of overseas migration in the 18-month lead-up to the Census will have reduced the impact of this difference between the two datasets.

The comparisons shown below are based on the 2021 Census before any adjustment is made for the 2021 Post Enumeration Survey. This means, for example, that the people that the Post Enumeration Survey showed to have been incorrectly added (imputed) to non-responding dwellings (see Section 3.2, Table 3.2.2) are not removed from the Census counts before the comparisons with Estimated Resident Population are made. This approach is taken because the published Census data also include these incorrectly attributed people, although in 2021 it is known that there were fewer imputed people, and occupancy determination was more accurate.

Taking account of the difference outlined above, there is generally a good match between the 2021 Census and the 2016-based Estimated Resident Population for 30 June 2021 but the Census results for some of the smaller states and territories indicate there is room to improve the way administrative data is used between censuses to estimate the state or territory of residence and interstate movement for some recently arrived migrants.


[1] The unrebased Estimated Resident Population for 2021 is obtained by updating the 2016 rebased Estimated Resident Population using births, deaths, internal migration and international migration between 2016 and 2021. Unless otherwise specified, all references to Estimated Resident Population in this section refer to first released unrebased Estimated Resident Population.

3.4.1 Comparisons of the Census and the unrebased Estimated Resident Population by age, 2021 and 2016

Decorative banner

Australia

For Australia (Figure 3.4.1), the peaks and troughs of the unrebased Estimated Resident Population age distribution are mirrored by the 2021 Census data. Note that the comparison of the two sources for Australia is up to 100 years of age, while for the states and territories it is truncated at 85 years because the numbers get much smaller after this age. ABS will make corrections at older ages as part of the recalculation of the Estimated Resident Population.

Numerically, the 2021 Census and the Estimated Resident Population are very close from age 40 onwards. Furthermore, for the under 40 years population, the 2021 Census counts are a closer fit to the Estimated Resident Population than was the case in 2016.

The largest differences between the two measures are in the childhood years (0-13 years of age) and the young adult years (20-35 years). At these ages, the Census results are lower than the Estimated Resident Population. This means that fewer people were counted in the 2021 Census in these age groups than would have been expected using the Estimated Resident Population. In the first age group, the largest differences were observed for children aged five years (4.7% lower in the Census) followed by babies (0 year olds), at 4.5% lower.

Notes: Unrebased Estimated Resident Population based on the 2016 Census as published on 16 December 2021.

Census count excludes overseas visitors. Includes Other Territories.

Notes: Unrebased Estimated Resident Population based on the 2011 Census.

Census count excludes overseas visitors. Includes Other Territories.

The Estimated Resident Population in the early childhood years is likely to be quite accurate because it is based on the number of births that occurred in the few years prior to the Census although, as noted earlier, an increased delay in birth registrations due to the pandemic is likely to have had an effect in Victoria. The omission of children at very young ages is a common feature of censuses not only in Australia, but also in other countries. However, in Australia there appears to be an undercount of children up to the age of 13 and this is more difficult to explain. Part of the explanation may lie in the different reference periods of the Census compared to the Estimated Resident Population, when some children would have had a birthday between the end of June and 10 August, causing an ‘age mismatch’ between the two data sources. An additional reason might be the movement of children between households as part of custodial arrangements where the children may not have been reported in the Census by either parent. The undercount of young adults (especially males) is also commonly observed in censuses because people of these ages are generally harder for censuses and surveys to contact. The Post Enumeration Survey confirms that the net undercount rate is relatively high for children aged 10-14 years, with the highest net undercount observed particularly for young men in their early 20s and early 30s.

States and territories

The pattern of differences observed for Australia between the Census and the unrebased Estimated Resident Population is similar across the states and territories, as is the closer alignment of the 2021 Census counts to the Estimated Resident Population compared with 2016. There are generally lower counts of babies, young children, and young adults in the Census and a much closer fit for ages 40 and over between the Census and the Estimated Resident Population. However, there are noticeable differences across the states and territories in proportional terms (see Figures 3.4.3 to 3.4.18).

In New South Wales, there were 6.1% fewer babies in the Census count than in the Estimated Resident Population, while for 26-29 year olds the Census counts were between 5% and 6% lower. Conversely, in Victoria, there were 4.2% more babies in the Census count than in the Estimated Resident Population, and this reflects the delayed registration of births in Victoria due to COVID-19, which in turn has had an impact on the Estimated Resident Population for that age. The largest difference for Victoria was for young adults, with the Census counts for 25-27 year olds more than 8% lower.

South Australia’s Census counts were closely aligned with the population estimates, with 4.3% fewer babies. In South Australia, the count of people aged 19 and 20 years also showed differences with the estimates (3% lower than the population estimates). Census counts in the older ages (65-77 years) were somewhat higher than for the Estimated Resident Population.

In Queensland and Western Australia, there were larger difference in the count of babies, which were 8.9% and 8.7% lower than the Estimated Resident Population respectively, but there were relatively small differences in the counts of young adults compared with the estimates. For young adults in Queensland, the largest proportional difference between Census counts and the population estimates were for those aged 26-28 years where the counts were between 4% and 4.5% lower. In Western Australia, as in South Australia, the Census counts of people aged 19 and 20 years showed the largest difference in the young adult cohort with the counts about 3.5% lower.

In Tasmania and the Australian Capital Territory, there was an unusual pattern in that the Census counts for young adults were much higher than that of the Estimated Resident Population. In Tasmania, the Census counts for the 27 to 32 age group were at least 15% higher than that of the Estimated Resident Population, while in the Australian Capital Territory, the difference was even more pronounced with the Census counts for those aged 18, 19, 26, 27 and 28 years, in particular, more than 20% higher than the population estimates.

This unusual pattern could be due to a number of factors such as the potential movement of students back to their parent’s homes during COVID-19 lockdowns, but early analysis suggests it also reflects inaccuracies in capturing state or territory of residence and/or interstate migration of new migrants to these two jurisdictions. This unusual pattern will be investigated during the construction of the rebased Estimated Resident Population to be published on 28 June 2022. At this stage, it seems highly likely that the unrebased Estimated Resident Population has heavily underestimated the young adult population in Tasmania and the Australian Capital Territory. This provides an example of the value of a five-yearly Census in improving population estimates, especially at the sub-national level.

For the Northern Territory, the most striking variations are the relatively large differences for babies (where the Census count was 18% lower than the population estimate), and for children and young people up to the age of 21 years. As indicated by the Post Enumeration Survey, this is likely to be due to Census undercount, especially of Aboriginal and Torres Strait Islander peoples. The Estimated Resident Population for the Northern Territory is also noticeably higher than the Census count for those in their thirties.

Notes: Unrebased Estimated Resident Population based on the 2016 Census as published on 16 December 2021.

Census count of usual residents of New South Wales, which excludes overseas visitors.

Notes: Unrebased Estimated Resident Population based on the 2011 Census.

Census count of usual residents of New South Wales, which excludes overseas visitors.

Notes: Unrebased Estimated Resident Population based on the 2016 Census as published on 16 December 2021.

Census count of usual residents of Victoria, which excludes overseas visitors.

Notes: Unrebased Estimated Resident Population based on the 2011 Census.

Census count of usual residents of Victoria, which excludes overseas visitors.

Notes: Unrebased Estimated Resident Population based on the 2016 Census as published on 16 December 2021.

Census count of usual residents of Queensland, which excludes overseas visitors.

Notes: Unrebased Estimated Resident Population based on the 2011 Census.

Census count of usual residents of Queensland, which excludes overseas visitors.

Notes: Unrebased Estimated Resident Population based on the 2016 Census as published on 16 December 2021.

Census count of usual residents of South Australia, which excludes overseas visitors.

Notes: Unrebased Estimated Resident Population based on the 2011 Census.

Census count of usual residents of South Australia, which excludes overseas visitors.

Notes: Unrebased Estimated Resident Population based on the 2016 Census as published on 16 December 2021.

Census count of usual residents of Western Australia, which excludes overseas visitors.

Notes: Unrebased Estimated Resident Population based on the 2011 Census.

Census count of usual residents of Western Australia, which excludes overseas visitors.

Notes: Unrebased Estimated Resident Population based on the 2016 Census as published on 16 December 2021.

Census count of usual residents of Tasmania, which excludes overseas visitors.

Notes: Unrebased Estimated Resident Population based on the 2011 Census.

Census count of usual residents of Tasmania, which excludes overseas visitors.

Notes: Unrebased Estimated Resident Population based on the 2016 Census as published on 16 December 2021.

Census count of usual residents of the Northern Territory, which excludes overseas visitors.

Notes: Unrebased Estimated Resident Population based on the 2011 Census.

Census count of usual residents of Northern Territory, which excludes overseas visitors.

Notes: Unrebased Estimated Resident Population based on the 2016 Census as published on 16 December 2021.

Census count of usual residents of the Australian Capital Territory, which excludes overseas visitors.

Notes: Unrebased Estimated Resident Population based on the 2011 Census.

Census count of usual residents of Australian Capital Territory, which excludes overseas visitors.

People aged 85 years and over

Table 3.4.1 indicates the difference in the 2021 Census counts of people aged 85 years and over when compared with the unrebased Estimated Resident Population for Australia and the states and territories. In 2016, there were 2,251 more people aged 85 and over in the Census counts than in the Estimated Resident Population, while in 2021 there were 6,375 fewer in the Census. This may reflect the difficulties encountered in 2021 in enumerating people living in aged care and in nursing homes in those areas experiencing lockdown. Nevertheless, the numbers in the Census and the Estimated Resident Population are close.

Table 3.4.1 Unrebased Estimated Resident Population versus Census, persons 85 years and over, 2021 and 2016


Unrebased ERP

Census

Difference

% difference

2021    

New South Wales

   185,954

183,895

-2,059

-1.1

Victoria

   144,764

142,475

-2,289

-1.6

Queensland

     98,976

97,140

-1,836

-1.9

South Australia

     47,085

47,325

240

0.5

Western Australia

     50,563

50,106

-457

-0.9

Tasmania

     13,053

12,995

-58

-0.4

Northern Territory

        1,268

1,157

-111

-8.8

Australian Capital Territory

        6,928

7,181

253

3.7

Australia (a)

   548,717

542,342

-6,375

-1.2

2016

New South Wales

   168,420

167,506

-914

-0.5

Victoria

   124,825

127,993

3,168

2.5

Queensland

     84,923

85,528

605

0.7

South Australia

     44,122

44,479

357

0.8

Western Australia

     43,608

42,420

-1,188

-2.7

Tasmania

     11,595

11,767

172

1.5

Northern Territory

        1,029

938

-91

-8.8

Australian Capital Territory

        6,057

6,158

101

1.7

Australia (a)

   484,591

486,842

2,251

0.5

(a) Australia includes Other Territories.

Small area geographies

One of the most important reasons for the Census is to obtain population estimates by age in small geographic areas. Between censuses, the Estimated Resident Population is prepared for sub-state geographies but these estimates are subject to more error than the state and/or territory estimates because data on where international migrants settle is weak and local area populations can be substantially affected by internal migration, which is also difficult to measure precisely. A vital contribution of the Census is to rebase the Estimated Resident Population every five years for small area geographies. Therefore, while gross comparisons can be made between the Census counts and the Estimated Resident Population for small areas, assessing the meaning of the differences requires considerably more analysis than was possible in the time available to the Panel. This work will be carried out by the ABS. In addition, the Post Enumeration Survey does not provide reliable estimates of the undercount or overcount below the level of capital city and rest of state.

3.4.2 Sex ratio

Decorative banner

The ratio of males to females in each age is a conventional way of measuring the accuracy of census data. Figure 3.4.19 compares the age-specific sex ratios (males per 100 females) of the 2021 Census and the unrebased Estimated Resident Population at 30 June 2021. The differences between the two sources are very small with the Estimated Resident Population sex ratios being slightly higher over a wide range of adult ages (see Figure 3.4.19), reflecting a slightly higher undercount of males in the Census compared with females.

Notes: Unrebased Estimated Resident Population based on the 2016 Census as published on 16 December 2021.

Census count excludes overseas visitors and includes Other Territories.

3.4.3 Implications for Census quality

Decorative banner

Including the imputed records, the Census and the Estimated Resident Population comparisons are reasonably close from age 40 upwards. Overall, there is a much closer fit between the Census counts and the Estimated Resident Population in 2021 compared to 2016. However, for babies, the childhood years and young adults, the Census estimate is lower. This pattern is true for most states and territories except for Tasmania and the Australian Capital Territory, which saw higher counts of young adults in the Census than in the population estimates; and in Victoria, which saw more babies (0 years of age) counted in the Census because of delays in birth registrations. Despite these differences, and in light of the close alignment overall, we conclude that the Census is fit-for-purpose for its very important use in updating the Estimated Resident Population by age and sex at the national and state/territory levels.

3.5 Aboriginal and Torres Strait Islander peoples

An independent view of the quality of statistical outputs from the 2021 Census of Population and Housing

Released
28/06/2022

3.5.1 Population counts

Decorative banner

3.5.1.1 Australia and states and territories

In the 2021 Census, there were 812,728 people who reported Aboriginal and Torres Strait Islander origins, an increase of 25.2% from 2016, compared to an increase of 18.4% from 2011 to 2016 (see Table 3.5.1).

  • The number of people reporting as being of Aboriginal origin increased from 590,056 in 2016 to 742,882 in 2021, representing an increase of 25.9% from 2016 to 2021, and up from 19% between 2011 and 2016.
  • The count of people of Torres Strait Islander origin was 33,765 in 2021 up from 32,345 in 2016, an increase of 4.4%.
  • The number of people reporting that they were of both Aboriginal and Torres Strait Islander origin grew by 34.8% between 2016 and 2021, from 26,767 to 36,083.

Similarly, large increases in the counts of Aboriginal and Torres Strait Islander peoples have been observed in previous censuses. These increases have been explained by factors of demographic change as well as other factors including changes in census coverage and census response rates and a changing propensity to identify as being of Aboriginal and Torres Islander origins. The question on Indigenous status in the Census is reliant on self-identification and people may change their identification between censuses.

In the 2021 Census, there were 172,387 people who responded to the Census but did not provide a response to the Indigenous status question resulting in a non-response rate of 0.7% for this data item. This is lower than the rates for 2016 and 2011 which were 1.0% and 1.4%, respectively.

In every census, there are people who do not complete a census form but are in a dwelling that was considered occupied on Census night. In such cases, ABS imputes people into these dwellings. Imputation is the process that attempts to fill in basic information for the people who didn’t respond to the Census. Currently, this information is limited to a person’s age, sex, usual residence and marital status, but Indigenous status is not imputed. In 2021, there were 1,061,722 people who did not respond to the Census but whose basic demographic information was imputed. For these people their Indigenous status is unknown.

In 2021, as in previous censuses, New South Wales and Queensland had the largest counts of usual residents reporting they were of Aboriginal and Torres Strait Islander origins (with counts of 278,043 persons and 237,303 persons, respectively) with increases of 28.6% and 27.3%, respectively between 2016 and 2021. The largest proportional increases were in the Australian Capital Territory (37.5% increase or an increase of 2,441 persons) and Victoria (37.4% or an increase of 17,858 persons) while the smallest was in the Northern Territory (4.9% or an increase of 2,867 persons). Every five years following the Census, the ABS undertakes analysis of the changes in the counts of Aboriginal and Torres Strait Islander peoples. The ABS’s analysis of the 2021 counts will be released in 2023.

Table 3.5.1 Census counts of Aboriginal and Torres Strait Islander identification by state/territory of usual residence

2021

Australia (a)

NSW

Vic.

Qld

SA

WA

Tas.

NT

ACT

Aboriginal and Torres Strait Islander peoples subtotal

812,728

278,043

65,646

237,303

42,562

88,693

30,186

61,115

8,949

Aboriginal

742,882

267,067

61,865

193,405

40,592

85,004

27,738

58,566

8,425

Torres Strait Islander

33,765

5,127

2,083

21,772

994

1,625

1,225

692

230

Both Aboriginal and Torres Strait Islander

36,083

5,844

1,692

22,122

967

2,068

1,229

1,852

300

Australians of other descent

23,375,949

7,404,499

6,148,188

4,635,042

1,669,314

2,431,204

501,521

152,705

429,520

Not stated (responding person) (b)

172,387

55,632

42,081

37,050

12,395

16,072

5,197

2,064

1,850

Not Stated (imputed person) (c)

1,061,722

333,981

247,582

246,742

57,251

124,052

20,659

16,714

14,182

Total (d)

25,422,788

8,072,163

6,503,491

5,156,138

1,781,516

2,660,026

557,571

232,605

454,499

 2016

Australia (a)

NSW

Vic.

Qld

SA

WA

Tas.

NT

ACT

Aboriginal and Torres Strait Islander peoples subtotal

649,171

216,176

47,788

186,482

34,184

75,978

23,572

58,248

6,508

Aboriginal

590,056

207,256

44,592

148,943

32,616

72,924

21,570

55,805

6,140

Torres Strait Islander

32,345

4,839

2,024

21,053

938

1,434

1,119

744

183

Both Aboriginal and Torres Strait Islander

26,767

4,080

1,171

16,493

629

1,628

889

1,699

183

Australians of other descent

21,341,231

6,826,286

5,532,275

4,211,020

1,557,001

2,237,541

455,137

147,327

370,748

Not stated (responding person) (b)

227,589

71,080

61,114

45,337

17,916

20,228

6,845

2,500

2,492

Not Stated (imputed person) (c)

1,183,899

366,686

285,449

260,345

67,554

140,663

24,411

20,760

17,656

Total (d)

23,401,892

7,480,228

5,926,624

4,703,193

1,676,653

2,474,410

509,965

228,833

397,397

 2011

Australia (a)

NSW

Vic.

Qld

SA

WA

Tas.

NT

ACT

Aboriginal and Torres Strait Islander peoples subtotal

548,368

172,625

37,992

155,826

30,432

69,664

19,625

56,779

5,184

Aboriginal

495,754

164,611

34,947

122,897

28,831

67,063

17,742

54,571

4,859

Torres Strait Islander

31,407

4,770

2,158

20,095

1,039

1,309

1,171

675

190

Both Aboriginal and Torres Strait Islander

21,205

3,244

881

12,831

559

1,296

713

1,532

138

Australians of other descent

19,900,765

6,402,111

5,069,155

3,952,704

1,503,204

2,038,783

456,343

137,773

338,029

Not stated (responding person) (b)

290,022

94,836

77,508

55,467

21,408

27,485

7,446

2,696

3,120

Not Stated (imputed person) (c)

768,561

248,084

169,388

168,737

41,524

103,236

11,932

14,696

10,882

Total (d)

21,507,719

6,917,656

5,354,039

4,332,737

1,596,569

2,239,171

495,351

211,943

357,218

(a) Includes Other Territories.

(b) Person was included on a Census form but did not answer the Indigenous status question.

(c) Person was not included on a Census form.

(d) Excludes overseas visitors.

3.5.1.2 Age distribution

Figure 3.5.1 shows the age distribution of people who reported they were of Aboriginal and Torres Strait Islander origins in the 2021 Census and in the 2016 Census. It shows that much of the increase in the counts is in the childhood years (0-14 years). In 2016, there were 73,625 children aged 0-4 years of Aboriginal and Torres Strait Islander origins while in 2021 the number of 0-4 year olds had increased to 85,941. Similarly, the count of 5-9 year olds increased from 75,755 to 89,137 while the largest increase was observed for 10-14 year olds where the count increased from 71,378 in 2016 to 90,473 in 2021.

Note: Includes Other Territories.

Figure 3.5.2 shows the same information presented in a different way. It shows people in both the 2016 and 2021 Censuses at the age they were in 2016. In 2016, there were 73,265 Aboriginal and Torres Strait children aged 0-4 years. Five years later in the 2021 Census, they would be between 5-9 years of age but this group had now grown to 89,137. The difference in the two lines reflects changes in coverage and response in the Census, and changes in identification. There are increases in the counts across almost all age groups.

Notes: Includes Other Territories.

2021 age group has been adjusted (i.e. five years subtracted) to indicate age group at 2016.

3.5.1.3 Counts for capital city and rest of state

Below state level, the results have been analysed for greater capital cities and rest of state/territory. In 2021, the largest counts of Aboriginal and Torres Strait Islander peoples were in the rest of New South Wales (a count of 185,873 persons, increasing by 28% since 2016) and the rest of Queensland (159,179 persons increasing by 21% since 2016) (see Figures 3.5.3 and 3.5.4). These areas are outside the greater capital city boundaries in each of their respective states.

The counts have increased across all capital cities and rest of state areas with the exception of the rest of the Northern Territory where the counts have remained flat over the last three Censuses (with a small decrease in 2021).

Notes: Capital city counts for the Australian Capital Territory are for the whole of the Australian Capital Territory.

Excludes Other Territories and Migratory, Offshore and Shipping categories.

Notes: Capital city counts for the Australian Capital Territory are for the whole of the Australian Capital Territory.

Excludes Other Territories and Migratory, Offshore and Shipping categories.

3.5.2 Mode of response

Decorative banner

Aboriginal and Torres Strait Islander peoples have increasingly taken up the online option when completing their Census with almost two thirds of responses in 2021 being online. There has been a corresponding decline in the proportion of paper responses. A large number of responses from Aboriginal and Torres Strait Islander peoples are also received via Interviewer household forms which are used in particular discrete communities (communities comprising mainly Aboriginal and Torres Strait Islander peoples and which are managed on a community basis) and where the use of the standard self-enumeration form may be impractical. Almost 9% of Aboriginal and Torres Strait Islander peoples were enumerated on this type of form in 2021, down from 14.2% in 2011 (see Figure 3.5.5).

As has been noted elsewhere, the online Census form delivers data of a high quality due to its ease of use and electronic assistance within the form, so an increase in its use can be expected to deliver associated increases in data quality.

Note: Includes Other Territories.

3.5.3 Ancestry

Decorative banner

Ancestry is part of the cultural diversity suite within the Census and provides information about countries or cultures to which people feel they have an affiliation. It is subjective by its very nature and a person’s cultural identity may not be well known amongst unrelated household members. The question allows provision of up to two ancestries, which may limit people with more complex ethnic backgrounds.

The number of Aboriginal and Torres Strait Islander peoples reporting that they had Australian Aboriginal ancestry or Torres Strait Islander ancestry in their first Ancestry response increased dramatically in the 2021 Census (see Figure 3.5.6). The number reporting Aboriginal ancestry increased from 90,673 in 2011 and 89,984 in 2016 to 694,644 in 2021. Similarly, there was a large increase in the number of people reporting they were of Torres Strait Islander ancestry, up from 6,709 in 2011 and 7,149 in 2016 to more than 28,000 in 2021. There have been corresponding decreases in the number of people reporting Other Australian ancestry (down from 298,283 in 2016 to 27,497 in 2021), and in reporting Other ancestries (down from 220,982 in 2016 to 34,630 in 2021). The non-response rates for Ancestry as reported by Aboriginal and Torres Strait Islander peoples have declined in recent censuses from 7.5% in 2011, 5.1% in 2016 and 3.4% in 2021.

The very large increases observed in 2021 reflect a change to the layout of the Ancestry question in the 2021 Census in both the paper and online form. This change was made following feedback from the Round Table on Aboriginal and Torres Strait Islander Statistics that revising response categories for topics such as Ancestry would improve engagement and participation without adding questions to the Census.[1] Firstly, 'Aboriginal' and 'Torres Strait Islander' were added as specific response categories. In addition, on the online form, these categories appeared at the top of the pick list if a respondent answered the Indigenous status question with a response of Aboriginal, Torres Strait islander or both. These changes would have the effect of acting as an overt prompt for respondents.

While these increases were observed on the online and paper form responses in 2021, this was not evident in responses via the Interviewer household form. This is because those more overt prompts have been in use in this type of form in past censuses.


[1] Australian Bureau of Statistics (2018). Census of Population and Housing: Topic Directions, 2021. Retrieved from https://www.abs.gov.au/ausstats/abs@.nsf/Lookup/2007.0.55.001main+features12021.

(a) Other Australian includes Australian, Australian South Sea Islander, Norfolk Islander and Australian Peoples, not further defined.

Note: Includes Other Territories.

3.5.4 Australian Defence Force service

Decorative banner

This is one of two new topics introduced in the 2021 Census. The counts of people of Aboriginal and Torres Strait Islander origins who reported that they were currently serving in the Australian Defence Force in either a regular or reserve capacity varies between the Census and the Department of Defence (see Figure 3.5.7). Differences between the two data sources may be due to different levels of Aboriginal and Torres Strait Islander self-identification reported in the Census and in the Department of Defence data. The Panel has limited capacity to assess the quality of Census data on previous Australian Defence Force service, as there is neither a definitive independent source nor historical Census data. The Census counted 11,610 Aboriginal and Torres Strait Islander peoples who had previously served in the Regular or Reserves Service.

Note: Census data includes Other Territories.

3.5.5 Long-term health conditions

Decorative banner

Long-term health conditions is the second new topic included in the 2021 Census. The question asked people whether they have ever been told by a doctor or nurse that they have any selected long-term health conditions. With a non-response rate of 8.1%, a relatively high number of Aboriginal and Torres Strait Islander peoples did not answer this question, most likely due to sensitivity issues and a desire not to disclose a condition to others in the household or a possible lack of knowledge of others’ health conditions in the household.

As observed in Figure 3.5.8, there are differences in the levels of long-term health conditions reported in the Census and in other surveys and this is due to differences in scope and methodology. Such differences are apparent when comparing the Census and 2018-19 National Aboriginal and Torres Strait Islander Health Survey. While the levels of Aboriginal and Torres Strait Islander peoples reporting long-term health conditions are different between the two data sources, the patterns of reporting are similar, with the conditions with the highest levels reported being mental health conditions and asthma in both surveys. The proportion reporting mental health conditions is much lower in the Census than in the National Aboriginal and Torres Strait Islander Health Survey, and this pattern was observed in the total population (see Section 3.7).

It is likely that more detailed and targeted surveys such as the National Aboriginal and Torres Strait Islander Health Survey will provide better estimates of the level of reporting, noting that this survey also includes self-diagnosed conditions. However, the utility of the Census is in the ability to provide cross classifications by a range of characteristics for small geographic areas. Further investigation will be conducted by the ABS into the benefits and limitations of long-term health conditions information collected in the Census.

(a) All National Aboriginal and Torres Strait Islander Health Survey (NATSIHS) data used in this figure includes self-diagnosed conditions.

Note: Includes Other Territories.

Figure 3.5.9 indicates a high level of non-response to this question for people under 15 years on the Interviewer household form. The placement of the question on this form may have influenced non-response.

Note: Includes Other Territories.

3.5.6 Net undercount

Decorative banner

The Post Enumeration Survey estimated that 983,257 Aboriginal and Torres Strait Islander peoples should have been counted in the Census, compared to the 812,505 who were actually counted. This is equivalent to a net undercount of 170,752 people, or a rate of 17.4% of the Post Enumeration Survey population estimate. This is similar to the level in the previous two Censuses (see Table 3.5.2).

Table 3.5.2 Net undercount, Post Enumeration Survey population estimates and Census counts, by Indigenous status


PES population estimate

Census count (a)(b)

Net undercount (c)

Net undercount rate


no.

Standard error

no.

no.

Standard error

%

Standard error

2021

Aboriginal and Torres Strait Islander peoples

983,257

21,590

812,505

170,752

21,590

17.4

1.8

Australians of other descent

24,624,765

41,448

23,371,978

1,252,787

41,448

5.1

            0.2

Not stated

 -

 -

1,233,495

 -

 -

 -

 -

2016

Aboriginal and Torres Strait Islander peoples

786,689

19,776

648,939

137,750

19,776

17.5

2.1

Australians of other descent

22,837,014

46,483

21,337,326

1,499,688

46,483

6.6

0.2

Not stated

 -

 -

1,411,031

 -

 -

 -

 -

(a) Includes imputed persons in non-responding dwellings. These were all given an Indigenous status of 'not stated'.

(b) Refers to Census counts which correspond to the scope of the Post Enumeration Survey (PES) and may differ slightly from aggregate counts in other Census products.

(c) Net undercount is based on Census counts for a category. In the Census, Indigenous status is set to not stated where the response was blank or where imputed person records were created for non-responding dwellings. Hence, components of undercount for Indigenous status do not sum to the Australia total.

 – Nil or rounded to zero.

Note: Excludes Other Territories and overseas visitors.

In collaboration with the ABS, the Panel has reviewed the methodology used to obtain the estimates of the undercount. The estimates are sensitive to:

  • accurate matching of persons between the Post Enumeration Survey and the Census; and
  • correlated response bias (see Appendix C).

With respect to accurate matching, the ABS puts considerable effort into matching Aboriginal and Torres Strait Islander peoples given it is more difficult because of less consistency in the use of names, for example. Regardless of the efforts made, it is difficult to determine whether there is a match or non-match between the Post Enumeration Survey and the Census. To the extent that there are remaining linking errors, there will be an upward bias in the estimate of the undercount.

With respect to correlated response bias the adjustment does not remove all the biases and there are reasons why this may be relatively higher for Aboriginal and Torres Strait Islander peoples. This will lead to a downward bias in the estimate of the undercount.

Sensitivity analysis undertaken by the ABS suggests that the impact of inaccurate matching is larger than correlated response bias so there may be a net upward bias in the estimate of the undercount. However, this would also apply to the previous two Censuses. This is confirmed by an independent estimate of the undercount using the Multi-Agency Data Integration Project (MADIP) data which suggests it might be about 15%. Even if you could make an adjustment for that bias, the undercount for Aboriginal and Torres Strait Islander peoples is clearly higher than for Australians of other descent.

As noted in earlier sections, the 2021 Census had a higher response rate than the 2016 Census in the capital cities and major urban areas. However, the opposite occurred in the more remote areas particularly in Western Australia where there were recruitment and access difficulties. The proportion of Aboriginal and Torres Strait Islander peoples is relatively high in these areas so they may not have benefitted to the same extent from the general increase in response rates.

Looking at the reasons for the undercount of Aboriginal and Torres Strait Islander peoples showed some differences between 2016 and 2021. Unpublished data indicates that there was an increase in the number of persons who, in the Post Enumeration Survey, said they were elsewhere on Census night but could not be found. The increased lag between the timing of the Census and the Post Enumeration Survey may be a partial explanation. It also indicates an increase in the number of persons who were in dwellings missed by the Census.

Another change has been the relative importance of the contact and non-contact sectors between the 2011 and the 2016 and 2021 Censuses. In 2011, two-thirds of the undercount was due to the contact sector. In 2016, the non-contact sector dominated (55%) possibly because of issues with occupancy determination and in 2021 it was about 50%. If data from MADIP could be used as an alternative source for determining Aboriginal and Torres Strait Islander origins, the undercount might be reduced considerably and warrants further investigation for future censuses.

Table 3.5.3 Net undercount rate in the contact and non-contact sector for Aboriginal and Torres Strait Islander peoples


Contact sector (CS)

Non-contact sector (NCS)

Total


Gross undercount

Gross overcount

Net difference in classification

Census 'not stated'

CS - Net undercount

NCS -Net undercount

Total - Net undercount


%

%

%

%

%

%

%

2011

11.0

1.4

0.8

1.1

11.5

5.7

17.2

2016

11.6

2.1

-2.5

0.8

7.8

9.7

17.5

2021

11.0

1.5

-1.3

0.7

9.0

8.4

17.4


3.5.7 Implications for data quality

Decorative banner

The growth in the counts of Aboriginal and Torres Islander peoples seen in previous censuses has continued. Changes in the counts have an impact on other statistics, such as population measures and some performance indicators used for government reporting. As after previous censuses, ABS will further analyse the increase in the counts to understand the changes observed in the 2021 Census. The Post Enumeration Survey estimates that net undercount for Aboriginal and Torres Strait Islander peoples remains high (17.4%) despite considerable investment in and efforts to improve enumeration.

A large increase in online form response by Aboriginal and Torres Strait Islander peoples is expected to have associated increases in data quality due to the reasons mentioned elsewhere (see Section 3.3.4). A change to the layout of the Ancestry question for 2021 has resulted in increased numbers of people reporting Aboriginal and Torres Strait Islander ancestry.

3.6 Dwellings

An independent view of the quality of statistical outputs from the 2021 Census of Population and Housing

Released
28/06/2022

Overview

Decorative banner

Our needs and preferences for housing change over time, and differ from region to region. Information gathered in the Census about dwellings is used to determine changes in levels of housing stock and patterns of use, including changes in housing density. It also assists in urban and neighbourhood design, transport planning, and land use forecasting.

The 2021 Census reveals a faster pace of growth in the dwelling counts than in the previous five years. The Australian Capital Territory, Victoria and Queensland experienced the highest rates of growth in the number of dwellings, and South Australia the lowest, as shown in Table 3.6.1. Of interest is the acceleration in dwelling growth seen in some of the states and territories such as New South Wales and Tasmania compared to the previous five years. In contrast, Western Australia and the Northern Territory have experienced a slowing of dwelling growth compared to the previous five years after a slowdown in the mining boom.

Table 3.6.1 Total dwellings (a)
State/territory201120162021% change 2011-2016% change 2016-2021
New South Wales2,871,5553,066,9863,364,8026.89.7
Victoria2,282,7512,525,5402,810,81510.611.3
Queensland1,831,9611,992,6742,195,5958.810.2
South Australia729,172767,267808,3795.25.4
Western Australia963,3271,073,7231,150,41611.57.1
Tasmania233,136242,513259,3184.06.9
Northern Territory81,91790,74096,56410.86.4
Australian Capital Territory145,473163,541187,15312.414.4
Australia (b)9,140,2319,924,97510,875,2488.69.6

(a) Includes all dwelling types (private and non-private dwellings, and Migratory, Offshore and Shipping categories).

(b) Includes Other Territories.

3.6.1 Occupancy

Decorative banner

The occupancy rates for private dwellings are consistently higher in the 2021 Census than in the two previous censuses. Occupancy rates increased across all states, ranging from 88.7% in Tasmania to 93.6% in the Australian Capital Territory (see Table 3.6.2).

Changes in private dwelling occupancy are affected by several factors including the amount of the available dwelling stock; the number of people travelling and away from home on Census night; the number of overseas visitors and usual residents returning from overseas; and other demographic changes such as migration. Many of these factors have been impacted by the COVID-19 pandemic which saw movements of people, within, into, and out of Australia restricted.

Occupancy rates can also vary according to how well the ABS has determined the occupancy status of a dwelling, and in 2021 the ABS made two key innovations to enhance this determination. First, ABS made it easier for people to report that their home was not occupied on Census night. Secondly, a new occupancy indicator based on administrative data was created. This indicator was used during data processing to better identify whether a dwelling was occupied or not in the event that there was insufficient information from the field to do this. These innovations were introduced to address the previous Panel’s observation on occupancy determination (see Appendix A), however their introduction proved particularly beneficial given the impact of COVID-19 lockdowns on field enumeration activities in a number of jurisdictions and the inability to have personal contact.

The increases in occupancy may be somewhat understated because the number of dwellings deemed to be occupied in the 2016 Census was over-estimated. However, estimates from the Post Enumeration Survey indicate that there was reduced over-imputation for private dwellings in 2021 compared to 2016, nationally and in most states or territories. In other words, improvements have been observed in the correct identification of occupancy in the Census. Therefore, the increase at the national level reflects real changes between 2016 and 2021 Censuses, although slightly understated.

Table 3.6.2 Occupancy of private dwellings (a)
State/territory2011 (%)2016 (%)2021 (%)% point change 2011-2016% point change 2016-2021
New South Wales90.790.791.10.00.4
Victoria89.288.989.4-0.30.5
Queensland90.390.291.2-0.11.0
South Australia88.588.089.6-0.51.6
Western Australia88.687.689.7-1.02.1
Tasmania86.086.788.70.72.0
Northern Territory89.488.189.1-1.31.0
Australian Capital Territory93.092.393.6-0.71.3
Australia (b)89.889.590.4-0.30.9

(a) Occupancy rates are dependent on determination of occupancy for private dwellings.

(b) Includes Other Territories.

3.6.2 Dwelling structure

Decorative banner

Separate houses represented 70.1% of the dwelling stock in 2021 continuing a decline from 71% in 2016 and 73.7% in 2011 (see Table 3.6.3). Conversely, flats or apartments in a four or more storey block increased their share from 5.4% of Australia’s dwelling stock in 2016 to 7.5% in 2021, a sign of growing urban intensification. There has been a reduction in the proportion of dwellings which had their structure type listed as ‘not stated’ down to 0.3% in 2021 from 0.5% in 2016.

The ABS introduced new processes and procedures for the Dwelling structure data item in the 2021 Census in response to feedback from the 2016 Independent Panel. These included making more use of an increasingly mature Address Register to populate Dwelling structure; the use of Building Approvals data to source Dwelling structure information for some new dwellings; and the development of an imputation model to assign Dwelling structure where no other data is available. This new imputation model was particularly important in 2021 with the introduction of the new self-service option of the ‘No-Census Number’ option (see Appendix E). This option allowed users to complete their Census without the code and password delivered to their address (a measure introduced to increase response), and resulted in an increase in the number of dwellings without a dwelling structure. Dwelling structure imputation addressed this issue where there was adequate geographic location information to use the imputation model (see Appendix A for more detail).

Flats or apartments attached to a house represented 0.2% of dwellings in 2021, an increase resulting from the ABS making use of administrative data to source information on these types of dwellings.

Table 3.6.3 Proportion of dwellings by dwelling structure (a)
Dwelling structure2011 (%)2016 (%)2021 (%)% point change 2011-2016% point change 2016-2021
Separate house73.771.070.1-2.7-0.9
Semi-detached, row or terrace house, townhouse etc. with one storey5.97.36.91.4-0.4
Semi-detached, row or terrace house, townhouse etc. with two or more storeys4.05.55.71.50.2
Flat or apartment in a one or two storey block6.95.04.4-1.9-0.6
Flat or apartment in a three storey block3.43.73.50.3-0.2
Flat or apartment in a four or more storey block (b)4.15.47.51.32.1
Flat or apartment attached to a house0.10.00.2-0.10.2
Caravan (c)1.10.70.5-0.4-0.2
Cabin, houseboatna0.30.3na0.0
Improvised home, tent, sleepers out0.20.20.10.0-0.1
House or flat attached to a shop, office, etc.0.20.30.20.1-0.1
Not stated0.10.50.30.4-0.2
Not applicable (d)0.30.20.2-0.10.0

(a) Includes Other Territories.

(b) For 2021, the two separate categories of Flat or apartment in a four to eight storey block and the new category of Nine or more storey block were combined for comparability with previous Censuses.

(c) Caravan, cabin and houseboat were combined in 2011.

(d) Dwelling structure is only applicable to private dwellings.

na  not available

3.6.3 Housing tenure

Decorative banner

There has been very little change in housing tenure over the last three Censuses. Dwelling owned with a mortgage is the most common tenure type and this has remained steady, as shown in Figure 3.6.1. The proportion of dwellings owned outright declined slightly between 2011 and 2016 and has stayed at that level since. The proportion of dwellings being rented has remained steady since 2016 after a rise between 2011 and 2016.

(a) Includes being purchased under a shared equity scheme.

(b) Includes being occupied rent free, being occupied under a life tenure scheme and other tenure type.

Notes: Includes Other Territories. Excludes Not stated.

3.6.4 Non-private dwellings

Decorative banner

There have been significant changes in the number of non-private dwellings by type (see Table 3.6.4). There are several reasons for these changes:

  • Some non-private dwellings were temporarily closed on Census night because of the pandemic. This applied to hotels, motels, etc (-10.2%) and to a large extent to staff quarters (-16.0%). The decline in the number of persons in staff quarters was not as great suggesting it was the smaller quarters that were closed (e.g. staff quarters on agriculture establishments).
  • Some non-private dwellings have closed or permanently changed. The decline in nurses’ quarters (16.1%) occurred on the frame prior to enumeration and reflects the closure of some establishments and a shift to their broader use for hospital staff and subsequent shift in classification.
  • Some reflect improvements in the frame as a result of collaboration with state government and local government agencies. Boarding houses (+118.0%), hostels for the homeless and night shelters (+20.7%), and other welfare institutions (+44.2%) fall into this category.
  • Some reflect real growth such as the 18.2% increase in residential colleges.
  • The 39.0% decrease in hostels for the disabled is explained by the treatment of small hostels as private dwellings in the 2021 Census.

Overall, it appears that there was a more accurate frame for non-private dwellings in 2021 than in 2016.

Table 3.6.4 Count of non-private dwellings by type (selected) (a)
201120162021% change 2011-2016% change 2016-2021
Hotel, motel, bed and breakfast9,75410,6869,5949.6-10.2
Staff quarters1,8601,8181,528-2.3-16.0
Boarding house, private hotel1,2261,1362,476-7.3118.0
Residential college, hall of residence4625065989.518.2
Public hospital (not psychiatric)662631608-4.7-3.6
Private hospital (not psychiatric)2342402472.62.9
Psychiatric hospital or institution200198207-1.04.5
Hostel for the disabled1,1311,078658-4.7-39.0
Nursing home2,1481,9512,012-9.23.1
Accommodation for the retired or aged (not self-contained)1,1551,2301,1146.5-9.4
Hostel for homeless, night shelter, refuge492323390-34.320.7
Other welfare institution8378751,2624.544.2
Prison, corrective institution for adults203193192-4.9-0.5
Immigration detention centre19119-42.1-18.2
Total non-private dwellings (b)22,83223,17222,6161.5-2.4

(a) Includes Other Territories.

(b) Total of all non-private dwellings.

3.6.5 Implications for Census data quality

Decorative banner

The count of Census private dwellings aligns well with new housing supply estimates by ABS’s Construction Statistics. The increase in occupancy rates is what you would expect during a pandemic, especially with many parts of Australia in lockdown at the time of the Census. The changes implemented by the ABS appear to have improved the accuracy of this measure. The changes in dwelling structure type are in line with expectations and the reduction in the ‘not stated’ category is a positive outcome although it is higher than that of 2011 Census. The work undertaken to improve the non-private dwelling frame should lead to improved quality for that part of the Census.

3.7 Data items and key population groups

An independent view of the quality of statistical outputs from the 2021 Census of Population and Housing

Released
28/06/2022

Overview

Decorative banner

In this section, attention is given to the accuracy of reporting of individual questions (data items). The criterion used to assess the data is whether the 2021 Census data item is as fit-for-purpose (or of similar quality) as the same data item in previous censuses. To do this, the Panel used three approaches:

  • comparison of results of the 2021 Census with results for the same data item from previous censuses;
  • where available, comparison of the results of the 2021 Census with some other independent data source for the same data item; and
  • examination of the 2021 Census results to see if they look broadly reasonable based upon expectations.

There are specific considerations that arise in relation to the assessment of the validity of responses to survey and census questions. Five such considerations are examined in relation to the 2021 Census questions, including:

  • the degree of subjectivity of the question;
  • the knowledge required to answer the question or the extent to which a person’s characteristics are acknowledged;
  • the compulsory or voluntary nature of the question;
  • changes in the response boxes to the question; and
  • the complexity of what is being measured or the precision of the measurement being made.

The first consideration is that Census questions vary in their degree of subjectivity. For example, the Age data item is objective because most but not all people know their age accurately. At the other end of the spectrum are more subjective questions such as Need for assistance which can be interpreted in different ways or community perceptions can change across time.

A second consideration is the knowledge required to answer a question. The Census form may be separately completed by each individual within a household, or one person may complete the form on behalf of others within the household. Some questions, such as Long-term health conditions, involve information that may not be readily known by others in the household. It is also possible that an individual’s response to a question may change across censuses because they gain knowledge that they did not have at the previous census, such as their ancestry.

A third consideration is that some census questions are voluntary. These items are Religion, and whether the record can be kept in the National Archives. Across censuses, people may change the extent to which they answer voluntary questions, perhaps because of societal changes such as privacy concerns.

The fourth consideration is that census questions use a set of tick boxes for the responses. The order of the tick boxes reflects a logical sequence as is used in labour force questions or the incidence observed at the previous census with boxes being ordered from highest incidence to the lowest. Changes to the question layout other than tick-box ordering may affect the data.

The final consideration is the degree of complexity of measures such as income in a census.

The Panel examined responses to the 2021 Census questions in relation to these five considerations, excluding from the analysis people who did not return a Census form at all. The following discussion covers a range of items which the Panel considers of greatest interest using the five considerations outlined above, noting that not all issues are relevant to each item. The discussion also includes the two new questions, Long-term health conditions and Australian Defence Force service, added to the 2021 Census. Additionally, the ABS separately releases quality statements for all data items.

It should be noted that the data analysis in this section excludes imputed people (people who were not included on a Census form) to allow a more meaningful assessment of data quality across censuses. This is particularly important given the decline in imputation between the 2016 and 2021 Censuses, and the allocation of ‘not stated’ values to imputed people for most Census data items. This means that there may be some small differences between the figures in this report and standard Census products such as QuickStats and Community Profiles, and the latter should be used as the source for most statistical, as opposed to data quality, purposes.

3.7.1 Need for assistance

Decorative banner

The Census asks whether a person has a need for assistance in self-care, mobility and communication because of a disability, long-term health condition or old age. Item non-response has decreased, from 2.2% in 2016 to 1.8% in 2021, which is an improvement in data quality.

Figure 3.7.1 shows that the reporting of need for assistance has remained consistent over time, with very similar patterns by age group across censuses. The proportion needing assistance has increased slightly across most age groups, continuing the pattern from recent censuses. Excluding the oldest age groups, the largest changes were observed for children aged 5-14 years. The findings in this age group were also consistent with results from the Survey of Disability, Ageing and Carers, which showed an increase between 2012 and 2018 in the proportion of children aged 0-14 years with some level of disability.[1]


[1] Australian Bureau of Statistics (2019). Disability, Ageing and Carers, Australia, Summary of Findings, 2018. Retrieved from https://www.abs.gov.au/statistics/health/disability/disability-ageing-and-carers-australia-summary-findings/latest-release#key-statistics

Notes: Excludes overseas visitors and people who did not return a Census form. Includes Other Territories.

The Census questions on need for assistance are at the more subjective end of the spectrum. Some people may interpret this question in terms of high-end nursing or medical care while others may consider that an occasional lift to the doctor or to the shops constitutes a need for care. Changes over time may also be due to changes in diagnosis and the availability of assistance, which may explain the increases in need for care among children. In addition, the need for assistance questions in the Census are measuring a complex concept using a small number of questions. Testing of this question indicated that it was broadly comparable with the ‘Profound or severe core activity limitation’ in the more comprehensive ABS Survey of Disability, Ageing and Carers.[1]

The Panel notes the subjectivity and complexity of this item, but considers it suitable for the intended use, due to the consistency in results across censuses, comparability with secondary sources and the decrease in item non-response.


[1] Australian Bureau of Statistics (2018). ABS Sources of Disability Information, 2012 – 2016. Retrieved from https://www.abs.gov.au/ausstats/abs@.nsf/mf/4431.0.55.002

3.7.2 Social marital status

Decorative banner

Social marital status reports on partnership arrangements for people who are living together, either in a registered or de-facto relationship. The 2021 Census has extremely similar age and sex profiles to the 2016 Census (see Figures 3.7.2A and 3.7.2B), which indicates that this data item is very reliable and is suitable for use.

Notes: Excludes people aged under 15 years, overseas visitors, people who did not return a Census form and other not applicable responses. Includes Other Territories.

Notes: Excludes people aged under 15 years, overseas visitors, people who did not return a Census form and other not applicable responses. Includes Other Territories.

No changes were made to marriage related questions on the Census form in 2021. In December 2017, amendments were made to the Marriage Act 1961 which legalised same-sex marriage. This has had the expected result in the 2021 Census, with many people in same sex couples reporting that they are married. This provides reassurance that the data reflects societal change.

3.7.3 Country of birth

Decorative banner

Country of birth is provided on Census forms by selecting one of the countries of birth listed with text boxes or by writing the name of another country in the text box. There has been an improvement in the proportion of people reporting their country of birth (see Figure 3.3.4).

Country of birth patterns are consistent across the 2011, 2016 and 2021 Censuses. It is possible to compare Census results with a data set independent of the 2016 Census: the unrebased Estimated Resident Population (see Figure 3.7.3). For this data item, there is broad similarity in the numbers across the two data sources. All countries of birth have slightly lower numbers for the 2021 Census than the 2021 Estimated Resident Population, but this is largely attributable to the smaller total population in the Census count (see Appendix B for further information). Observed differences can also be the result of methodological differences between the two collections. For example, the country of birth for New Zealand citizens, obtained from the Estimated Resident Population, has high levels of imputation due to New Zealand’s introduction of biometric passports in 2005 which replaced country of birth with place of birth. This has some impact on comparability, noting that the ABS is able to allocate country of birth to the majority of New Zealand citizens from historical records or information about town or place of birth.

Country of birth is considered relatively simple to answer and objective except for people whose country of birth has changed its name or its boundaries or has been created since the respondent was born. The question maintained the same response options from 2016 to 2021 Census, except for some minor changes in ordering to reflect the most common responses from the 2016 Census and some changes to the online form to improve user experience.

Country of birth is considered fit-for-purpose based on its consistency with previous censuses, lower levels of item non-response, comparability with Estimated Resident Population, and the objective nature of the question. This conclusion is supported by the Post Enumeration Survey results.

Notes: Unrebased Estimated Resident Population based on the 2016 Census. Census count excludes overseas visitors. Includes Other Territories.

3.7.4 Ancestry

Decorative banner

Ancestry is part of the cultural diversity suite within the Census and provides information about ethnic or cultural groups to which people feel they have an affiliation. It is subjective by its very nature and a person’s cultural identity may not be well known amongst unrelated household members. As genealogical research increases, more people are becoming more aware of their ancestry. The question allows provision of up to two ancestries, which may limit people with more complex ethnic backgrounds.

Figure 3.7.4 shows that the proportions over time have been relatively stable for the most common ancestries. Patterns observed in previous censuses have been continued in 2021, such as declining Australian ancestry and increasing Chinese ancestry. Of note is the appearance of Australian Aboriginal in the top ten ancestries for the first time. This is associated with a questionnaire change which is discussed in more detail in Section 3.5.3 Ancestry. The drop in the category ‘Australian’ is affected by the increase in the category ‘Australian Aboriginal’.

Unlike most other items, the level of non-response to this question has not declined since 2016 but has remained at a similar level (see Figure 3.3.5). This maintenance of response levels, along with consistent patterns across previous censuses, indicates that the Ancestry data item is suitable for use after taking into account the increase in the category of ‘Australian Aboriginal’.

Notes: Excludes overseas visitors and people who did not return a Census form. Includes Other Territories.

Ancestry is based on Ancestry multi-response. Respondents could provide up to two responses and therefore may appear in more than one category.

3.7.5 Language

Decorative banner

The proportion of people using broad language groups at home has remained relatively consistent across the 2011, 2016 and 2021 Censuses, with some gradual change associated with changes in migration patterns (see Table 3.7.1). Unlike most other items, the level of non-response to this question has not declined since 2016 but has remained at a similar level. This question is relatively objective and simple to answer. The data is considered suitable for use.

There were some changes to the 2021 Census form to encourage reporting of Australian Indigenous Languages, however this did not lead to a proportional increase in reporting of these languages, either for the general population or Aboriginal and Torres Strait Islander peoples.

Table 3.7.1 Main language used at home
Language used at home201120162021
%%%
English79.676.675.1
Northern European languages (a)0.90.90.7
Southern European languages3.83.63.3
Eastern European languages1.81.71.5
Southwest and Central Asian languages2.32.62.8
Southern Asian languages2.43.65.0
Southeast Asian languages2.73.23.4
Eastern Asian languages3.74.94.9
Australian Indigenous languages0.30.30.3
Other languages0.81.01.0
Supplementary codes (b)0.20.30.2
Not stated1.51.51.6
Total100.0100.0100.0

(a) Northern European, excluding English.

(b) Supplementary codes include inadequately described languages.

Notes: Excludes overseas visitors and people who did not return a Census form. Includes Other Territories.

3.7.6 Religious affiliation

Decorative banner

The proportion of people providing a response to the Religious affiliation question has increased from the 2016 to the 2021 Census. Religious affiliation is the only question where the Census form notes that it is optional.

Noteworthy is the continuing increase in people stating they have no religious affiliation. Between the 2011 and 2016 Censuses, the ‘No religion’ tick box was moved from the bottom to the top of the list of common religions on the Census form. At the time, it was not clear whether the rise in ‘No religion’ responses between 2011 and 2016 Censuses was influenced by the change in the order of the tick boxes. However, the proportion of people reporting no religious affiliation increased at a similar level between the 2016 and 2021 Censuses as between 2011 and 2016 Censuses, as shown in Figure 3.7.5. The ‘No religion’ tick box did not change its position for the 2021 Census, which indicates that this is a real change rather than a consequence of questionnaire design and provides reassurance about the quality of data for Religious affiliation.

(a) No religion, so described.

(b) Other responses include Buddhism, Islam, Judaism, other religions, a small fraction of secular beliefs and other spiritual beliefs and inadequately described responses.

Notes: Excludes overseas visitors and people who did not return a Census form. Includes Other Territories.

3.7.7 Income

Decorative banner

Income is a complex concept and entails some subjectivity, such as whether to include various sources of income such as superannuation and dividends. Information about income levels might not be commonly shared amongst household members, such as in group households, affecting Census forms where one person completes the form on behalf of all others in the household. It is also regarded as more sensitive information. These factors influence the relatively high item non-response for Income. However, non-response levels were lower in the 2021 Census than 2011 or 2016 (see Figure 3.3.5).

The 2021 Census income distribution is consistent with recent censuses, with the expected move from lower to higher income ranges. In the Census, a single question that groups responses into relatively wide categories is asked. In the ABS Survey of Income and Housing, numerous questions relating to each specific source of income are asked. Given these differences, it is perhaps surprising that the 2019-20 Survey of Income and Housing and the 2021 Census show quite similar income distributions once the not stated responses are removed from the Census data (see Figures 3.7.6 and 3.7.7).

The main differences between the two data sources are for those with no income or a low income, with a very similar pattern observed in 2016. As the Survey of Income and Housing asks about every possible source of income, it draws a response for those with low incomes that the Census does not draw. In addition, the 2021 Census was conducted during the pandemic whereas the 2019-20 Survey of Income and Housing was largely conducted pre-pandemic. Further analysis is needed to understand the interaction between the pandemic and income data, noting that various government benefits and payments were available. The income of people in particular industries such as retail and hospitality may have been more severely impacted by lockdowns. As this issue was foreseen by the ABS, the online Census form included the instruction for people in lockdown: ‘Please reflect your usual income, as it was before the commencement of the current COVID lockdown period’.

Notes: Census count excludes overseas visitors, people who did not return a Census form and not stated responses. Census count includes Other Territories.

Survey of Income and Housing data for the 2019-20 financial year that has been inflation adjusted to the June 2021 quarter.

Notes: Census count excludes overseas visitors, people who did not return a Census form and not stated responses.

Census count includes Other Territories.

Survey of Income and Housing data for the 2019-20 financial year that has been inflation adjusted to the June 2021 quarter.

Census income data is considered fit-for-purpose and follows the expected income distribution when compared with recent censuses and an independent data source. There is a marked decline in non-response to this question and continues the decline over time.

3.7.8 Long-term health conditions

Decorative banner

‘Long-term health conditions’ was a new question for the 2021 Census which asked people whether they have ever been told by a doctor or nurse that they have any selected long-term health conditions. At 4.1%, a relatively high number of people did not answer this question, most likely due to sensitivity issues and a desire not to disclose a condition to others in the household or a possible lack of knowledge of others’ health conditions in the household.

Figure 3.7.8 compares 2021 Census results with the 2017-18 National Heath Survey, for conditions which are contained in both collections. The broad patterns are similar between the two collections. As expected, asthma was a leading health condition among children aged 0-14 years. Men were much more prone to heart disease while arthritis was more prevalent among women. Some health conditions had different levels between the Census and the National Health Survey. Cancer was reported at a higher rate in the Census than reported in the National Health Survey. It is not clear why this is the case and should be subject to further investigation. The most notable difference was for mental health conditions, where the proportion reported in the National Health Survey is substantially higher than that in the Census. Methodological differences between the two collections influence these differences, particularly the level of detail contained in the questionnaires. For example, the collection of mental health in the National Health Survey included prompt cards and questions about a range of mental health conditions, including alcohol and drug problems, mood (affective disorders), anxiety related disorders, problems of psychological development, behavioural, cognitive and emotional problems and other mental and behavioural conditions. In contrast, the Census had a single Census response option of ‘Mental health condition (including depression or anxiety)’ with more subjectivity exercised by respondents.

More investigation is needed into the benefits and limitations of long-term health conditions information collected in the Census. However, more specialised data sources such as the National Health Survey may be better sources for levels of specific conditions and the Census would be more useful for analysis on small geographic areas or cross-classification with other socio-demographic characteristics, taking into account the reporting issues with cancer and mental health conditions.

Notes: Census count excludes overseas visitors, people who did not return a Census form and not stated responses.

Census count includes Other Territories.

All National Health Survey data excludes those people who have not been told by a doctor or nurse that they have the condition.

3.7.9 Australian Defence Force service

Decorative banner

‘Australian Defence Force service’ was the other new question added to the 2021 Census. It asked whether people were currently or had previously served in the Australian Defence Force Regular and Reserves Services. The level of non-response is considered reasonable (1.9%).

The Census figures for current service in the Regular Service are very close to Department of Defence workforce counts for the whole of Australia (see Figure 3.7.9). Data from the two sources align closely for most states and territories, with relatively small differences in New South Wales, Victoria and the Australian Capital Territory. These differences are potentially explainable by cross-border issues associated with counting of particular bases and people living across a state or territory border from their base. The differences may also have been affected by domestic redeployment for the Defence Force’s Operation COVID-19 ASSIST. The Census count of people currently in the Reserves Service is slightly lower than Department of Defence figures.

The Panel has limited capacity to assess the quality of Census data on previous Australian Defence Force service, as there is neither a definitive independent source nor historical Census data. The Census counted 496,276 people who had previously served in the Regular or Reserves Service.

This consistency with Department of Defence workforce counts and the acceptable levels of item non-response indicate that this Census data item is fit-for-purpose.

Notes: Department of Defence data is as at June 2021. See Defence Annual Report 2020-21.

Census data relate to persons aged 15 years and over. Includes Other Territories.

3.7.10 Agreement to National Archives retention

Decorative banner

The Census form includes a voluntary question about whether each person agrees to their name, address and other information on the form being kept by the National Archives of Australia and released after 99 years. The proportion of people who do not respond to this question has dropped substantially from 10.2% in 2016 to 6.9% in 2021. In addition, agreement to National Archives retention has increased to levels close to those observed in the 2011 Census, following a dip in 2016 (see Figure 3.7.10). Prior to the 2016 Census there was substantial public commentary about privacy of personal information in the Census form, which most likely contributed to a decrease from 2011 in people stating their agreement of their form being kept by the National Archives. The improved response to this question and increased agreement to retention was higher across all states and territories and suggests that the public approached the issue of privacy in the 2021 Census more positively than for the 2016 Census.

Notes: Excludes overseas visitors and people who did not return a Census form. Includes Other Territories in total for Australia.

3.7.11 Date of birth

Decorative banner

Responses to the question on age and date of birth are used to derive the Age item. Age is a fundamental demographic item and date of birth, in particular, is increasingly important in data integration. Item non-response to the Age item is discussed in Section 3.3.5 Item non-response.

Most of the people who responded to this question reported their date of birth, either with or without their age. The 2021 levels for date of birth reporting are higher than those observed in the 2011 and 2016 Censuses (see Figure 3.7.11). The large increase may be explained by reduced privacy concerns and questionnaire changes. For the first time, the 2021 Census asked people to provide their age and date of birth (previously just one was requested), with a note that age should be given if date of birth is not known.

The Panel considers Age data fit-for-purpose, based on increased response to this question, particularly for date of birth. See also Section 3.4 Population counts and age - sex distributions.

Notes: Excludes overseas visitors and people who did not return a Census form. Includes Other Territories in total for Australia.

3.7.12 Implications for Census quality

Decorative banner

At the national and state and/or territory levels, changes observed in the data items reviewed by the Panel align with expectations. Some data items involve more subjectivity or complexity but are suitable for their intended use. Greater levels of response to most questions may indicate a greater willingness to disclose information on the 2021 Census form and have resulted in improved data quality. The data items assessed in this section generally have results which are consistent with previous censuses or independent data sources, or have observations consistent with expected societal change or pandemic impacts. The ABS should evaluate the two new topics.

4. COVID-19 and the 2021 Census

An independent view of the quality of statistical outputs from the 2021 Census of Population and Housing

Released
28/06/2022

Overview

Decorative banner

The 2021 Census was conducted during the COVID-19 pandemic when many parts of Australia were in lockdown and movements within, into and out of Australia were tightly controlled. The results from the Census, therefore, tell the story of changed circumstances for many Australians and provide insights into the impact of the pandemic on populations in our cities, towns, rural and remote areas.

These changes in population movement, coupled with various access restrictions caused by the pandemic and associated health orders across states and territories, introduced additional complexity in the running of Census data collection and processing.

This section of the Panel’s report looks firstly at the preparations made and implemented by the ABS to support the successful enumeration of the 2021 Census when large parts of south eastern Australia were experiencing some kind of COVID-19 restrictions. The second part of this section focuses on COVID-19’s impact on selected data items.

4.1 Census operations and the pandemic

Decorative banner

The 2021 Census built on the approach used in the 2016 Census. Nearly four in five Australian households completed their Census online, with no in-person contact from the ABS, having received instructions in the mail or having had a paper form dropped off or delivered to their letterbox. Many households also used the new Census Digital Service to complete their Census without receiving instructions and therefore without contact from the ABS. This proved to be especially useful given the disruptions to field operations because of COVID-19 restrictions – people could easily access help, and they did, and in much larger numbers than in previous censuses.

Notwithstanding this, as before, the 2021 Census relied on field staff and running the Census during the pandemic introduced numerous challenges to field operations. In response to the emergence of the pandemic, the ABS developed a Census COVIDSafe Plan to manage field staff and community safety during operations. This plan was implemented in 2020 during the major large-scale Census test, which was conducted in areas across Australia, including in some areas that were under COVID-19 restrictions. This experience, including lessons learned and outcomes achieved, provided confidence to the ABS, stakeholders and field staff that the 2021 Census could safely go ahead.

These preparations proved invaluable as more than half of the Australian population was in lockdown at some stage during the Census enumeration period. In addition, the situation was very fluid as many parts of south eastern Australia moved in and out of lockdown restrictions throughout the Census ‘response window’ in early August 2021 as follows:

  • Leading up to Census night, Victoria entered a state-wide lockdown which remained in place for Greater Melbourne and Shepparton until after Census night. Most of regional Victoria had restrictions lifted on 10 August.
  • Greater Sydney and many parts of regional New South Wales were also in lockdown restrictions during the Census response period.
  • South East Queensland was in lockdown shortly before Census night but this was lifted on 8 August. However, Cairns and Yarrabah were placed in lockdown on 8 August for a short period.
  • The Australian Capital Territory was placed in lockdown shortly after Census night on 12 August.

This resulted in a significant disruption of some aspects of field operations, particularly in New South Wales and Victoria. Also, while most of regional and remote Australia was not in lockdown during the Census, many of these areas had tight labour markets due to interstate and national border closures. This resulted in difficulties recruiting field staff. Several measures were used to minimise the impact of these challenges:

  • Before Census night, restrictions on staff movements impacted the number of field staff available to deliver paper forms in some parts of the country. In response, the ABS commenced delivery earlier than planned, mailed paper forms to many regional towns and utilised Australia Post’s Unaddressed Mail Service to distribute instructions to large numbers of rural and remote postcodes. The Unaddressed Mail Service approach supported households to participate in the event of a delay in delivery of their Census form.
  • The ABS engaged with aged care facilities and hospitals prior to Census night and special arrangements were made to collect data from residents and patients where required. In some establishments, particularly in New South Wales, key Census data was provided by the facility rather than individually collected from residents on Census forms. This in turn, led to the collection of a limited amount of key demographic data for residents in these facilities. However, where direct collection did occur, lockdowns and restricted access led to reduced response in hospitals.
  • In locations where the ABS was unable to provide planned face-to-face support, alternative assistance was offered, including through the ABS website, online video guides in multiple languages and assistance over the phone.
  • After Census night, dwellings that had not responded received reminder letters delivered in the mail or a visit by a Census field officer. In response to hard lockdowns, the ABS delayed early field visits in Greater Melbourne and Greater Sydney and mailed paper forms instead. Despite restrictions, field staff were eventually deployed across all areas of Australia and operated in accordance with local requirements according to the Census COVIDSafe Plan.

Restricted field operations also presented new and unique challenges to determining whether dwellings were occupied  - this was due to the combination of a ‘no contact’ approach in some areas coupled with the ways in which occupancy was expected to have changed due to COVID-19. However, the ABS had developed a probability model in the lead up to the 2021 Census to improve the accuracy of determining whether a dwelling was occupied or not on Census night. This was used during Census processing when there wasn’t enough information from the field to make a determination. The model was also used in validating the final occupancy results for the Census.

The COVID-19 pandemic affected not only the field operations of the 2021 Census, but also data processing operations. The data processing workforce was impacted by the COVID-19 waves in 2021 and 2022 and additional data assurance was required to understand COVID-19 impacts on the data. These additional assurance activities were focused on validating Census data using other data sources and reconciling the large number of Census forms submitted using the new self-service option on the Census Digital Service.  Nevertheless, the ABS was able to manage these shifting circumstances and release data on time on 28 June 2022.

4.2 COVID-19 and 2021 Census results

Decorative banner

In light of the challenges raised in running the 2021 Census, the Panel sought to understand the possible COVID-19 impact on the quality of Census data by examining this impact on a number of ‘first release data items’, that is on data items to be released by the ABS on 28 June 2022. It is anticipated that COVID-19 impacts will also be apparent in some of the ‘second release’ data items (e.g. Labour force, Employment, Journey to work) due for release in October 2022. This timeframe for second release data items means that they were not available to contribute to the Panel’s analysis.

4.2.1 People at their usual residence on Census night

Pandemic restrictions improved some aspects of Census data quality due to less movement of the population on and around Census night, resulting in more people being counted at home than otherwise would have been the case. As a result, the 2021 Census has more accurately captured household and family data such as income.

The proportion of people counted who were at their usual residence on Census night in 2021 was 96.1% (see Table 4.2.1). This is higher than observed in the 2016 and 2011 Censuses (95.1% and 95.2%, respectively). This increase reflects more people staying at home and less interstate travel. The highest proportion of people reporting being at home on Census night was in Victoria (97.5%) where Greater Melbourne was under ’stay at home’ orders. The greatest proportional increase was in Queensland (+1.4% points) but the level was still lower than other eastern states and territories. Only the Northern Territory had a decrease in the proportion, which was due to an increase in the number of visitors counted from elsewhere in Australia in 2021, many of whom may have travelled to Northern Territory from other states to escape COVID-19 lockdowns.

Table 4.2.1 Proportion of people counted at their usual residence on Census night (a)
2016 (%)2021(%)% point change 2016-2021
New South Wales95.897.01.2
Victoria96.397.51.1
Queensland93.594.91.4
South Australia95.796.20.5
Western Australia94.094.00.0
Tasmania95.295.70.5
Northern Territory85.282.5-2.6
Australian Capital Territory95.396.91.6
Australia (b)95.196.11.0

(a) Excludes overseas visitors.

(b) Includes Other Territories.

4.2.2 Overseas visitors

Overseas visitors in the Census are those people who indicate they would usually be resident in Australia for less than a year. As expected, due to Australian international border restrictions during the pandemic, significantly fewer overseas visitors were counted in the 2021 Census compared to previous censuses (see Table 4.2.2). In the 2021 Census, 61,860 people reported that they were visiting Australia from overseas, compared with 315,531 people in 2016 and 219,442 people in 2011. A decrease was observed across all states and territories, with the largest decreases observed in New South Wales, Queensland and Victoria. The impact of this decrease is evident in other Census data, such as the number of people counted in hotel accommodation.

Table 4.2.2 Overseas visitors in the 2021 Census compared with the 2016 Census
201120162021
New South Wales62,08495,91317,458
Victoria44,14973,12012,918
Queensland65,81483,94614,902
South Australia10,44614,3623,619
Western Australia24,90231,2437,540
Tasmania2,1922,9641,046
Northern Territory6,1628,9803,205
Australian Capital Territory3,6564,8781,151
Australia (a)219,442315,53161,860

(a) Includes Other Territories.

4.2.3 New migrants and year of arrival

The impact of the pandemic and border restrictions is also evident in the number of new migrants to Australia in 2020 and 2021. People who respond that they were born overseas are then asked for their year of arrival in Australia. 2021 Census data shows a large decrease in the number of people who arrived in 2020 and 2021 compared with previous years, as shown in Figure 4.2.1. While 321,529 people reported that they arrived in 2019, only 127,532 reported arriving in 2020. Similarly, the number of people reporting their year of arrival as 2021 is low (38,590), noting that this does not represent the full year due to the Census taking place in August 2021.

Note: Excludes overseas visitors. Includes Other Territories.

The data for 2021 is part-year up to approximately August 2021 when the Census was undertaken.

4.2.4 People staying in non-private dwellings

With less movement of the population and a decrease in overseas visitors during the pandemic, there was a significant reduction in the number of people staying in some types of non-private dwellings. Notably, Table 4.2.3 shows that there were 171,646 people staying in hotel, motel and bed & breakfast accommodation in 2021, compared with 327,775 in 2016 (a 47.6% decrease). There was also a noticeable reduction in people staying in residential colleges, which decreased from 69,009 in 2016 to 56,888 in 2021 (a 17.6% decrease) even though there had been quite a large increase in the number of residential colleges.

Table 4.2.3 Count of persons in selected non-private dwellings (a)
201120162021% change 2011-2016% change 2016-2021
Hotel, motel, bed and breakfast265,488327,775171,64623.5-47.6
Residential college, hall of Residence57,04469,00956,88821.0-17.6

(a) Includes Other Territories and overseas visitors.

4.2.5 Private dwelling occupancy

In the Census, dwelling occupancy refers to a dwelling being occupied on Census night. Changes in private dwelling occupancy are impacted by several factors: available dwelling stock; people travelling and away from home on Census night; overseas visitors and usual residents returning from overseas; and other demographic changes such as migration. As indicated earlier, many of these factors have been impacted by the COVID-19 pandemic. 

Private dwelling occupancy in 2021 was 90.4% compared with 89.5% in 2016 (and 89.8% in 2011). This increase in occupancy is noteworthy given the 9.6% growth in private dwellings between the 2016 and 2021 Censuses compared with 8.6% between the 2011 and 2016 Censuses. The increase in dwelling occupancy was observed across all states and territories but varied within states/territories, with reduced rates of occupancy apparent in Greater Melbourne and Greater Sydney (see Figure 4.2.2). For example, the proportion of private dwellings in Victoria that were occupied outside of Melbourne increased by 2.8 percentage points, while the proportion in Melbourne decreased by 0.5 percentage points. A similar pattern was observed for New South Wales (a decrease of 0.6 percentage points in Sydney) and outside of Sydney (an increase of 1.8 percentage points). 

Figure 4.2.2 Increase in the proportion of occupied private dwellings

Map of states and territories as described in the paragraph above and the description for this image.
The figure shows a map of Australia with the percentage point increase from 2016 to 2021 in private dwelling occupancy rate for each greater capital city and rest of state/territory. The percentage point increases shown on the map are: Greater Sydney -0.6, Rest of New South Wales 1.8, Greater Melbourne -0.5, Rest of Victoria 2.8, Greater Brisbane 1.1, Rest of Queensland 0.9, Greater Adelaide 1.7, Rest of South Australia 1.5, Greater Perth 2.2, Rest of Western Australia 1.5, Greater Hobart 1.8, Rest of Tasmania 2.1, Greater Darwin 1.4, Rest of Northern Territory 0.5, Australian Capital Territory 1.3.

Note: The map shows percentage point increase and decrease for greater capital cities and rest of state/territory.

4.3 Implications for data quality

Decorative banner

Through appropriate planning and risk management, including the testing of procedures and systems in the 2020 Census Test, disruptions to Census field operations due to the pandemic were largely overcome without impacting the quality of Census data. Also, new online self-service options, developed to improve the Census experience in 2021, were popular with households across Australia and helped to minimise the impact of COVID-19 restrictions on the delivery of Census forms and other field work. 

COVID-19’s impact on peoples’ movements within, into and out of Australia are clearly reflected in the 2021 Census data across a range of items, as noted above. It is worth highlighting that, as a consequence of reduced population movement in the two years prior to, and during the time of, the Census, more people were counted at home in the 2021 Census than previously. This has enhanced data quality as it resulted in less imputation and the collection of more complete information about families and households, including data such as household income.

In addition, the decrease in visitors from overseas and in international students due to COVID-19 restrictions saw fewer people staying in certain types of non-private dwellings such as hotels and halls of residence. This, in turn, has resulted in a related decrease in the number of imputed persons in these dwellings and a likely associated improvement in data quality.

5. Conclusions and observations

An independent view of the quality of statistical outputs from the 2021 Census of Population and Housing

Released
28/06/2022

Overall assessment

Decorative banner.

The 2021 Census Statistical Independent Assurance Panel (the Panel) has concluded that the 2021 Census data is fit-for-purpose, is of comparable quality to the 2011 and 2016 Censuses and can be used with confidence.

In assessing whether the 2021 Census was fit-for-purpose, the Panel considered how the data compared with previous Australian and international censuses. Internationally, the 2021 Australian Census was comparable to those of Canada and the UK, and higher than the rate for New Zealand which was conducted pre-pandemic. The high response rate for private dwellings (96.1%) was an outstanding achievement given the challenges provided by the pandemic. While the response rate was higher than that achieved in the 2016 Census, the Panel notes that some remote areas’ response rates have declined.

While some quality challenges exist in the 2021 Census, such as the undercount of Aboriginal and Torres Strait Islander peoples, these issues were also present in previous Australian censuses and have not changed significantly. It is also noteworthy that the 2021 Census faced the additional challenge of being conducted during the COVID-19 pandemic and managed to overcome this safely and without affecting data quality. The similarity of the 2021 Census data quality to that of the 2011 Census, and the observed improvement compared with the 2016 Census, contributes to the Panel’s assessment that the 2021 Census data quality is comparable and fit-for-purpose.

Nearly all people in Australia completed Census forms and this was a better result than observed in the 2016 Census. There was a significant increase in the use of the online Census form (with 78.9% of dwellings responding online) and this saw an associated increase in data quality, most noticeably by reductions in data item non-response rates. 

While the response rate for non-private dwellings is similar to 2016, adjustments to the framework used for non-private dwellings led to improvements in quality. There have also been improvements to the non-response imputation methods for non-private dwellings which have resulted in improvements in quality.

The 2021 Census data aligns well with expectations. Counts of the population at the national and state and/or territory level derived from the 2021 Census, adjusted by the Post Enumeration Survey, compare well to the Estimated Resident Population, Australia’s official population estimate, and can be used to rebase these estimates. During comparison of the Census and the unrebased Estimated Resident Population, the Panel noted the importance of five yearly censuses for recalibrating and rebasing the Estimated Resident Population to maintain its accurate reflection of population movement at the state and territory level and it is likely to be even more important at smaller geographic levels.[1] The Panel considers that the Census is clearly fit-for-purpose for all of its important uses and, in particular, the rebasing of the population estimates which are used to allocate funds to the states and territories and allocate numbers of seats for the House of Representatives between the states and territories. Other important uses of Census data include supporting the planning and administration of government, business and other users, and the provision of comprehensive information for small geographic areas and for population groups across Australia.

The 2021 Census continued to collect a comprehensive, detailed picture of Australia’s population. The Panel examined a number of key topics including population counts, Sex, Age, Income, counts of Aboriginal and Torres Strait Islander peoples, Country of birth, Language, Ancestry and Religion. The Panel’s analysis revealed that the items reviewed generally have results which are consistent with previous censuses or independent data sources or have observations consistent with expected societal change or pandemic impacts. Greater levels of response to most questions and an increased online response have resulted in improved data quality. The Panel consider Census topics examined fit-for-purpose but noted that further ABS quality assessments will be very important for interpreting some data items such as Long-term health conditions and Income.

Two new topics were added to the 2021 Census: Long-term health conditions and Australian Defence Force service. Their results generally aligned with the expectations from independent data sources, although the Panel observed some notable differences for further investigation and explanation.

Key quality indicators from the Post Enumeration Survey support the comparability of the 2021 and 2016 Censuses with some improvements observed. The net undercount rate for persons on Census forms decreased from 3.7% to 2.8% between 2016 and 2021, and their gross overcount has remained stable at 1.2%. There have also been improvements in other quality indicators from the Post Enumeration Survey such as the total net undercount. The Panel also noted that the Post Enumeration Survey was very successful given the need to significantly change the methodology because of COVID-19 restrictions on field visits.

The Panel concluded that the Census population data, adjusted by the Post Enumeration Survey, is fit-for-purpose for its important use in rebasing the Estimated Resident Population at the national and state and/or territory level. The Panel considers a five yearly census highly important to calibrating and rebasing Australia’s Estimated Resident Population, one of the most important uses of census data.

Notwithstanding increased efforts and investments by the ABS, one disappointment has been that the net undercount for Aboriginal and Torres Strait Islander peoples remains unchanged at 17% as estimated by the Post Enumeration Survey.

The Panel noted that there had been public concerns raised about privacy prior to the 2016 Census, and that one of their observations related to improved management of privacy. The Panel was pleased to observe that the ABS’s proactive and thorough approach to privacy for the 2021 Census saw few privacy concerns raised. The Panel concluded that improved response to the question on National Archives retention and increased agreement to retention suggests that the public approached the issue of privacy in the 2021 Census more positively than the previous Census.

The Panel notes that there are several areas that deserve specific consideration, as follows.


[1] The Panel is not in a position to make a judgment about data quality below the state and/or territory level due to time constraints.

Successfully running a Census during the COVID-19 pandemic

Decorative banner.

The Panel considers that the ABS’s approach to conducting the 2021 Census during the pandemic was impressive and well managed. The 2021 Census was conducted at a time when many parts of Australia were in lockdown and movements within, into and out of Australia were tightly controlled. Through appropriate planning, risk management, and rigorous testing, disruptions to Census field operations due to the pandemic were largely overcome without impacting the quality of Census data or safety of the public and Census staff. Nevertheless, the ABS faced difficulties with recruitment reflecting a tight labour market, and other challenges caused by the pandemic, such as restrictions on the movement of field staff both intra and interstate.

New online self-service options, developed to improve the Census experience in 2021, were popular with households across Australia and proved particularly beneficial in helping minimise the impact of COVID-19 restrictions on the delivery of Census forms and other field work. The Census Digital Service was completely redeveloped for 2021 and its ease of use proved especially useful given the disruptions to field operations because of COVID-19 restrictions – people could easily access help and the online form, which they did, and in much larger numbers than in previous censuses.

The Panel observed the expected impact of COVID-19 on 2021 Census data with its impact on peoples’ movements within, into and out of Australia clearly reflected in 2021 Census data across a range of items, including the expected declines in foreign student populations and the impact of no immigration for an extended period. In addition, more people were counted at home in the 2021 Census than previously, due to reduced population movement prior to and during the time of the Census. This has enhanced data quality.

Census frame

Decorative banner.

The Address Register is an increasingly important resource. It provided the frame for the 2016 and 2021 Censuses and, in 2021 served as the frame for the Post Enumeration Survey for the first time. The Address Register enables the use of an increasingly efficient and modern Census enumeration model with the delivery of login information directly to peoples’ homes. The Panel has observed however, that there are missing dwellings on the Census frame. Although the number of missing dwellings on the frame is rather small in relative terms, the reasons are worth investigating given the importance of the Register to a range of ABS collections.

Regional and remote enumeration

Decorative banner.

The Panel observed that the improvement in response rates in 2021 was not uniform. While there were significant improvements in capital cities, especially the inner-city areas of most of our cities, there was some decline in response across regional and remote parts of Australia. This is likely to have been associated with recruitment difficulties due to tight labour markets, meaning that fewer, local field staff were on hand to assist in regional and remote areas, a difficulty that was exacerbated by COVID-19 restrictions which limited the movement of field staff around the country to fill in recruitment gaps.

Aboriginal and Torres Strait Islander peoples counts

Decorative banner.

The growth in the counts of Aboriginal and Torres Islander peoples seen in previous censuses has continued. Changes in the counts have an impact on other statistics, such as population measures and some performance indicators used for government reporting. As has occurred after previous censuses, ABS will further analyse the increase in the counts to understand the changes observed in the 2021 Census.

A large increase in online form response by Aboriginal and Torres Strait Islander peoples is expected to have associated increases in data quality consistent with the reasons mentioned elsewhere (see Section 3.3.4). A change to the layout of the Ancestry question for 2021 has resulted in increased numbers of people reporting Aboriginal and Torres Strait Islander ancestry.

Aboriginal and Torres Strait Islander peoples continue to be under-represented in the Census. The Post Enumeration Survey estimated the net undercount rate to be about 17% for each of the last three Censuses despite increased investment in the enumeration of this population. COVID-19 lockdowns and border closures had an impact on the availability of field staff within states and interstate and it is likely that this had an impact on enumeration of Aboriginal and Torres Strait Islander peoples in some areas. The improved enumeration of Aboriginal and Torres Strait Islander peoples should continue to be a priority area for attention by the ABS.

Non-response

Decorative banner.

Non-response in the 2021 Census was lower than for 2016. The main way of compensating for non-response is by imputing for missing dwellings and persons. This requires identification of non-responding dwellings that were occupied on Census night as well as accurately imputing persons. If this could be done perfectly, then non-response would not be an issue. In practice, imputation cannot be done perfectly.

Occupancy determination was more difficult in the 2021 Census because of the inability to have personal contact with many households because of the pandemic. Notwithstanding this the Panel have observed from preliminary analysis of Post Enumeration Survey data that improvements have been made in occupancy determination and imputation between the 2016 and 2021 Censuses. Nevertheless, overcount in the non-contact sector (imputed records) is still driven by error associated with occupancy determination. 

This analysis suggests that in both 2016 and 2021, fewer people were imputed into dwellings correctly identified as occupied and non-responding than would have been expected based on the Post Enumeration Survey results. Overall, this under-imputation of persons has lessened nationally and for most states and territories between 2016 and 2021.

The No-Census Number Option

Decorative banner.

The Panel was impressed by the outcomes of the introduction of the ‘No-Census Number’ option. The option was developed to improve user-experience, increase Census response and coverage, and the Panel has concluded that this has resulted in increased data quality. Improvements to the coverage of and response from the population are evident through increases in the number of dwellings added to the Census Frame, as well as the use of this option by people staying in non-private dwellings, travelling, or in hard to reach locations.

New data items

Decorative banner.

Two new topics were added to the 2021 Census: Long-term health conditions and Australian Defence Force service. Their results generally aligned with the expectations from independent data sources, where available. The Panel observed that Census rates for mental health conditions were lower than expected compared with the 2017-18 National Health Survey, and rates of cancer were higher. The Panel concluded that more comprehensive and definitive data sources may be the best source of information for these items, with the Census advantage lying in data for small geographic areas and detailed cross-classification with other demographic characteristics. The item on Australian Defence Force service is also meeting a gap in veteran statistics. The Panel notes that ABS quality assessments and further evaluation are particularly important for interpreting and understanding these new data items.

Opportunities for future Censuses

Decorative banner.

In reviewing the 2021 Census data, the Panel identified some opportunities for future censuses that the ABS should consider:

  1. There have been improvements to the Address Register’s maintenance and quality assurance procedures between the 2016 and 2021 Censuses. Continual improvements should be an ongoing focus, with a particular focus on missing dwellings. Results from the Census and Post Enumeration Survey should be reviewed for insights into any systemic gaps in the Address Register.
  2. Response rates have improved overall for the 2021 Census, but there was a decline in some regional and remote areas of Australia. The Panel acknowledges that there may be logistical issues in conducting a census in regional and remote areas, particularly under pandemic conditions, and encourages the ABS to identify opportunities for improving response in these areas, many of which have had enumeration difficulties in previous censuses. Innovations in enumeration methods should be considered.
  3. The ABS has made substantial investment over recent censuses in improving the count of Aboriginal and Torres Strait Islander peoples. However, the Post Enumeration Survey continues to show a high undercount for this population group. The Panel strongly encourages the ABS to review and investigate this issue with an emphasis on innovative solutions. In particular, the Panel considers that serious consideration should be given to the use of reliable administrative data to address missing responses to the question on Aboriginal and Torres Strait Islander origins. Any such change would need to be undertaken in partnership with Aboriginal and Torres Strait Islander peoples.
  4. The Panel was pleased to note data quality improvements resulting from enhancements to occupancy determination and imputation for non-responding households, most notably as a result of the use of administrative data. ABS should continue to refine and enhance these processes. There have been notable improvements in reducing missing people within dwellings, and options could be investigated to further use administrative data to impute for other missing persons.
  5. Similarly, occupancy determination was improved by the use of administrative data for non-responding households. The 2021 Census used electricity data in limited ways following the 2021 Census Administrative Data Privacy Impact Assessment. Further in-depth analysis of the level of improvement to census data from the use of electricity data at the household level should be undertaken, with a view to increasing its use in the 2026 Census. The Panel notes that this would be subject to a new privacy assessment based on the 2021 Census experience.
  6. Innovative options introduced to the 2021 Census to enhance user experience and encourage response, such as the No-Census Number option, should be further developed for the 2026 Census.
  7. Prior to the commencement of the consultation process on content for the 2026 Census, the ABS should carefully evaluate the two new topics, being Australian Defence Force service and Long-term health conditions, to inform the value of their continued inclusion in the 2026 Census.
  8. The Statistical Independent Assurance Panel should be continued for future censuses to provide greater transparency, accountability and assurance.

Appendices

An independent view of the quality of statistical outputs from the 2021 Census of Population and Housing

Released
28/06/2022

Appendix A Observations from the 2016 Report – what was implemented and how

An independent view of the quality of statistical outputs from the 2021 Census of Population and Housing

Released
28/06/2022

Overview

Decorative banner

In reviewing the 2016 Census data, the 2016 Census Independent Assurance Panel identified some opportunities for the ABS to consider in order to enhance future Censuses, as follows:

  1. The change in collection approach led to challenges in the determination of whether dwellings were occupied on Census night, which impacts on the number of people that are imputed and the overall Census response rate. The ABS should consider new approaches to improve the accuracy of occupancy determination in future Censuses. This could involve administrative data sources or a special survey of non-responding dwellings as is done in Canada.
  2. The results of the Post Enumeration Survey indicated that the Census person imputation can be improved. The ABS should consider new approaches to person imputation for future Censuses, including post Census adjustments based on the Post Enumeration Survey down to small area geographies.
  3. The use of the Address Register likely led to the increase in the number of dwellings that have no information for their structure type, as well as a decrease in the proportion of dwellings classified as flats and apartments attached to houses. While the proportion of the overall dwelling stock that these issues affect is small, improved field procedures or access to administrative files could lessen the impact of this in future Censuses.
  4. The 2016 Census results for Aboriginal and Torres Strait Islander peoples are comparable to those from the 2011 Census, although the coverage of these populations remains lower than that of the general population. Given the importance of producing representative information about Aboriginal and Torres Strait Islander peoples, the ABS should consider ways of improving the coverage of these populations ahead of future Censuses, in consultation with Aboriginal and Torres Strait Islander communities.
  5. Even though their contribution to the overall population is small, the lower response rate for non-private dwellings has had some effect on quality. Methods for improving the response rate and/or the accuracy of identifying the number of non-responding persons in non-private dwellings for whom imputation is necessary should be investigated.
  6. Given the decline in the reporting of date of birth and the reduced proportion of people choosing to have their form retained by the National Archives, the ABS should consider how it can best respond to privacy concerns for future Censuses and provide appropriate assurances to the public. In particular, the ABS should consider sourcing an external Privacy Impact Assessment for future Censuses.
  7. The establishment of an Independent Assurance Panel to review the quality of Census data provides greater transparency and accountability. The establishment of such a Panel should be repeated for future Censuses to provide additional assurance on the quality of the valuable national resource that is the Australian Census. If this measure is pursued for future Censuses, the ABS should have regard to the timeframe for completion of this work, noting the limitations associated with delivering a report coincident with the release of the Census data.

The extent to which these opportunities were addressed in the design of the 2021 Census and enacted during operations is summarised below.

A.1 New approaches to improve the accuracy of occupancy determination

Decorative banner

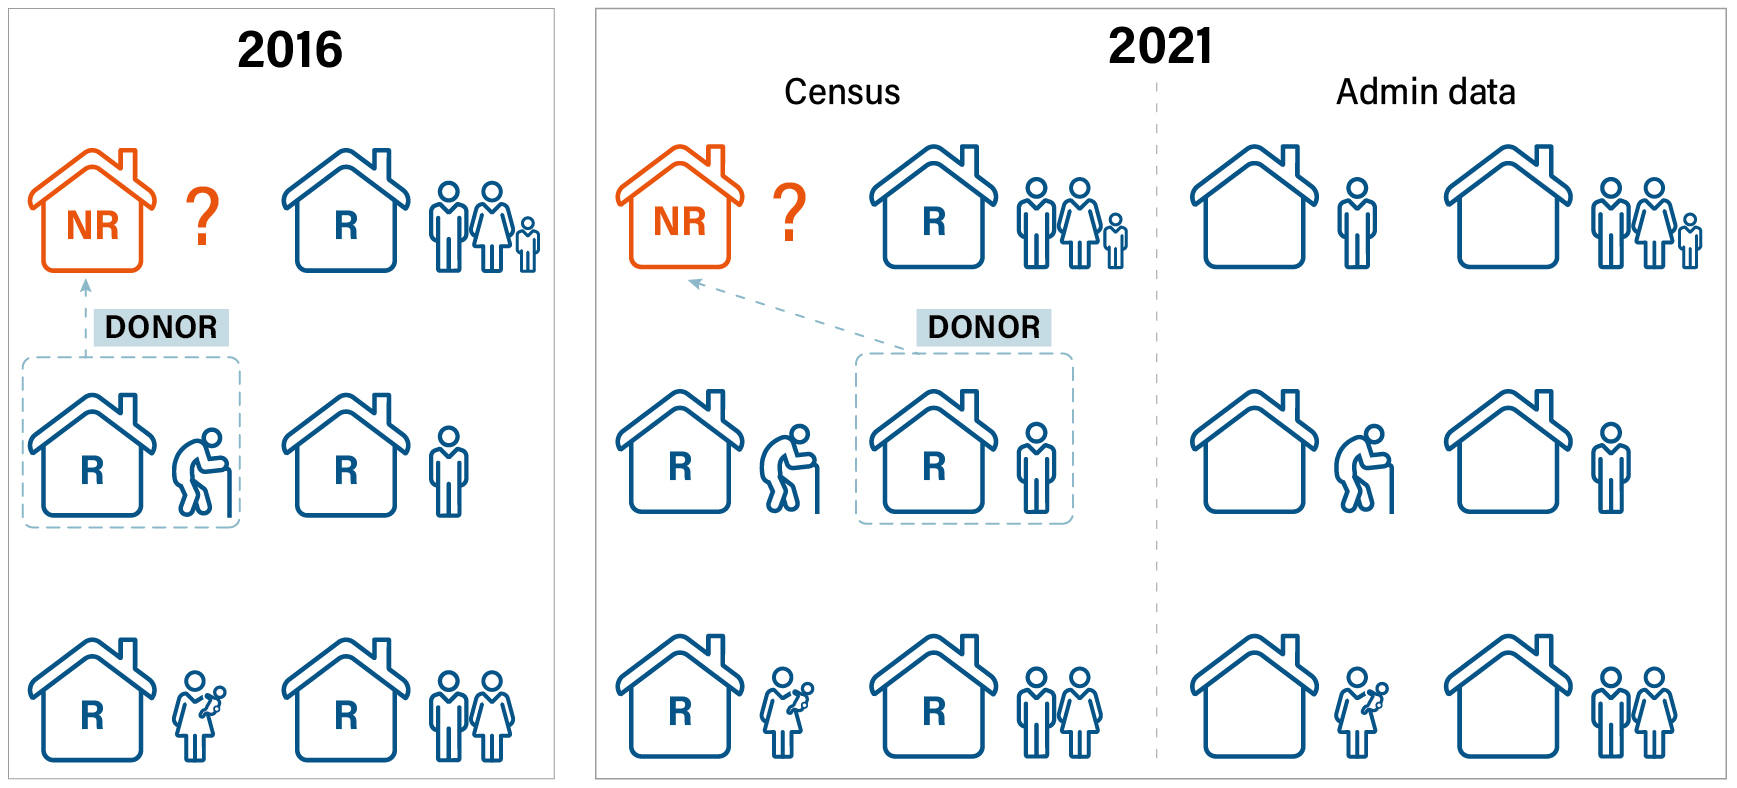
Historically, the occupancy of a dwelling in censuses was largely determined by field observation, including contact with the householder or neighbours. Occupancy was also determined when householders directly phoned the Census Contact Centre.

While occupancy rates in the 2016 Census were consistent with previous Censuses, the 2016 Post Enumeration Survey indicated that a proportion of dwellings were incorrectly deemed as occupied on Census night and therefore that the 2016 occupancy rates were over-stated. The 2016 Census Independent Assurance Panel highlighted the opportunity to improve the accuracy of occupancy determination.

New approaches implemented in the 2021 Census include:

  • In 2021, householders could use the Census Digital Service to advise that a dwelling was unoccupied on Census night. There were two ways of doing this. First, through the online Census form in which householders who entered ‘0’ persons present were streamed out of the form to report the dwelling as unoccupied. This pathway was called the ‘zero stream’. A second method was to use a new self-service option on the Census website that allowed respondents to advise they were away on Census night.
  • In addition, the 2021 Census used a probability model to create an indicator of occupancy. The model used administrative data and was applied to dwellings where insufficient information was obtained in the field to definitively determine if the dwelling was unoccupied. This process was applied as part of data processing.

More information about these approaches is published on the ABS website.[1]


[1] See Australian Bureau of Statistics (2020). Assessing administrative data to enhance the 2021 Census. Available at https://www.abs.gov.au/statistics/research/assessing-administrative-data-quality-enhance-2021-census

A.2 New approaches to person imputation, including post-Census adjustments based on the Post Enumeration Survey down to small area geographies

Decorative banner

The 2016 Census dwelling imputation method was a standard nearest neighbour ‘hot-decking’ approach, which imputed people into non-responding dwellings by finding a similar dwelling, called a donor, from the responding population by matching on (limited) known information. While the method improved the overall Census counts, the 2016 Post Enumeration Survey indicated that there was some ‘age skewing’ of the imputed population, with older persons over-represented.

In response to this recommendation, the ABS used administrative data to improve the ‘hot-decking’ approach so that it chooses the donor based on similar administrative data characteristics (see Figure A.1). Based on simulations using 2016 Census data, this approach reduced the over-representation of older persons and thereby improved the overall age distribution of Census counts.

The recommendation to consider ‘post-Census’ adjustments at the small area level based on the Post Enumeration Survey was not pursued. Maintaining the current approach provides continuity of approach and data with previous Censuses.

Figure A.1 Nearest neighbour ‘hot-decking’ imputation

A picture to illustrate the hot-decking approach as described in the paragraph above and the description for this image.
The diagram illustrates how nearest neighbour ‘hot-decking’ imputation has been done in the 2016 and 2021 Censuses. For the 2016 Census, the image shows one orange non-responding house and five blue responding houses. There is an arrow connecting the non-responding house with an adjacent donor responding house. For the 2021 Census, there are two sets of houses, one for the Census and one for administrative data. The administrative data houses are all blue and all houses (including the Census non-responding house) have pictures representing their household characteristics. The Census houses show the orange non-responding house linked to a blue responding donor house with the same administrative data characteristics.

NR  Non-Responding

R  Responding

A.3 New approaches to field procedures and the possible use of administrative files to improve the Address Register information on dwelling structure

Decorative banner

With the move to a frame-based mail out model in 2016, field staff no longer visited every dwelling and dwelling structure data was not collected for every dwelling in the field. Instead, the 2016 Census relied on information sourced from the Address Register for mail out areas, supplemented by Census field information, where collected. At that point in time, dwelling structure data on the Address Register was largely populated by a large canvassing exercise undertaken in 2015.

The 2016 Census Independent Assurance Panel concluded that the use of the ABS Address Register likely led to the increase in the number of dwellings that did not have a structure type, as well as a decrease in the proportion of dwellings classified as flats and apartments attached to houses, noting that the proportion of dwellings affected was small.

Since the 2016 Census, dwelling structure information on the Address Register has been significantly improved through the following activities:

  • applying dwelling structure information from 2016 Census data to 9.6 million addresses;
  • using Building Approvals dwelling structure data for approximately one third of new dwellings and for updating existing semi-detached dwellings and low-rise apartment blocks;
  • updating the dwelling structure standard resulting in two main changes: firstly, improved clarity in the definition of separate and semi-detached dwellings and secondly, addition of a ‘9 or more storey’ classification;
  • developing an imputation model to assign dwelling structure when no other data is available (approximately 3.5% of residential addresses), ensuring that every residential address record on the 2021 Census frame has an assigned value for dwelling structure.

In addition to these measures on the Address Register, field staff collected dwelling structure for those dwellings visited. Where the dwelling has an imputed value, this was updated with field information.

The introduction of a new self-service option on the Census website that allowed users to complete their Census without the code and password delivered to their address, resulted in an increase in the number of dwellings without a dwelling structure. These dwellings were assigned an imputed dwelling structure where there was sufficient geographic location information for use in the imputation model.

A.4 Methods to improve the enumeration of Aboriginal and Torres Strait Islander peoples, explored in consultation with Aboriginal and Torres Strait Islander communities

Decorative banner

Although the 2016 Census results for Aboriginal and Torres Strait Islander peoples were comparable with the 2011 Census, the 2016 Census Independent Assurance Panel noted that the coverage of these populations remained much lower than that of the general population and that the ABS should consider ways of improving this coverage.

The ABS undertook user-centred research early in the design of the 2021 Census to understand drivers of participation by, and avenues for increasing response from, Aboriginal and Torres Strait Islander peoples. ABS built on this research through ongoing consultation with the ABS Round Table on Aboriginal and Torres Strait Islander Statistics. Through this work the ABS developed and enacted a number of strategies to address this recommendation. The approach has included:

  • Greater investment in the dedicated engagement unit enabling early and ongoing engagement at all levels, from grass roots community organisations through to governance bodies. 
  • Employing locally and increasing the number of Aboriginal and Torres Strait Islander office and field staff, including having designated positions in Remote Area Teams and Census Engagement Managers working with communities. To achieve this, ABS had a dedicated recruitment team that included Aboriginal and Torres Strait Islander staff.
  • Engagement of a specialist Aboriginal and Torres Strait Islander agency to help the ABS deliver culturally appropriate communication. This included tailored campaign materials, radio advertising in 19 languages, and media placement in Aboriginal and Torres Strait Islander press, radio, and television. The Census Program appointed 21 Aboriginal and Torres Strait Islander media spokespeople from within the ABS and worked closely with Aboriginal and Torres Strait Islander media organisations. A suite of information material was developed to support oral, written and visual communication, and shared this with stakeholders through engagement teams.
  • Partnerships with community organisations to create culturally safe locations for assistance in form completion. Unfortunately, this measure had to be scaled back or cancelled in New South Wales and Victoria due to the COVID-19 outbreak.
  • Improvements to Census forms that include ‘Aboriginal’ and ‘Torres Strait Islander’ as listed ancestries, and changes to increase reporting of Aboriginal and Torres Strait Islander languages.
  • Testing online and paper forms with Aboriginal and Torres Strait Islander peoples. Testing occurred in focus groups and through ongoing consultation with the Round Table on Aboriginal and Torres Strait Islander Statistics.

In addition to the above, one of the most significant improvements was the digitisation of field operations for remote areas. This involved remote teams using a mobile app instead of paper record books and accessing near real time operational intelligence. For the first time, staff managing remote operations were able to review all dwelling and person counts in near real time.

The ABS has also researched statistical methods to reduce the undercount of Aboriginal and Torres Strait Islander peoples in the Census. Two options were developed. The first was to extend existing hot-deck dwelling imputation to include Indigenous status in addition to Age, Sex and Marital status. This research was presented to a wide range of external stakeholders, with feedback that there was merit in the approach to reduce undercount, but there were strong reservations about imputing Indigenous status. Based on this feedback Indigenous status was not included in 2021 Census hot-deck dwelling imputation. A second option was later developed as a potential contingency for low response. This involved using administrative data records for people not responding to the Census and showed further improvements to the undercount. While this latter measure was not needed for the 2021 Census, the ABS will continue this research to show potential improvements for future Censuses.

A.5 Methods to improve the response rate and/or the accuracy of identifying the number of non-responding persons in non-private dwellings for whom imputation is necessary

Decorative banner

The 2016 Census Independent Assurance Panel noted that although the overall population in non-private dwellings was relatively small, the lower response rates in these dwellings had some effect on quality. Specifically, the Panel recommended improving the measure of actual occupancy in these dwellings on Census night and therefore the number of non-responding persons that should be imputed.

In 2021, field processes and systems were improved to more accurately capture the occupancy of each non-private dwelling on Census night. In addition, persons staying in non-private dwellings were also able to complete their Census through the self-service option on the Census website that allowed users to complete their Census without a code and password.

Despite these measures, the 2021 Census experienced challenges in monitoring the progress and quality of enumeration in non-private dwellings during field operations. The COVID-19 lockdowns and travel restrictions reduced travellers in many areas and resulted in lower levels of occupancy than expected.

Furthermore, COVID-19 impacted a number of specific dwellings, notably hospitals and aged care providers, which were experiencing extreme staffing restrictions and pressures. In these circumstances, a reduced set of information was collected from these dwellings.

A.6 How best to respond to privacy concerns and provide assurances to the public, in particular considering the sourcing of an external Privacy Impact Assessment

Decorative banner

The 2016 Census Independent Assurance Panel noted a decline in the reporting of date of birth and the reduced proportion of people choosing to have their form retained by the National Archives. They identified an opportunity for the ABS to consider how best to respond to privacy concerns about the Census and provide appropriate assurances to the public. It was also suggested that the ABS consider sourcing an external Privacy Impact Assessment for future Censuses.

As in previous Censuses, the 2021 Census had a strong emphasis on maintaining the privacy and security of Census data. The ABS has undertaken extensive stakeholder engagement, gained external privacy advice and assurance (including a whole-of-Census Privacy Impact Assessment), and implemented a strong risk management program.

In line with the ABS’s commitment to privacy and maintaining public trust, the 2021 Census Program undertook two independent PIAs, consulting with a range of stakeholders, including privacy regulators, researchers and civil society advocates:

  • The ABS commissioned Galexia Pty Ltd to conduct the 2021 Census Privacy Impact Assessment. This assessment focused on potential privacy risks and issues associated with personal information collected by the ABS. All recommendations were accepted except for the recommendation to exclude the Long-term health conditions question from the Census Time Capsule – the repository of forms that respondents have agreed can be kept by the National Archives and be accessed in 100 years.
  • A separate Privacy Impact Assessment was conducted on 2021 Census Administrative Data, by Information Integrity Solutions Pty Ltd. This assessment looked at how the potential use of administrative data could affect privacy. That is, using information collected by other government agencies, businesses or other organisations to support the Census. The ABS agreed with all the recommendations from this assessment.

The results of the Privacy Impact Assessments[1], as well as other privacy material has been published on the ABS website throughout the Census development period and during operations. This included the 2021 Census Privacy Statement[2] and collection notices, which provide clear information on how the ABS collects, stores and deletes personal information. The ABS also published articles explaining the use of administrative data in the Census.


[1] Australian Bureau of Statistics (2021) Privacy Impact Assessments: 2021 Census of Population and Housing. Available at https://www.abs.gov.au/about/legislation-and-policy/privacy/privacy-impact-assessments

[2] Australian Bureau of Statistics. 2021 Census Privacy Statement. Available at https://www.abs.gov.au/about/legislation-and-policy/privacy/privacy-abs/2021-census-privacy-statement

A.7 Continuing the practice of an Independent Assurance Panel

Decorative banner

This recommendation was readily accepted by the ABS and the 2021 Census Statistical Independent Assurance Panel was established with similar Terms of Reference to the 2016 Panel and has concluded with the publication of this report.

Appendix B The Census, Post Enumeration Survey, and the Estimated Resident Population

An independent view of the quality of statistical outputs from the 2021 Census of Population and Housing

Released
28/06/2022

Overview

Decorative banner

The ABS produces a range of collections related to population statistics: the Census, the Census Post Enumeration Survey, and the Estimated Resident Population.

It is important to note that the following description of these collections is drawn from pre-existing ABS documents and the Report on the Quality of 2016 Census data. Therefore, the text that follows is either taken directly from those documents or informed by them.

B.0.1 The Census of Population and Housing

The ABS conducts a Census of Population and Housing every five years as required by the Census and Statistics Act 1905.[1] Regularly taking a census provides a comprehensive snapshot of the nation and enables the updating and maintenance of an accurate time series of Australia’s official population estimates.

The Census counts everyone based on where they were on Census night (place of enumeration) and asks about their place of usual residence. The Census also collects data on a broad range of personal, family, and dwelling topics including Ancestry, Country of birth, Income, Language used at home, Marital status, Family size, Occupation, and Dwelling type.


[1] Census and Statistics Act: Census and Statistics Act 1905 (Cth)

B.0.2 Post Enumeration Survey

No matter how much care is taken in the preparation of the Census, there will be some people who are not counted (undercount) or those that are counted more than once (overcount). For the reasons explained below, it is important to quantify the undercount and overcount. For countries without population registers, the recommended method is to conduct a Post Enumeration Survey following as soon as possible after the Census[1]. The ABS has been conducting a Post Enumeration Survey since 1966.

The Post Enumeration Survey is a sample survey of approximately 50,000 dwellings, conducted soon after the completion of the Census enumeration period. The Post Enumeration Survey checks if a person should have been counted on Census night, by asking for their Census night location. The Post Enumeration Survey also determines if they were counted; and if so, how many times they were counted. This is done by directly linking Post Enumeration Survey persons and dwellings to their matching Census forms. The difference provides the ABS with a net overcount or net undercount, which is then applied as part of the five yearly Estimated Resident Population rebasing exercise (discussed at Section B.2, below). A diagrammatic presentation is provided below in Figure B.1.

The Post Enumeration Survey therefore provides:

  • a critical component to Census rebasing of the Estimated Resident Population;
  • an independent measure of the accuracy and coverage of the Census counts; and
  • assistance in identifying improvements for future censuses.


[1]   See United Nations (2017). ‘Census Recommendation to support demographic analysis’, in Principles and Recommendations for Population and Housing Censuses, Revision 3.  Available at https://unstats.un.org/unsd/demographic-social/Standards-and-Methods/files/Principles_and_Recommendations/Population-and-Housing-Censuses/Series_M67rev3-E.pdf

Figure B.1 Estimating the population using the Census and the Post Enumeration Survey

A diagram illustrating how the Census and the Post Enumeration Survey are used to provide estimates of Australia's population as described in the paragraphs above and the description for this image.
This image is a diagram of how the population is estimated using the Census and the Post Enumeration Survey. The first main box is: Census finds most but not all persons in the Australian population. A side box feeds into the main box: Undercount is the persons missed in the Census. The second main box is: The Post Enumeration Survey mostly finds the same people that Census finds, but…. There are three side boxes feeding into this second main box: 1. The Post Enumeration Survey finds some people that the Census didn’t; 2. The Census finds some people that the Post Enumeration Survey didn’t; and 3. Some are not found by the Post Enumeration Survey or by the Census. The third main box is: It’s okay for the Census and the Post Enumeration Survey not to find everyone, as long as the chance is independent. Three side boxes feed into this third main box: Suppose the Census doesn’t find 3 per cent…; And suppose the Post Enumeration Survey doesn’t find 4 per cent…; … then we estimate that 3 per cent of 4 per cent (or 0.12 per cent) were not found by either the Census or the Post Enumeration Survey.

B.0.3 Estimated Resident Population

The official estimate of Australia’s population is the Estimated Resident Population (often referred to as ERP). It provides the number of usual residents in a geographic area, by age and sex. In the Census, a person is counted as a usual resident if they usually live in Australia or if they usually live in another country but are resident in Australia for one year or more. In the context of overseas migration, a person is determined to be a usual resident if they spend at least 12 out of 16 months in Australia.

Estimated Resident Population statistics are used to inform evidence-based decisions such as allocating funds to the states and territories and allocating the number of seats for the House of Representatives between the states and territories. More recently, the Estimated Resident Population has been used as the denominator in calculating COVID-19 vaccination rates.

The Estimated Resident Population at the national and state/territory level is prepared quarterly and is based on data from the latest Census (adjusted for the Post Enumeration Survey), to which components of natural increase and decrease (births and deaths) and migration (internal and overseas) are added. Data for these components are from government administrative sources

B.1 How the Post Enumeration Survey is used to assess the quality of the Census

Decorative banner

B.1.1 Assessment of Census coverage – overcount and undercount

The Post Enumeration Survey provides an assessment of Census coverage, or how successful the Census was in counting the total Australian population. This assessment is determined in terms of overcount and undercount.

Some of the reasons why people are counted more than once or counted in error (i.e. overcounted) include:

  • they were included on the Census form at the dwelling where they usually live, even though they stayed and were counted elsewhere on Census night; and
  • they were overseas on Census night and so should not have been counted at all, but were included on the Census form at the dwelling where they usually live.

Some of the reasons why people may be missed (i.e. undercounted) include:

  • they were travelling and were difficult to contact;
  • they mistakenly thought they were counted elsewhere;
  • the person completing the form thought that, for example, young babies, the elderly or visitors should not be included;
  • they did not wish to participate;
  • the dwelling in which they were located was missed because it was difficult to find (e.g. in a remote or non-residential area); and
  • the dwelling in which they were located was mistakenly determined to be unoccupied.

Rates of overcount and undercount can also vary significantly for different population groups depending on factors such as sex, age, ethnicity, Aboriginal and Torres Strait Islander origins, and geographic location.

B.1.2   Occupancy and an assessment of Census imputation

The Post Enumeration Survey also provides an assessment of the total number of persons present in dwellings where Census have imputed persons. Imputation is the process that attempts to fill in basic information for the people who didn’t respond to the Census. Currently, this information is a person’s age, sex, usual residence and marital status. For these dwellings, the Post Enumeration Survey makes an entirely independent assessment of the number of persons who usually reside in these dwellings, based on the subset of sampled dwellings that match to Census dwellings where imputation has occurred. The net overcount for persons imputed[1] is derived by subtracting the Post Enumeration Survey estimate from the total of Census imputed persons. If Census under imputes persons, then the result is a net undercount for persons imputed.

Because the Post Enumeration Survey cannot directly associate person records with Census imputed persons, there is no precise way to break down the components of overcount and undercount. Approximate comparisons can be made by examining the characteristics and occupancy of Post Enumeration Survey dwellings that match to Census dwellings where imputation has occurred.

Some of the reasons why Census may over or under impute include:

  • private dwellings were incorrectly identified as occupied on Census night (leading to over-imputation);
  • private dwellings were correctly identified as occupied on Census night, but too many or too few persons were imputed;
  • non-private dwellings had too many or too few persons imputed.

Rates of over-imputation can also vary significantly for different population groups depending on factors such as sex, age, ethnicity, Aboriginal and Torres Strait Islander origins, and geographic location.


[1] For technical reasons, the Post Enumeration Survey groups dwellings where Census has imputed people together with dwellings where a Census form was received after the start of the Post Enumeration Survey collection (‘Late Returns’) and people who provided insufficient personal identifier information on their Census form, as these groups all require the Post Enumeration Survey to make an independent estimate of the true population. However, the size of net overcount for imputed people is much larger than the undercount or overcount from the other components, so the net overcount for this group can safely be interpreted as over-imputation.

B.1.3 Assessment of Census data quality

The Post Enumeration Survey provides information on overcount and undercount for the following variables, and as such, provides an indication of their quality:

  • Geography (national, state and/or territory, and part of state and/or territory);
  • Age;
  • Sex;
  • Marital status;
  • Country of birth; and
  • Indigenous status.

Note that ‘not-stated’ or missing values for Country of birth and Indigenous status are not imputed in the Census. Those persons who have a value of ‘not-stated’ against either of these two items contribute to net undercount estimates for the category in which they should have been counted, as reported in the Post Enumeration Survey.

B.2 How the Census and Post Enumeration Survey combine to produce Estimated Resident Population

Decorative banner

After every census, the Estimated Resident Population is recalibrated, or rebased. Rebasing is done by adding the net overcount or net undercount from the Post Enumeration Survey to the new Census population counts. The result is adjusted further to include Australian residents who were temporarily overseas on Census night (identified from passenger traveller records). The final step in calculating Estimated Resident Population is to backdate to 30 June of the Census year. This small adjustment is undertaken by adding the deaths and subtracting the births and net overseas migration which occurred between 1 July and the Census date. The diagram below (Figure B.2) outlines the Estimated Resident Population rebasing calculations and adjustments.

As part of the population estimates rebasing exercise, the Post Enumeration Survey adjusted age and sex distributions are compared with independent population data sources, including administrative data sources such as the Multi-Agency Data Integration Project (MADIP) and published estimated resident population which has been updated quarterly from the previous Census. Where the Post Enumeration Survey cannot provide or does not result in plausible undercount adjustments for population sub-groups, demographic adjustments can be applied for the rebased estimates based on these other data sources.

Figure B.2 Using the Census and the Post Enumeration Survey to rebase the Estimated Resident Population

A diagram illustrating how the Census and the Post Enumeration Survey are used to rebase the Estimated Resident Population as described in the paragraph above and the description for this image.
This image shows how the Census and the Post Enumeration Survey are used to rebase the Estimated Resident Population. The first section is labelled Moving people back home, and has an arrow from Census count, place of enumeration, to Census count, place of usual residence. There are also boxes to add residents absent interstate, subtract interstate visitors and subtract overseas visitors. The second section is labelled Including people who have been missed, and has an arrow from Census counts, place of usual residence, to Estimated Resident Population as at Census night. There are also boxes to plus or minus net Post Enumeration Survey adjustment, plus or minus net demographic adjustment and add residents temporarily overseas. The third section is labelled Backdating from Census night, and has an arrow from Estimated Resident Population as at Census night, to Census based Estimated Resident Population as at 30 June, Census year. There are also boxes to subtract births, add deaths, plus or minus net adjustment for interstate migration and plus or minus net adjustment for overseas migration.

B.3 Limitations of the Post Enumeration Survey

Decorative banner

The reliability of the Post Enumeration Survey affects the extent to which estimates can be used to accurately assess the quality of the Census. As a result, it is important to understand the quality of the Post Enumeration Survey itself and the factors that may limit its usefulness as a measure. The conceptual framework for population estimates is described in Appendix C. The key sources of error in the Post Enumeration Survey are outlined below.

B.3.1 Sampling error

Sampling error is random error resulting in either an underestimate or an overestimate because the Post Enumeration Survey is a sample survey.

The Post Enumeration Survey has relatively low sampling errors at the national level due to a large sample, but the relative sampling errors will be higher for estimates for lower level geographies.

The final Margins of Error on the Post Enumeration Survey estimates is reported in the Post Enumeration Survey publication.

B.3.2 Correlation and non-response bias

Correlation bias is systematic error that results in an underestimate when Census and the Post Enumeration Survey tend to miss the same people. The Post Enumeration Survey relies on statistical independence to accurately adjust for Census undercount and/or overcount. If population groups are systematically missing from both the Post Enumeration Survey and the Census, correlation bias occurs, which can lead to an underestimate of the population.

The potential to miss the same population groups increased somewhat in 2021 because the same address framework was used for both collections. To minimise this, the steps described in Section B4.1 below were taken.

Correlation bias is partially treated by fitting mathematical models to account for the drivers of Census and Post Enumeration Survey non-response in estimation, such as age characteristics. This has been shown to be effective in reducing correlation bias, although some residual bias will remain. A detailed description of the prediction regression estimator used in the Post Enumeration Survey can be found in Research Paper: An Estimating Equation Approach to Census Coverage Adjustment, May 2007.[1] Treatment for correlation bias in 2021 is detailed in Appendix C.

There is also a risk of non-response bias when selected persons respond to the Census but do not respond to the Post Enumeration Survey.

Non-response bias occurs when the people who do not respond to the Post Enumeration Survey have different characteristics to those who do respond. This risk is greater if the characteristics of the non-respondents vary significantly from respondents, especially in their propensity to complete the Census. Non-response bias is treated through the Prediction Regression Estimation model referred to above.


[1] Research Paper: Bell, P. A., Clarke, C. F., Whiting, J. P. (2007). An Estimating Equation Approach to Census Coverage Adjustment. Canberra, Australia: The Australian Bureau of Statistics. Available at https://www.abs.gov.au/ausstats/abs@.nsf/mf/1351.0.55.019

B.3.3 Bias due to missed links

Systematic error resulting in an overestimate occurs when the Census and the Post Enumeration Survey find the same people but fail to match them, leading to those people being treated as missing from the Census. The Post Enumeration Survey relies on linking to Census to establish which persons in the Post Enumeration Survey were counted in Census and which were not.

If a person is counted in both the Post Enumeration Survey and the Census, but the link between them is missed, the Post Enumeration Survey mistakenly reports that they are missing from the Census. This can lead to an overestimate of the number in the population.

This bias is predominantly treated through a high level of scrutiny and quality assurance attached to the linking and matches processes in the Post Enumeration Survey.

In 2016, a quality adjustment was introduced to identify and treat Census records that had insufficient personal identifier information, which is required for linking to the Post Enumeration Survey. These records were moved to the Census non-contact sector (comprising dwellings deemed to be occupied on Census night, from which no Census form was received; or a Census form that was received after the Post Enumeration Survey commenced data collection) and treated in a similar fashion to late returns, to remove the potential for any upward bias on the population estimates produced by the Post Enumeration Survey. In 2021, this concept has been extended to Post Enumeration Survey records.

B.3.4 Recall error

This occurs if the Post Enumeration Survey respondents do not accurately recall where they were enumerated on Census night.

As in 2016, the 2021 Post Enumeration Survey was completed later than previous Post Enumeration Surveys increasing the possibility of recall error.

Recall error is managed in the Post Enumeration Survey processing by using an automated linking program which enables a wider range of possible addresses (including vague addresses) to be searched in the matching process.

B.3.5 Scope

The Post Enumeration Survey is a household survey. Therefore, its scope is limited to private dwellings and it is unable to detect any change in the level of undercount or overcount in non-private dwellings.

B.4 Key changes to the 2021 Post Enumeration Survey

Decorative banner

The 2021 Post Enumeration Survey had a new public facing name: the Post Census Review. The name was introduced to better reflect the survey and its purpose in plain language, and was selected after qualitative testing via cognitive interviewing.

B.4.1 Sample

The 2021 Post Enumeration Survey sample was increased from 2016 to maintain similar levels of accuracy while accounting for population growth. Final sample design aimed to achieve 44,359 fully responding households. Sample stratification was applied to increase the expected sample of Aboriginal and Torres Strait Islander peoples. Stratification is commonly used in household surveys to increase the sample size of subpopulations of interest and improve the accuracy of estimates of subpopulations of interest.

B.4.2 Use of the Address Register

For the 2021 Post Enumeration Survey an Address Register based frame was used, consistent with the move of all ABS household surveys to this frame. As the Address Register is also used by the Census, independent quality assurance of the frame was undertaken through an address canvassing exercise. The purpose of the exercise was to maximise the chance that any dwellings missing or misrepresented on the Address Register were identified and had a chance of selection in the Post Enumeration Survey regardless of whether they were counted in the Census.

B.4.3 Enumeration model

B.4.3.1       Telephone-first model

A telephone-first enumeration model was implemented in the 2021 Post Enumeration Survey to alleviate the increasing pressure on field interviewer resources and optimise response across the sample. Maximising self-initiated telephone interview response frees up resources to enable field interviewers to focus on areas of low response. The aim of this model was to achieve around fifty to sixty per cent telephone interview uptake across the whole sample. This was exceeded with 87% of Post Enumeration Survey response achieved through telephone interview.

The ABS sent a letter and flyer informing households of their selection in the survey, explaining its purpose, and asking them to phone in and complete the survey. The ABS built on their ongoing research program into approach materials to develop and test a letter specifically to maximise this telephone take up. The letter contained design features including a prominent and simple “call to action” and supporting information designed to reduce barriers to participation.

B.4.3.2       Aboriginal and Torres Strait Islander Community enumeration

Enumeration of Aboriginal and Torres Strait Islander Communities remained as in-person interviews. For 2021, the model teamed an ABS Centre of Aboriginal and Torres Strait Islander Statistics engagement manager with a Household Survey Interviewer. The model aimed to harness the knowledge and expertise of each to bring greater understanding in Communities around the purpose of the survey while ensuring activities had minimal impact to members of the Community.

B.4.4 Processing and outputs

B.4.4.1       Providing further detail on coverage in Post Enumeration Survey outputs

The 2021 Post Enumeration Survey outputs will be published on the new ABS website, requiring new styles and formatting. Alongside this, the outputs will contain greater component analysis and disaggregation.

Following the 2016 Post Enumeration Survey, including engagement with the 2016 Census Independent Assurance Panel, a proposed new additional measure of coverage has been developed in addition to the standard outputs such as gross undercount, gross overcount and net undercount. The new measure is “Gross Coverage Error” and is the difference between the Post Enumeration Survey population estimate and the Census count (with gross overcount and imputed persons removed).

Conceptually, Gross Coverage identifies the population that the Census counted (or received a form for) as a proportion of the population that the Census should have counted. Gross coverage error is the difference between the Post Enumeration Survey population estimate and the gross coverage estimate. This differs from the typical net undercount headline figure produced from the Post Enumeration Survey, which subtracts overcount from undercount.

Gross Coverage will also be calculated for the 2016 Post Enumeration Survey to enable comparison with 2021 results. This is of particular note given the changes made to the Census imputation model, which mean that measures such as this are needed to make meaningful comparison over time.

Similar gross measures of coverage are published by the United Nations and Statistics New Zealand. Net undercount will continue to be reported as the headline measure in the Post Enumeration Survey publication in keeping with international practice.

Appendix C Accuracy of the Census and the Post Enumeration Survey

An independent view of the quality of statistical outputs from the 2021 Census of Population and Housing

Released
28/06/2022

Overview

Decorative banner

This Appendix provides an outline of an accuracy framework the Panel created to assist in its assessment of the accuracy of the Census and the Post Enumeration Survey. Furthermore, it provides an assessment of the accuracy of the Census and the Post Enumeration Survey according to this framework in Sections C.3 and C.4.

C.1 Census accuracy framework

Decorative banner

The first component of the accuracy framework focuses on the quality of the Census data and identifies four main groups of potential errors that can impact on quality. These are:

1. Non-response

Non-response error occurs when people refuse to participate in the Census or do not return their Census forms in time for their data to be processed. Key considerations for this error type are:

  • The distribution of non-response. If particular sub-populations such as young males are more likely than others to non-respond, then the data may not be representative of the entire population. The impact can be reduced by the imputation of persons in non-responding occupied dwellings, depending on the accuracy of the imputation process.
  • The accuracy of the imputation process determines how well non-response bias is mitigated. Imputation refers to the process whereby missing or erroneous responses are inferred from likely or appropriate information. An important aspect is the determination of whether non-responding dwellings were occupied on Census night or not. This applies to both private and non-private dwellings.
  • Item non-response. Some items are not completed on the Census form, either accidentally or deliberately. As forms are processed, these are coded as ‘not stated’ and will have impacts on the quality of the Census data if the item non-response rate is high. Also, for imputed persons, there will be item non-response for all items except for Age, Sex, Marital status, and Place of usual residence, which are imputed. This will add to the effective item non-response rate.

2. Coverage

After adjusting for non-response, coverage error in the Census is the difference between the number of people and dwellings counted in the Census, compared to the actual number of people and dwellings in Australia on Census night. Coverage error can be due to overcoverage or undercoverage:

  • Overcoverage of dwellings can occur when dwellings are listed or counted more than once, or out of scope dwellings (e.g. unoccupied temporary dwellings such as cabins, caravans and tents) are mistakenly included. Overcoverage of persons may occur when people are counted more than once, or when forms for people who do not exist or are outside Australia on Census night are submitted.
  • Undercoverage of dwellings can occur when dwellings are missed from the count (e.g. not listed on the Address Register) or are mistakenly considered out of scope. Undercoverage of persons can occur when the Census misses people from the count, which can be due to their dwelling where they were on Census night being missed, or because they did not respond and were not correctly identified as a non-respondent.

3. Measurement

Measurement error is the difference between what the Census questions are trying to measure and the responses people give to them. Difference can occur due to the way people interpret questions. As the questions and interpretations change over time, this can lead to challenges comparing historical series. Key considerations for this error type are:

  • comparability over time;
  • consistency with external data sources; and
  • internal consistency within the Census data set.

4. Processing

Processing error encompasses all errors introduced in processing the data after collection is complete. Two key types of processing errors are:

  • coding errors, which occur when a response is incorrectly coded (or misclassified) into the wrong category; and
  • imputation errors, which occur when imputed values do not accurately represent the true missing value.

There is a small possibility of some error during the data capture process due to misreading of the paper forms.

C.2 Population estimates accuracy framework

Decorative banner

The second component of the accuracy framework focuses on the accuracy of the Census data in its use in contributing to population estimates. This component looks at potential errors that may impact on the quality of population estimates from the Post Enumeration Survey and its interaction with the Census, and categorises them into six main groups:

1. Coverage

Coverage error in the Post Enumeration Survey is the difference between the population in scope for selection in the survey and the population that ideally should have been in scope. Dwellings and people could be missed due to deficiencies in the Address Register used for the survey or imperfect field procedures, leading to undercoverage.

2. Sampling

Sampling error is random error resulting in either an underestimate or an overestimate as the Post Enumeration Survey is a sample survey. Sampling errors will be relatively higher for the more detailed estimates.

3. Non-response

Non-response error for the Post Enumeration Survey occurs when people selected in the survey do not respond; this is either when correspondence requesting them to undertake the interview does not reach them (and a Field Interviewer is unable to make contact with them directly), or when people refuse to participate. Key considerations for this error type are also the distribution of non-response (i.e. representativeness of the achieved sample), and the level of item non-response.

4. Measurement

Similar to that for the Census, measurement error for population estimates is the difference between what the Census questions are trying to measure, and the responses people give to them. Of particular interest for population estimates is consistency between the way people respond to the Post Enumeration Survey and the Census.

5. Processing

Processing error encompasses all errors introduced in processing the data after the Post Enumeration Survey collection is complete. A key processing error is matching error, which occurs if processing does not correctly match persons counted in the Post Enumeration Survey sample to their corresponding record in the Census.

6. Model

Model error occurs when the underlying assumptions in the model used to estimate Census overcoverage and undercoverage are not valid. For example, the model makes assumptions of statistical independence within population sub-groups when the Post Enumeration Survey and the Census miss the same people (see Section C.4.3). This may not be a valid assumption in practice.

C.3 Assessment of the Census against the accuracy framework

Decorative banner

1. Coverage

Net overcount for persons imputed (where a dwelling was known to be occupied but no form was returned, or where a person was known to be staying in a non-private dwelling but no form was returned) is 2.1%, lower than 2.7% in 2016. This is a statistically significant decrease. The introduction of self-service options on the Census website made it easier for people to report if they would not be at home on Census night. In addition, an occupancy determination model was developed for 2021 which helped to more accurately determine whether a dwelling was occupied or unoccupied on Census night in the absence of reliable field information. Both innovations – combined with a less mobile population due to COVID-19 restrictions and more people being enumerated at home - have helped ameliorate the impact of restricted field activities due to the pandemic and have resulted in an improvement in data quality.

Net undercount for persons on Census forms in 2021 is 2.8%, nearly one percentage point lower than 2016 (3.7%). This is statistically significant. Gross undercount has reduced while gross overcount has remained stable. Gross undercount has decreased from 4.9% in 2016 to 4.0% driven largely by a reduction in people missed from returned Census forms. This may be due to a combination of factors including form improvements to clarify who should be included on the form, as well as the effect of COVID-19 related restrictions reducing mobility and of household members and transience of the population.

2. Non-response

Non-response increases the risk of bias toward characteristics of the responding population. The response rate for private dwellings is calculated as 96.1% in 2021 compared with 95.1% for 2016. Upon completion of the field phase, imputation (for persons that were not included on a Census form) is the main method for dealing with potential non-response bias. Its effectiveness for dealing with non-response bias depends on the accuracy of the imputation process. There are two aspects to imputation accuracy:

  1. determining which non-responding dwellings were occupied on Census night; and
  2. ensuring that the imputation process accurately reflects the age, sex and marital status characteristics of non-responding dwellings.

Following the 2016 Census, the Independent Assurance Panel recommended that these areas, namely the accuracy of occupancy determination and the representativeness of age imputation, be improved for the 2021 Census. Initial results from the 2021 Post Enumeration Survey indicate that there have been improvements in both areas in the 2021 Census.

Note: Excludes overseas visitors and Other Territories.

The Post Enumeration Survey provides a comparison of the number of people created through imputation and the number of people that should have been created. As in previous censuses, the ABS has created more people in 2021 than were missed. However, this has improved in the 2021 Census with over-imputation decreasing from 2.7% in 2016 to 2.1%.

Item non-response rates for the 2021 Census are lower than in 2016 and this is largely due to the lower number of imputed records where ‘not stated’ will be recorded for all Census variables except Age, Sex, Marital status and Usual residence. Excluding imputed records, item non-response rates in 2021 are also generally lower than in 2016 mainly due to the increased use of the online form.

See Section 3.3 for more information.

3. Measurement

For the variables examined, the Panel could not identify any significant new measurement errors by comparing 2021 and 2016 Census results. The Panel observed an increase in the number of persons reporting Aboriginal and Torres Strait Islander ancestries, and noted a higher rate of non-response for the Long-term health conditions question for people aged 15 years and under who responded on the Interviewer household form. This is thought to be due to the question’s placement on that type of form. See Sections 3.5 and 3.7 for further discussion of Census data items.

4. Processing

The Panel did not examine the accuracy of the coding process. However, the Panel observed there was an improvement in the imputation process in the 2021 Census.

C.4 Assessment of the Post Enumeration Survey against the accuracy framework

Decorative banner

1. Coverage

There has been no change in the target population of the Post Enumeration Survey in 2021 compared with 2016, which includes all private dwellings in Australia but excludes non-private dwellings. In 2021, a list based multi-stage sample was used based off the Address Register frame for the private dwelling sample. This is different to 2016, and earlier iterations, which used an area based multi-stage sample. The Aboriginal and Torres Strait Islander community sample continued to use an area based multi-stage sample. To ensure the Post Enumeration Survey measured coverage independently to the Census, a desktop address canvassing exercise was undertaken prior to enumeration which identified dwellings missed from the Address Register frame and added these to the Post Enumeration Survey sample.

2. Sampling

The sample size was increased from 2016 by around five per cent to account for population growth. Sampling error has decreased slightly overall due to the increase in Census response rates and the number of responding dwellings in the Post Enumeration Survey sample. Sampling errors are shown in Table C.1.

Table C.1 presents net undercount rates and standard errors for each state and territory. As can be seen, the level of variance in 2021 is comparable with 2016.

Table C.1 Net undercount rate, by state/territory of usual residence
 20212016
    % Standard error             % Standard error
New South Wales0.00.40.80.4
Victoria0.30.31.40.4
Queensland1.00.41.30.5
South Australia1.00.50.20.5
Western Australia3.00.60.40.6
Tasmania1.60.50.10.7
Northern Territory6.01.25.01.5
Australian Capital Territory-0.60.7-1.11.4
Australia 0.70.21.00.2

Notes: A negative value indicates a net overcount.

Excludes Other Territories and overseas visitors.

3. Non-response/correlated response bias

The total number of fully responding dwellings in the 2021 Post Enumeration Survey was 45,138. This represented a response rate of 89.3% for the general population sample (a decrease from 91.2% in 2016) and 91.6% for the Aboriginal and Torres Strait Islander Community sample (a decrease from 92.7% in 2016) (see Table C.2). This increase in non-response rate increases the risk of non-response bias and correlated response bias, in particular. This could lead to an underestimation of the population estimates but there is no evidence of this being an issue.

Table C.2 Response rates, by state and territory
 NSWVic.QldSAWATas.NTACTAust.
 %%%%%%%%%
2021
General population88.892.388.489.991.191.279.989.589.3
Aboriginal and Torres Strait Islander communities88.0 -96.583.390.7 -91.7 -91.6
2016
General population89.191.392.493.293.394.984.491.691.2
Aboriginal and Torres Strait Islander communities78.6 -92.7100.089.5 -93.4 -92.7

 - Nil or rounded to zero.

Note: Excludes Other Territories and overseas visitors.

To reduce correlation bias, weighting classes can be used in the estimation model such that within a weighting class there are no systematic patterns of response. Based on analysis of 2021 Census and Post Enumeration Survey response patterns, state-based quartiles of the Socio-Economic Indexes for Areas (SEIFA) - Index of Economic Resources[1] were included as weighting classes which effectively reduced the correlation bias in the estimates. 

A technique known as propensity analysis was also conducted on both the Census and Post Enumeration Survey to assess the main drivers of non-response. This analysis used Post Enumeration Survey data to model the propensity for a person to complete a Census form and Census data to model the propensity for a person to complete the Post Enumeration Survey. Outcomes from this analysis were used to determine benchmarks for use in the weighting used in the Post Enumeration Survey estimation process. The variables used in the weighting process in 2016 were again used in 2021 and included state and/or territory, and part of the state and/or territory of usual residence, Sex, five-year age groups, Marital status, Country of birth, Indigenous status, and whether located in a Aboriginal and Torres Strait Islander community. As a result of the 2021 propensity analysis, two additional groupings were found to be significant predictors of Census response and therefore included in the weighting process; an indicator of how the Census form was delivered (mailed out or dropped off), and a measure of Census field areas that were difficult to enumerate (based on the proportion of occupied non-responding private dwellings).


[1]  Australian Bureau of Statistics (2018). Census of Population and Housing: Socio-Economic Indexes for Areas (SEIFA), Australia, 2016.  Retrieved from https://www.abs.gov.au/ausstats/abs@.nsf/mf/2033.0.55.001

4. Measurement

Recall error may feature because of the long Census enumeration period. However, this would be no more significant than in 2016. Recall error depends on whether there is an anchor point to assist people’s recollection. Census communication focussed on a Census period for response rather than Census night and response patterns showed high response on and immediately before Census night. While this may have affected the concept of a Census night, recall bias was assessed as being no more a risk in 2021 than in previous Post Enumeration Surveys.

  • Memory effects for major events (which Census is designed to be) tend to wane after one to two weeks and would have been a little worse after ten weeks for the 2021 Post Enumeration than they would have been for previous Post Enumeration Surveys.
  • In addition, the requirement to recall information about Census night in 2021 was examined in the context of Automated Data Linking. Automated Data Linkage provides an enhanced ability to search for, and match, Post Enumeration Survey persons to their Census form, utilising a variety of search addresses and personal identifier information. Therefore, the requirement for persons to recall their exact address on Census night is reduced, provided they can correctly recall whether or not they were in Australia (i.e. whether they should have been counted at all).

5. Processing

Matching error should be lower in the 2021 post Enumeration Survey because of the improved matching procedures.

Outcomes from linking and matching processes underwent a high level of scrutiny and quality assurance in 2021, to ensure that the Post Enumeration Survey did not miss links for Post Enumeration Survey persons who were actually counted in the Census, and to ensure that a Post Enumeration Survey person was not linked to a Census record in error.

Final match rates for the general population for persons with at least one link to 2021 Census were higher than the 2016 equivalents (94.5% and 91.1%, respectively). More high-quality links were found by Automated Data Linking in 2021 (and did not require clerical review), compared to 2016 (75.0% and 65.1%, respectively). This is likely to be a result of increased online Census uptake as well as more people being at home on Census night with mobility restricted in some states and territories.

Given a key requirement for successfully linking a Post Enumeration Survey person to their corresponding Census record is a sufficient level of data quality, a quality adjustment was continued in 2021. This method identified Census and Post Enumeration Survey records that had insufficient personal identifier information necessary for linking records (e.g. where Census data was missing or imputed for multiple linking variables, such as Name, Age or date of birth, and Sex). To remove the potential for any upward bias on the Post Enumeration Survey estimate of population totals (and level of net undercount), these records were treated in a similar fashion to late returns. This adjustment moved 31,616 Census persons or 0.12% of all persons counted in the Census.

6. Model

The ABS advises that the estimation model referred to in the section on non-response/correlated response bias, which is used to produce estimates and adjust for non-response appears to have worked effectively. However, there are no measures of the residual non-response bias.

Appendix D Terms of reference of the Panel

An independent view of the quality of statistical outputs from the 2021 Census of Population and Housing

Released
28/06/2022

D.1 Role

Decorative banner

The Australian Statistician has established an expert panel to provide an independent and high-level view of the quality of selected statistical outputs from the 2021 Census of Population and Housing. The Panel will request and review all information it considers relevant in order to report on the quality of 2021 Census statistics and their fitness for use.

D.2 Responsibilities

Decorative banner

The Panel will provide a written report by the end of June 2022 (to coincide with the first release of Census data) to the Australian Statistician giving its view on broad aspects of quality of Census outputs, having considered issues related to Census design, enumeration, processing, quality assurance etc. The quality will be assessed using outputs from the 2016 and 2011 Censuses as a benchmark as well as relevant secondary data sources.

It is planned to make the report publicly available, so that government, the community and other stakeholders can make their own informed judgments about the fitness-of-purpose of 2021 Census data for their uses.

D.3 Composition and tenure

Decorative banner

The membership of the Panel is:

  • Chair – Professor Sandra Harding, AO, Emeritus Professor, James Cook University and former Chair of the Australian Statistics Advisory Council (2001-2006)
  • Ms Leanne Liddle, Director of the Aboriginal Justice Unit, Northern Territory Government Department of the Attorney-General and Justice
  • Professor Peter McDonald, AM, Emeritus Professor, School of Demography, The Australian National University
  • Mr Peter Morrison, former Assistant Chief Statistician of Canada who was responsible for running the Canadian Census
  • Mr Dennis Trewin, AO, former Australian Statistician (2000-2007)
  • Mr Stephen Walters, Chief Economist, New South Wales Treasury, and member of the Australian Statistical Advisory Council

It is envisaged that the Panel will be active from October 2021 until the end of June 2022, when the Post Enumeration Survey processing will be complete and the first statistical releases from the 2021 Census occur in June 2022

D.4 Committee practices

Decorative banner

The Panel shall be free to request any information from the ABS it sees as relevant in order for it to form its view, and the ABS shall comply with all such requests in a timely manner (as long as they are consistent with relevant legislation such as the Census and Statistics Act).

The Panel will be supported by a Secretariat, headed by Sue Taylor, Director, Census Data Quality.

D.5 How the Terms of Reference have been addressed

Decorative banner

The Panel have examined each of the four aspects of the Terms of Reference and are comfortable that these are covered throughout the report.

Appendix E Self-service in the 2021 Census

An independent view of the quality of statistical outputs from the 2021 Census of Population and Housing

Released
28/06/2022

The ‘No-Census Number’ option

Decorative banner

For the first time in an Australian Census, people were able to complete the 2021 Census without receiving a Census form or Census Instruction Letter delivered to their address. Anyone from across Australia with internet access could open the Census website, receive a Census Number and initiate a Census form by providing their address and a mobile phone number. This is referred to as the ‘No-Census Number’ option.  This was developed to improve user-experience, increase Census response and coverage and as a risk mitigation in the event of disruption to the delivery of materials by Australia Post or Census field staff.

The 2021 Census received 1.75 million requests for a Census Number which resulted in 1.45 million household forms being submitted online. This represents 19% of all household forms submitted online. These 1.45 million forms were submitted by approximately 1.3 million dwellings.

Data quality improvements due to the ’No-Census Number’ option

Decorative banner

The introduction of the ‘No-Census Number’ option has had a positive impact on the quality of Census data. Improvements to the coverage of and response from the population are evident through increases in the number of dwellings added to the Census Frame. In the ‘Mail out’ areas where the Census frame was based on the ABS Address Register, an additional approximately 150,000 dwellings were included. This represents 1.6% of all private dwellings in these areas. The majority of these dwellings were originally not included because they were unverified addresses or under construction at the time of frame creation.

Improvements in data quality have also occurred through this option by people staying in non-private dwellings, travelling or in hard to reach locations. Most persons staying in non-private dwellings on Census night responded using the Census form provided to the establishment by a Census field officer. However, approximately 57,000 persons or 8% of all persons counted in non-private dwellings used the option (see Table E.1). The non-private dwelling type that returned the most forms from this option was hotel/motels which is also the largest type of non-private dwelling. However, the type of non-private dwelling that had the highest proportion of persons use the option was in residential colleges and halls of residence where approximately 21% of all persons counted used this option.

Table E.1 Proportion of persons using option in selected non-private dwellings
Non-private dwellingProportion of persons counted using option (a)
 %
Hotel, motel, bed and breakfast11
Staff quarters14
Residential college, hall of residence21
All non-private dwellings (b)8

(a) Total persons in dwelling includes imputed persons and overseas visitors.

(b) Includes total of all non-private dwellings. Includes Other Territories.

While dwellings in Private Dwelling Establishments such as Caravan Parks and Retirement Villages also largely responded using the materials provided by a Census field officer, approximately 26,000 forms were received via the option. This was highest in Caravan Parks and Marinas, where 19% and 38% of all forms received used the No-Census Number option (see Table E.2).

Table E.2 Proportion of dwellings using option in private dwelling establishments
Type of private dwelling establishmentProportion of forms received using option (a)
 %
Caravan park19
Marina38
Manufactured home estate7
Retirement village4
All dwellings in private dwelling establishments8

(a) Includes Other Territories.

The No-Census Number option enabled households to respond without receiving a Census form. It also enabled individuals to respond separately to other people in their household. In this Census, approximately 100,000 household forms were merged with another form from the dwelling. This is largely due to use of the No-Census Number option and is expected to have contributed to improved coverage of the population. The ease of access to the option also introduced greater duplication of responses. While these have been largely removed in the processing of Census data, it is possible that a small amount of unidentified duplication remains.

Glossary

An independent view of the quality of statistical outputs from the 2021 Census of Population and Housing

Released
28/06/2022

Terms used and definitions

Decorative banner

Aboriginal and Torres Strait Islander person

According to the Commonwealth definition[1], an Aboriginal or Torres Strait Islander is a person of a. Aboriginal and Torres Strait Islander descent, b. who identifies as an Aboriginal or Torres Strait Islander and c. is accepted as such by the community in which he or she lives.

The Census and Post Enumeration Survey collect information on a person’s reported (self-identified) Indigenous Status. See Indigenous Status.


[1] Department of Aboriginal Affairs (1981). Report on a review of the administration of the working definition of Aboriginal and Torres Strait Islander, Canberra: Commonwealth of Australia. Department of the Parliamentary Library, 2003. Defining Aboriginality in Australia, Canberra. Commonwealth of Australia.

Accuracy Framework

A framework developed by the Census Statistical Independent Assurance Panel for use in assessing the sources and types of error that might affect the accuracy of the Census and population estimates. This framework is covered in detail in Appendix B.

Address register

A comprehensive list of Australian addresses developed using the Geocoded National Address File. Other administrative datasets are also used to update the Register, such as Australian Electoral Commission data and ABS Building Approvals and Demolitions data. The Address Register does not contain any information about the occupants of the address. The Address Register was built by the ABS in the lead up to the 2016 Census and is regularly updated by its management team. The Address Register is a national resource that is owned and hosted by the ABS.

Anchor point

In the context of the Census, an anchor point is an event that assists in the recollection of a person, dwelling or family’s circumstances on Census night.

Australian states and territories

The ABS identifies six states and six territories in Australia. The six states are New South Wales, Victoria, Queensland, South Australia, Western Australia, and Tasmania. The six territories are Northern Territory, Australian Capital Territory, Jervis Bay Territory, Territories of Christmas Island, Cocos (Keeling) Islands, and Norfolk Island.

Automated Data Linking

Automated processes used to determine possible links between Census and Post Enumeration Survey data, before any clerical matching processes (such as the match and search system) has begun. It links records by using a range of personal and addresses characteristics to evaluate the likelihood that a Post Enumeration Survey and Census record pertain to the same individual.

Census

The Australian Census of Population and Housing is an official count of population and dwellings, and collects details of age, sex, and other characteristics of that population. The Census is conducted every five years, and asks respondents to complete their Census form about their circumstances on Census night.

Census accuracy framework

See accuracy framework

Census form

The questionnaire used by people to provide person and dwelling information as part of the Census. The Census form is available online or on paper.

Census frame

The collection of Census-relevant address information based on the Address Register and other information obtained from Census field staff, the Census Contact Service and other ABS staff. This includes information such as dwelling type and structure and street address.

Census Contact Service

The Census Contact Centre is a service established to support the public with questions they have about the 2021 Census. This was also used by the public to request Census material. Service offerings included both call and email channels and was supported by an Escalations team who responded to the more difficult customer contacts. The Contact Centre opened on the 5 July 2021 and closed on the 1 October 2021.

Census night

For the 2021 Census, Census night was the night of 10 August 2021. People are asked to complete their Census form about their personal circumstances on Census night, but do not have to complete their Census form on Census night.

Contact sector

In the context of the Post Enumeration Survey, the Census contact sector comprises all dwellings that were determined to be occupied on Census night and from which a form was received before the Post Enumeration Survey commenced data collection.

For simplicity, this report refers to “Persons on Census forms” in place of the technical term “Contact Sector”.

See non-contact sector

Correlation bias

A bias that can result for Post Enumeration Survey estimates if Statistical Independence is not preserved, that is to say if persons are systematically missing from both the Census and Post Enumeration Survey, beyond what demographic or geographic variables can explain.

See statistical independence

Coverage

Coverage describes the extent to which people or dwellings that are in scope of the Census are counted in the Census.

Data item

A Census data item (or variable) is a characteristic of a person, dwelling or family that is collected in the Census.

Derivation

The process where some variables are assigned values based on responses to other questions, or (where no response has been provided) from other family members present in the same dwelling. For example, if a person provides their date of birth on their Census form and does not provide an age, then their age is derived (calculated) based on their provided date of birth.

Discrete Communities

A Discrete Community is a geographic location, bounded by physical or legal boundaries, which is inhabited or intended to be inhabited predominantly by Aboriginal or Torres Strait Islander peoples, with housing or infrastructure that is managed on a community basis.

Drop off field area

See field area

Dwelling

A dwelling is a structure which is intended to have people live in it, and which is habitable on Census night. The two main types of dwelling are private and non-private dwellings.

A private dwelling is one that accommodates a person or a group of people and is not generally available for public use. The main purpose of a dwelling is as a place of habitation, and it is usually built (or converted) to function as a self-contained housing unit. Private dwellings include houses, flats and apartments as well as structures that are non-standard or temporary in nature. Examples of non-standard private dwellings are any caravans, sheds, houseboats and tents that are occupied on Census night.

A non-private dwelling is one that provides short or long-term communal or transitory type accommodation. Non-private dwellings are generally available to people for reasons of employment, study, special need, legal requirement or recreation. For example, hotels, hospitals, and prisons are all classified as non-private dwellings.

Dwelling non-response

Occurs when a completed Census form has not been returned for a private dwelling determined to be occupied on Census night.

Dwelling non-response rate

The percentage of private dwellings identified as occupied on Census night that did not return a Census form.

Dwelling response

Occurs when a Census form is returned for a private dwelling identified as occupied on Census night.

Dwelling response rate

The percentage of private dwellings identified as occupied on Census night that returned a Census form.

Enumeration

The process by which Census information is collected about people and dwellings in Australia on Census night. The enumeration process takes many months to complete, and includes the delivery of Census forms or online login codes, the completion of the Census by members of the public, and the return of Census responses to the ABS, as well as other associated activities.

Estimated Resident Population

The official measure of the population of Australia based on the concept of usual residence. It refers to all people, regardless of nationality, citizenship or legal status, who usually live in Australia, with the exception of foreign diplomatic personnel and their families. It includes usual residents who are overseas for less than 12 months over a 16 month period. It excludes overseas visitors who are in Australia for less than 12 months over a 16 month period.

Field area

A geographical area that is designed to help the ABS conduct the Census. There are two types of field areas: drop off field areas and mail out field areas.

Dwellings within a drop off field area are visited by field staff to deliver paper Census forms to each dwelling.

Dwellings within a mail out field area are first contacted by the ABS via mail, and are posted log in details to complete the online Census form, or a paper Census form.

Field officer

An ABS employee who is responsible for conducting Census enumeration within a designated field area.

Fitness-for-purpose

Fitness-for-purpose refers to data that are able to be used for its stated and intended purpose.

Gross overcount

Number of persons counted more than once on Census forms, or otherwise counted on Census forms when they should not have been, as measured by the Post Enumeration Survey.

Gross undercount

Number of persons missed from Census forms or in dwellings missed by the Census, as measured by the Post Enumeration Survey.

Hot-decking

The primary imputation method used for the 2021 Census. The method involves locating a donor record and copying the relevant responses to the record requiring imputation. The donor record must have similar characteristics to the record requiring imputation, and must also have responses to some specific data item(s). In addition, the donor record must be located geographically as close as possible to the location of the record to be imputed. In 2021, administrative data was used in the hot-decking imputation to improve the selection of donors.

Imputation

A statistical process for predicting values where no response was provided to a question and a response could not be derived (see derivation). The Census imputes persons into non-responding private dwellings that are determined to be occupied on Census night, as well as into any non-private dwellings where a person was known to be staying but no form was returned. This is known as person imputation. The Census also imputes missing responses for some data items (Age, Sex, Marital status, and Place of usual residence) for responding persons who left these fields blank.

Indigenous status

The Census and the Post Enumeration Survey use the ABS Standard Indigenous Question[1] to collect information for the ‘Indigenous Status’ variable. The ABS Standard Indigenous Question is based upon the Commonwealth working definition (see Aboriginal and Torres Strait Islander person) but does not include the third element of the Commonwealth definition, namely that ‘an Aboriginal or Torres Strait Islander is a person who is accepted as such by the community in which he or she lives’. Collecting information on the basis of community acceptance is often impractical in a survey or administrative data collection setting and can lead to inaccuracies. For these reasons, it is not included in the ABS Standard. The definition of Indigenous Status is therefore operationalised as whether or not a person identifies as being of Aboriginal or Torres Strait Islander origin.

The term ‘origin’, when used in the context of the operational definition, is considered to relate to a person’s Australian Aboriginal and/or Torres Strait Islander descent and for some, but not all, their cultural identity.

The standard term for this variable is ‘Indigenous Status.’ ‘Indigenous status’ is an acceptable term for use in data collection only, and only in terms of identifying a characteristic of a person. A person’s Indigenous status is determined by their response to the ABS Standard Indigenous Question: “Are you of Aboriginal or Torres Strait Islander origin?” for which categories are: No; Yes, Aboriginal; or Yes, Torres Strait Islander. This question also allows respondents to report that they are both ‘Aboriginal’ and ‘Torres Strait Islander’ if that is how they identify.


[1] Australian Bureau of Statistics (2014). 1200.0.55.008 Indigenous Status Standard, 2014, Version 1.5. Retrieved from http://www.abs.gov.au/ausstats/abs@.nsf/mf/1200.0.55.008

Interviewer household form

The Interviewer household form is used in Aboriginal and Torres Strait Islander communities. The Interviewer household form is a Census form which is used to record the details of up to 12 people in a household, and some dwelling data. If there are more than 12 people in a dwelling, additional Interviewer household forms are used.

Item non-response

Item non-response occurs in two situations:

  • where a household or person returns a form but does not answer one or more questions - these are “item non-response”; and
  • where key variables for a non-responding person have been imputed, the remainder of questions are either set to “item non-response” or “not applicable”, dependant on the imputed age of the person.

Item non-response rate

The item non-response rate is calculated by dividing the number of households or persons who provided a response to a particular question by the number of persons for whom the question would have been applicable, and is expressed as a percentage.

Mail out field area

See field area

Match and search system

The main clerical tool used in the processing of the Post Enumeration Survey data, which allows processors to search, view, compare, and record matches between Post Enumeration Survey and Census records.

Migratory

People enumerated on an overnight journey by plane, train or bus cannot be allocated a dwelling type. This category exists for data processing and data querying processes only.

Multi-Agency Data Integration Project

The Multi-Agency Data Integration Project is a secure data asset combining information on health, education, government payments, income and taxation, employment, and population demographics (including the Census) over time.

Net overcount

See net undercount

Net undercount

Net undercount is the difference between an estimate of the number of people who should have been counted in the Census and the actual Census count (including imputations). This estimate is based on the Post Enumeration Survey conducted after each Census. For a category of person (e.g. based on age, sex and state of usual residence), net undercount is the result of Census undercount, overcount, differences in classification between the Post Enumeration Survey and Census, and imputation error.

A positive net undercount indicates that there are more people that should have been counted in the Census than there were counted in the Census.

A negative net undercount is often referred to as a net overcount. A net overcount indicates that there are more people counted in the Census than there should have been. This can be the result of too many people being imputed in the Census.

No-Census number option

An option introduced for the 2021 Census to allow persons who had not received a Census number via the mail or from a field officer to access and complete an online Census form.

Non-contact sector

In the context of the Post Enumeration Survey, the Census non-contact sector comprises dwellings that were determined to be occupied on Census night, from which no Census form was received (imputed dwellings) or a Census form was received after the Post Enumeration Survey commenced data collection (late returns), and person responses that had insufficient identifier information.

For simplicity, this report refers to “Persons imputed” in place of the technical term “non-contact sector”.

See contact sector

Non-private dwelling

See dwelling

Non-response

In the context of the Census, there are three types of non-response: dwelling non-response, person non-response, and item non-response. If it is not specified, typically “non-response” refers to dwelling non-response.

Non-response rate

In the context of the Census, there are three types of non-response rates: dwelling non-response rate, person non-response rate, and item non-response rate. If it is not specified, typically “non-response rate” refers to the dwelling non-response rate.

Occupied private dwelling

A private dwelling at which it was determined that a person or people were present on Census night.

Off-shore

This dwelling type category includes dwellings which exist in off-shore oil rigs and drilling platforms.

Other Territories

A category of the Australian Statistical Geography Standard at the state and/or territory level that has been created for statistical purposes. In 2016, Other Territories includes the territories of Jervis Bay Territory, Territories of Christmas Island, Cocos (Keeling) Islands, and Norfolk Island. The inclusion of Norfolk Island in Other Territories was new for 2016.

Overcount

Any effect where the Census count exceeds the true population.

See gross overcount

Overseas visitor

For the Census, an overseas visitor is a person who usually lives in another country and will be visiting Australia for less than a year.

Person imputation

See imputation

Person response

Occurs when a person is included on a returned Census form or their information is provided to the Census via administrative data.

Person response rate

The percentage of all people identified in the Census (including those who are imputed) that are included on a returned Census form or that have their information provided to the Census via administrative data.

Place of enumeration

The address at which a person spent Census night.

Place of usual residence

The address at which a person has lived, or intends to live, for a total of six months or more in a given year.

Post Census Review

See Post Enumeration Survey

Post Enumeration Survey

The Post Enumeration Survey is a household survey conducted following the Census. This is also known as the Post Census Review. The Post Enumeration Survey allows the ABS to estimate the number of people missed in the Census and the number counted more than once or in error. The Post Enumeration Survey is conducted independently to the Census, and results obtained are used to adjust Census counts in the calculation of Estimated Resident Population figures for Australia.

Post Enumeration Survey population estimate

An estimate (based on the Post Enumeration Survey and Census data) of the number of people who should have been counted in the Census.

Population estimates

See Estimated Resident Population

Population estimates accuracy framework

See accuracy framework

Prediction regression estimation

A statistical process used in the Post Census Review to estimate net undercount.

Private dwelling

See dwelling

Rebased/rebasing

After every Census, the Estimated Resident Population is recalibrated, or ‘rebased’. Rebasing is the process of adding the net overcount or net undercount from the Post Enumeration Survey to the new Census population counts separately at the state/territory, age and sex group level. Further demographic and time adjustments are then made before the Estimated Resident Population data is finalised.

After each Census, the ABS uses Census counts by place of usual residence which are adjusted for undercount to construct a new base population figure for 30 June of the Census year. Because this new population estimate uses the Census as its main data source, it is said to be ‘based’ on that Census and is referred to as a population base.

Rebasing refers to the process by which the ABS uses this new base to update all previously published quarterly population estimates from the previous Census to the most recent Census (the intercensal period).

Response

In the context of the Census, there are three types of response: dwelling response, person response, and item response. If it is not specified, typically “response” refers to dwelling response.

Response rate

In the context of the Census, there are three types of response rates: dwelling response rate, person response rate, and item response rate. If it is not specified, typically “response rate” refers to the dwelling response rate.

Response ‘window’

Period of time around Census night (before, on and after) in which people can respond to the Census, using Census night as the reference point for their responses. For the 2021 Census, the ABS emphasised via public messaging that respondents had a ‘window’ of time to complete and return their Census forms.

Scope of the Census

The Census includes all people who spent Census night in Australia in one of the six Australian states, the Northern Territory, the Australian Capital Territory, Jervis Bay Territory or the Territories of Christmas Island, Cocos (Keeling) Islands and Norfolk Island. All people in Australia on Census night are counted, along with the dwelling they are staying or living in. This also includes people sleeping out or in temporary dwellings. The only groups of people who spend Census night in Australia but are excluded from the Census are foreign diplomats and their families. While most unoccupied dwellings are included in the Census, some exceptions include caravans, tents or non-private dwellings where there were no people staying on Census night.

Shipping

This dwelling type category includes people on ‘vessels’ travelling between ports in Australian waters i.e. ships, cargo vessels, passenger liners, ocean-going passenger or car ferries and dredges. It excludes foreign-owned cargo vessels and those bound for overseas.

Special strategies

A range of approaches used by the ABS for specific population groups to improve the coverage of people in Australia, and ensure these groups participate in the Census and accurate information is collected. Special strategies exist for a range of population groups, such as Aboriginal and Torres Strait Islander peoples, people with disabilities, people experiencing homelessness, people from culturally and linguistically diverse backgrounds, people travelling or away from their home on Census night, and people staying in non-private dwellings on Census night.

Statistical independence

Statistical independence is a mathematical assumption that underlies the Post Enumeration Survey estimation. In the context of the Post Enumeration Survey, statistical independence requires both population independence (that people who were not counted in the Census are no more likely to be missed by the Post Enumeration Survey than people who were counted) and operational independence (that Census operations do not influence Post Enumeration Survey operations and vice versa).

Total net undercount

The total net undercount is the same as net undercount. The use of the word “Total” is to distinguish from components such as net undercount for persons on Census forms and net overcount for persons imputed.

Undercount

Any effect whereby the Census count falls short of the true population.

See gross undercount

Unoccupied private dwelling

A private dwelling at which it was determined no people were present on Census night.

Unrebased

Unrebased Estimated Resident Population counts have not been “rebased” using Census counts by place of usual residence and adjusted for undercount to construct a new base population figure for 30 June of the Census year.

The unrebased Estimated Resident Population for 2021 used in this report was obtained by updating the 2016 rebased Estimated Resident Population using births, deaths, internal migration and international migration between 2016 and 2021. The rebased estimates from the 2021 Census were not available at the time the report was being prepared.

The unrebased Estimated Resident Population for 2016 used in this report (for comparison purposes with unrebased 2021 estimates) was the 2016 Estimated Resident Population as published on 16 December 2021 (prior to rebasing based on results from the 2016 Census).

Usual residence

See place of usual residence

Usual resident

In the Census a person is counted as a usual resident if they usually live in Australia or if they are visiting Australia for one year or more.

Variable

See data item