Building advanced tables
Large tables, hierarchical variables, adding multiple variables, using wafers and filters
Large tables
When a table has more than 10,000 cells including totals, TableBuilder automatically enters Large table mode and displays a warning message.
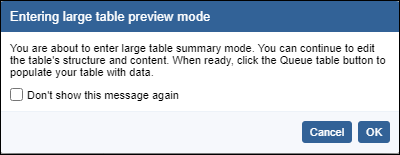
You will then need to queue and download your table to view the counts
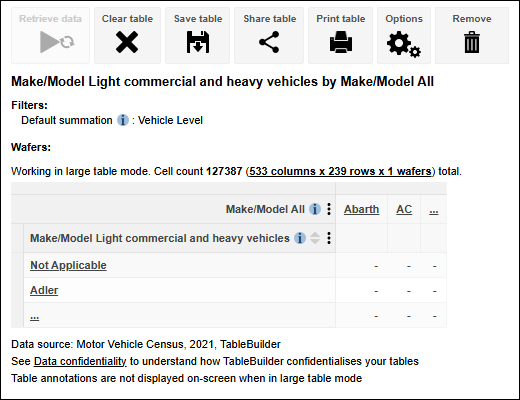
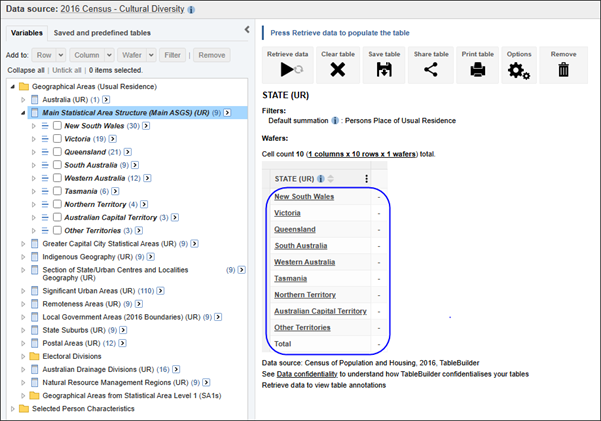
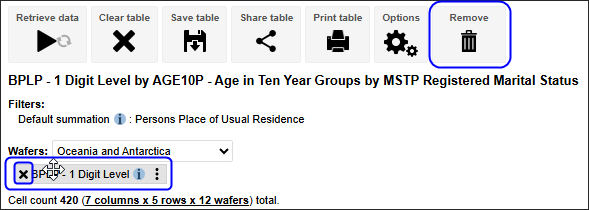
When in large table mode, TableBuilder displays a summary version of the full table, with only two categories displaying for each variable. A message indicating that you are working in large table mode and the cell count of the large table displays above the table. This shows the number of rows, columns, wafers and the total cell count. The largest table that can be built in TableBuilder is 40 million cells, including row and column totals and wafers.
Although you can only see part of the table, you can continue using table functions, such as adding and removing variables or categories from the rows, columns and wafers. In large table mode, dragging variables with a large number of categories from one axis to another (such as large geographical classifications) may take some time.
After you have queued your table, very large tables of several million cells may take some time to run, from 30 min to several hours. This depends on how complex your table is, the size of the dataset and the number of other users submitting large tables. If you submit a lot of very large tables, your tables are likely to complete more slowly.
Hierarchical variables
Datasets may include variables that are represented as hierarchies. This is where there are different levels of a variable that can be displayed. Geographic variables are often available as hierarchical variables. Examples:
- Greater Capital City Statistical Areas (GCCSA) contains a hierarchy of several levels, with STATE at the top level, GCCSA at the next level, and Statistical Area 4 (SA4) at the lowest level.
- Age variable may contain 10 year groupings at the top level, with 5 year groupings at the next level, and individual ages at the lowest level.
The highest level of the hierarchical variable is always displayed first in the list, the next level is displayed second, and the most detailed level is last.
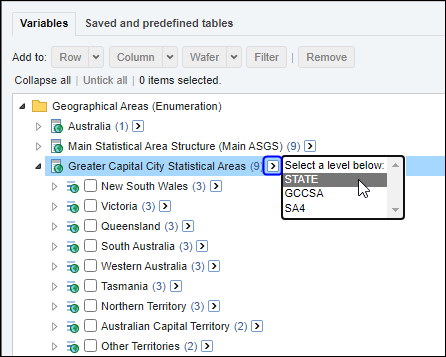
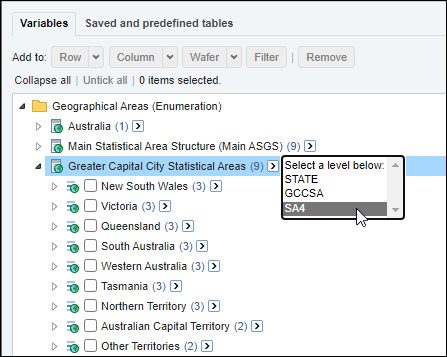
Beside each variable in the left panel of the Table view you can select the > button to see how many levels a variable includes. Selecting one of items in the Select a level below list selects all categories at that level. All categories for single level variables can also be selected this way.
Click on the > next to the variable name. Selecting SA4 here selects all SA4s in all States.
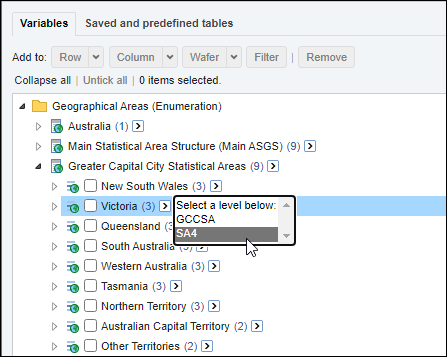
Click on the > next to one of the State level categories. Selecting SA4 here selects all SA4s in that State only.
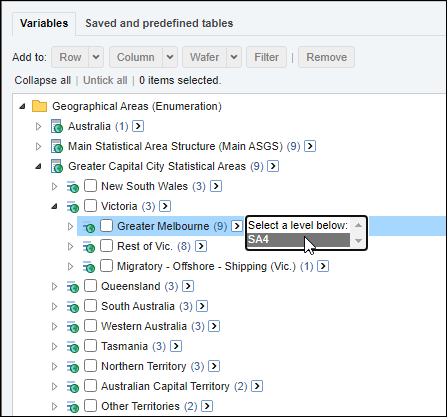
Click on the > next to one of the Greater Capital City Statistical Area (GCCSA) level categories. Selecting SA4 here selects all SA4s in that GCCSA only.
Changing the level of a hierarchical variable in a table
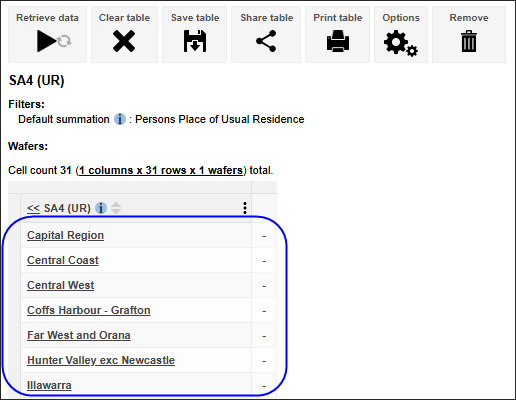
For hierarchical variables, drill down within the table. By clicking on the underlined category name, the next level down of the variable displays. For example, clicking on New South Wales displays the next level down: Greater Sydney, Rest of NSW, etc.
Display of next level down for New South Wales.
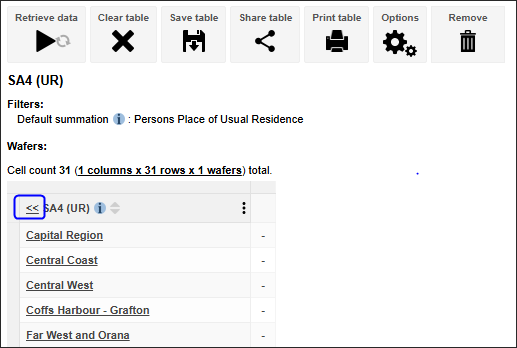
Collapse back up to the State level by clicking on the double arrow. This displays all categories for the higher level.
Add a variable to wafers
You can also add variables to the third dimension of a table - wafers.
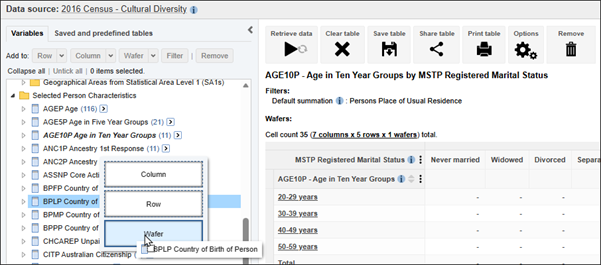
1. Using our earlier example table, add the Country of Birth of Person variable to the wafer. Click and drag Country of Birth towards the table. Drop the variable onto Wafer. Alternatively, after selecting the categories using the > you can use the Add to wafer button at the top. A separate wafer (layer) for each country is added to the table.
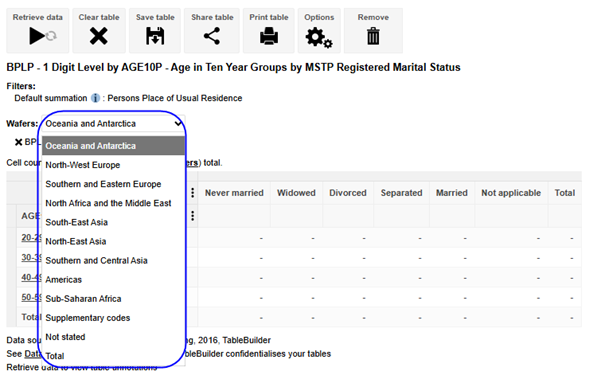
2. The wafer displays above the table. The wafer for all people born in Oceania is displayed. View the list of all categories in wafers using the Wafers drop-down menu.
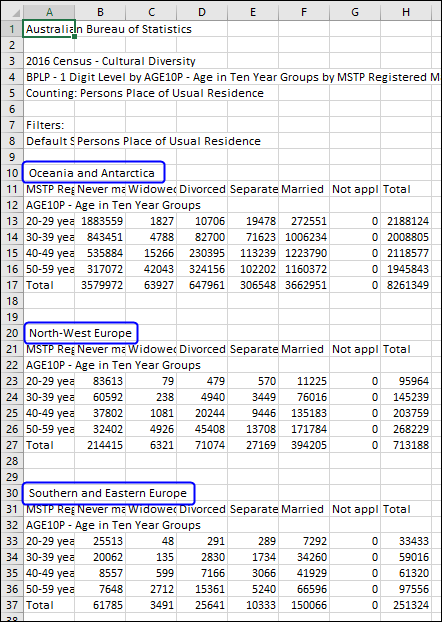
3. Wafers are displayed differently in the downloaded table depending on format.
Excel 2007 displays wafers as individual sheets of the workbook.
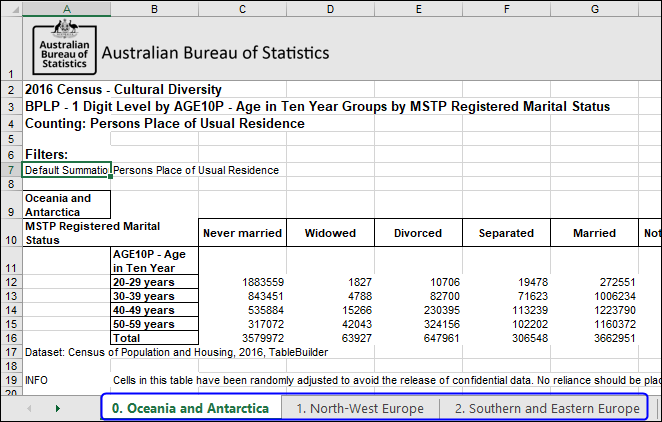
CSV displays wafers consecutively on the first sheet.
4. To remove a variable from the wafer, click on the X next to the wafer variable or drag the wafer variable to the Remove icon.
Add multiple variables to rows, columns or wafers
You can add multiple variables to a table so that the variables are nested within rows, columns or wafers. Nesting is where multiple variables are on the same axis, such as Age and Marital status in the Row axis. The maximum number of variables that can be nested on an axis is 10 variables. This is also the maximum number of variables that can be included in a table. For performance reasons it is better to have less than 10 variables in your table, particularly for large classifications or datasets.
Once you have created your table, you can drag variables to change the order of nesting within a row, column or wafer. You can also drag variables between the rows, columns and wafers to rearrange your table.
To nest variables in a table, add variables one at a time to the row, column or wafer. Variables can be added using the drag and drop method or the Add to Row, Column or Wafer buttons.
- Select Age categories between 15 and 29 years and Add to row.
- Then select Indigenous Status, and Add to row.
- Add Sex to column.
- The variables Age and Indigenous Status display as nested variables.
Add and remove a filter
When filters are applied to a table, only records that match the filters are included in the results. Filters are an alternative to selecting and including specific categories in the table, and can easily be removed to show all categories again.
1. The following table shows Labour Force Status (LFSP) by State with no filters applied.

Excel 2007 table output with no filter applied

CSV table output with no filter applied

2. Select a single category and click Add to Filter.
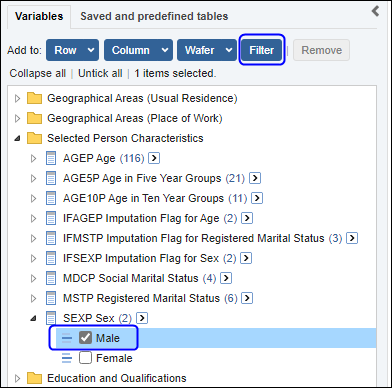
3. TableBuilder adds the filter to the Filters list above the table.
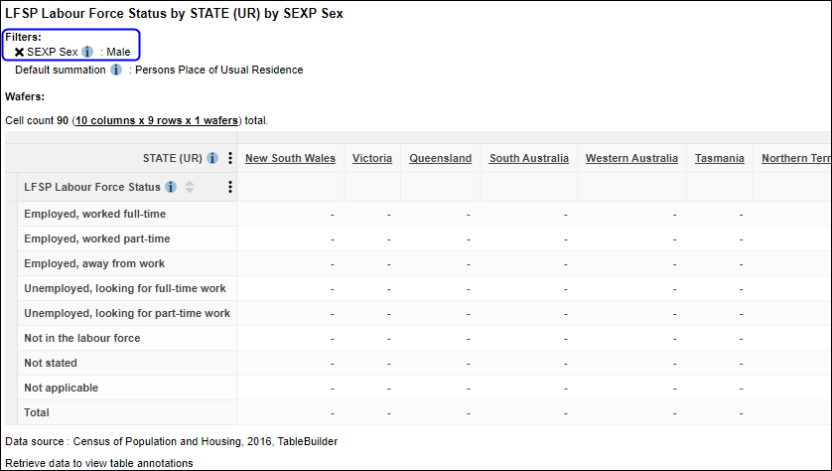
Excel 2007 output with filter for males

CSV output with filter for males

4. Additional variables can be added to the filter. However, only one category can be added per variable. For example Sex - Male and Sex - Female cannot both be added as a filter at the same time, but you can add Marital status - Married.
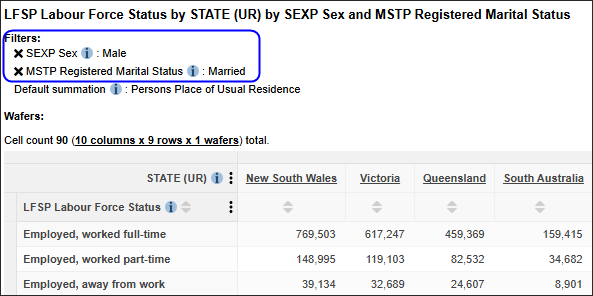
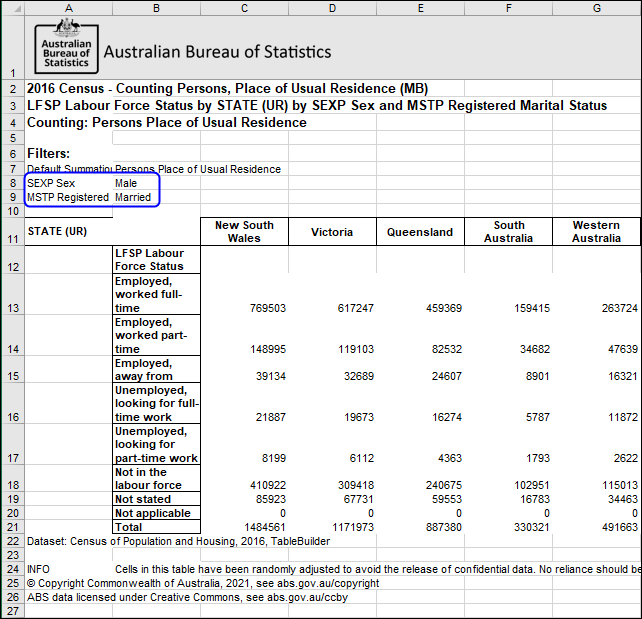
5. The following table has two filters added. The table now only includes individuals who are both Male and Married.

Excel 2007 output with two filters applied
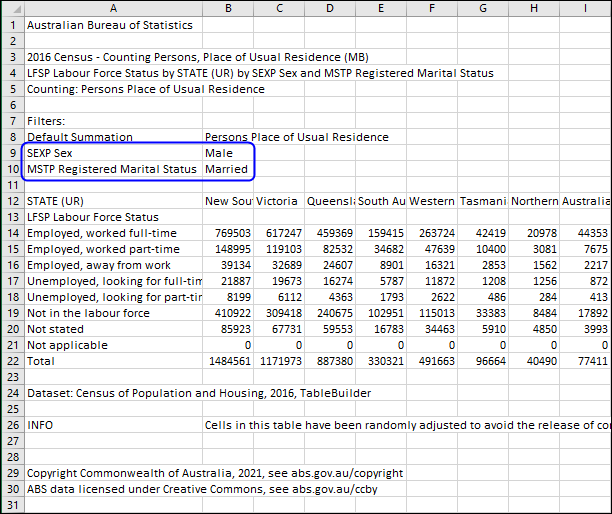
CSV output with two filters applied
6. To remove a filter, click the X next to the filter name.
