Confidentiality and relative standard error
Perturbation and interpreting tables with small cells, sparsity and relative standard errors
In accordance with the Census and Statistics Act 1905, all the data in TableBuilder is subject to a confidentiality process before release. This confidentiality process is undertaken to avoid releasing information that may allow for the identification of particular individuals, families, households, dwellings or businesses. For further details of how the ABS handles your information, see the ABS privacy policy, Census privacy policy and TableBuilder Privacy Impact Assessment.
Cross-tabulation restrictions
System restrictions have been implemented which prevent the cross-tabulation of certain variables within several datasets.
These restrictions have been applied to:
- maintain the confidentiality of respondents
- ensure the output of quality data
- assist users by not allowing combinations of variables that statistically should not be combined.
When the restriction is triggered the following error message will be displayed: "The variable you are trying to add cannot be used with one of the variables already in the table.”
These restrictions are applied at the system level and can not be bypassed, though other similar variables may be available. For example, if you are using geographical areas from Mesh Blocks, you may be able to use another geographical area variable instead.
Perturbation
To minimise the risk of identifying individuals in aggregate statistics, a technique has been developed to randomly adjust cell values. Random adjustment of the data, known as perturbation, is considered to be the most satisfactory technique for avoiding the release of identifiable data while maximising the range of information that can be released. These adjustments have a negligible impact on the underlying pattern of the statistics.
Perturbation is applied across all non-zero cells in a table, including the totals cells. Perturbation may change the true cell value by either increasing or decreasing the value by a small amount. Within this context, although cells may appear to contain none, or all, of a relevant sub-population, this is not necessarily a reflection of the true value of the cell. These adjustments result in introduced random errors, but with almost no bias. The information value of the table as a whole is not significantly impaired.
Random perturbation can be a source of frustration to users, as it can result in inconsistencies in the data. Most tables reporting basic statistics do not show significant discrepancies due to random perturbation. However, as the degree of complexity of tables increases, the need for random perturbation remains and it will continue to be used in most TableBuilder datasets.
Totals
In TableBuilder, totals are not calculated by summing the interior values of the table. Instead, more accurate totals are provided by calculating the true total, and then perturbing this value. If you attempt to reconstruct a total on the basis of the perturbed interior cells, you are adding together the small changes made to each cell which may result in a large change relative to the perturbed total. It is recommended that totals are constructed in TableBuilder, rather than by summing the interior cells from an exported table.
Small cells
When calculating proportions, percentages or ratios from cross-classified or small area tables, the introduced random error can be ignored except for small cells. The introduced random adjustments made to cells in a table are independent of the size of the original cell value, so perturbation has the greatest relative impact on small cell values. The information value of the table as a whole is not impaired as small cell values are also strongly affected by other factors, such as sampling error, respondent errors and processing errors.
Small cells may not be reliable, as not enough records have been selected in the sample to accurately estimate the population for that combination of characteristics. To continue working, you can try creating a variant of the original table. For example, removing a Not applicable category may reduce the number of small cells in the table. Possible methods to improve reliability of the table include:
- removing one or more variables
- removing one or more categories
- using a less detailed level of a hierarchical variable
- creating a custom range to combine less relevant categories.
Caution should be exercised when interpreting and using cells with small values or large percentage Relative standard error (RSE) values. RSEs are provided for survey-based datasets that are subject to sampling variability. Datasets including the full Census of Population and Housing are not weighted so RSEs are not applicable.
When analysing a table of means or sums for a continuous variable, it is recommended that the table be compared to the corresponding table of counts of records with a valid response for that continuous variable. No reliance on estimates of means or sums should be placed on cells with a large RSE or for which the corresponding cell count is small. For more information, see the Summation options for continuous variables section.
Further information
- General information about confidentiality and perturbation is provided in Treating aggregate data in the Data confidentiality guide
- About the Census
- Census methodology, 2021
- You need to agree to Conditions of use when using TableBuilder. The ABS may impose a limit on the maximum number of tables per user.
Relative standard error
Some datasets, such as censuses of a population, are not weighted so the relative standard errors (RSE) do not apply and are not available in TableBuilder. RSEs are available for sample-based datasets that are subject to sampling variability. Refer to the TableBuilder section of each dataset's publication for information on reliability of estimates within these datasets. Publications for each TableBuilder dataset can be accessed from the Topics page, or within TableBuilder, click the i link at the top left next to the dataset name when in Table view. This opens in a new tab so you can continue working in TableBuilder. RSEs will automatically included in any downloaded table.
Sources of variability
There are two sources of uncertainty or variability associated with survey estimates that are released by TableBuilder. The first source of variability is due to sampling and the second is due to random adjustment of cell values.
Variability due to sampling
Since the estimates from surveys may be based on information obtained from a sub-sample of usual residents of a sample of dwellings, they are subject to sampling variability. They may differ from those that would have been produced if all usual residents of all dwellings had been included in the survey.
Most weighted datasets in TableBuilder measure this component of variability using the group Jackknife method.
These datasets use the Bootstrap method:
- Employee earnings and hours
- Motor vehicle use
- Road freight movements
Variability due to random adjustment
The random adjustment of totals and subtotals introduces another source of variability into the estimates. As these adjustments are generated in a predictable way the impact they have on estimates can be measured directly.
Standard errors
The variability due to sampling and random adjustment is combined into a single measure called the standard error (SE). The standard error indicates the extent to which an estimate might have varied by chance, because only a sample of dwellings was included, and by random adjustment.
There are about two chances in three that a sample estimate differs by less than one standard error from the number that would have been obtained if all dwellings had been included and there was no random adjustment. There are about 19 chances in 20 that the difference is less than two standard errors. Another measure of the likely difference is the relative standard error (RSE), which is obtained by expressing the standard error as a percentage of the estimate.
\(RSE\%(x)=\left(\frac{SE(x)}{x}\right)*100\)
RSEs of proportions and percentages
Proportions and percentages formed from the ratio of two estimates are also subject to sampling errors. The size of the error depends of the accuracy of both the numerator and denominator. For proportions where the denominator is an estimate of the number of persons in a group and the numerator is the number of persons in a sub-group of the denominator group, the formula to approximate the RSE is given below. The formula is only valid when x is a subset of y.
\(RSE\left(\frac{x}{y}\right)\cong\sqrt{RSE(x)^2-RSE(y)^2}\)
For proportions where the denominator and numerator are independent estimates, for example a ratio of rates relating to two separate populations such as Indigenous and Non-Indigenous, the formula to approximate the RSE is given below. The formula is only valid when x and y are estimated from separate independent populations, and when the RSEs on x and y are small.
\(RSE\left(\frac{y}{x}\right)\cong\sqrt{RSE(y)^2-RSE(x)^2}\)
Standard errors may also be used to calculate standard errors for the difference between two survey estimates (numbers or percentages). The sampling error of the difference between the two estimates depends on their individual standard errors and the relationship (correlation) between them. An approximate standard error of the difference between two estimates (x-y) may be calculated by the following formula:
\(SE(x-y)\cong\sqrt{SE(x)^2+SE(y)^2}\)
While this formula is only exact for differences between separate and uncorrelated characteristics of subpopulations, it is expected to provide a reasonable approximation for most differences likely to be of interest in relation to this survey.
In TableBuilder, it is the RSE of a percentage that is displayed, from which the standard error may be calculated. For example, if the estimated proportion is 30% with an RSE of 20%, then the standard error for the proportion is 6%.
In some cases, the formula for the approximation of the RSE of a proportion may be unsuitable to use because the RSE of the numerator is very close to, or below, the RSE of the denominator. In this case the RSE is suppressed. It is recommended to use the alternative formula below to calculate the RSE of the proportion if this occurs.
\(RSE\left(\frac{x}{y}\right)\cong\sqrt{RSE(x)^2+\left(1-\frac{2x}{y}\right)*RSE(y)^2}\)
Standard errors of means and sums
The estimates of means and sums of continuous variables are subject to sampling variability and random adjustment. As for population estimates, the variability due to sampling and random adjustment is combined into the calculated Standard Error, and the relative standard error is reported. The component of variability arising from sampling is calculated using either the Jackknife or Bootstrap method, depending on the dataset.
Standard errors of quantiles
The estimates of quantiles such as medians, quartiles, quintiles and deciles are subject to sampling variability and random adjustment. As for population estimates, the variability due to sampling and random adjustment is combined into the calculated Standard Error, and the relative standard error is reported. The component of variability arising from sampling is calculated using the Woodruff method. This is also true for Equal Distribution Quantiles.
Reliability of estimates
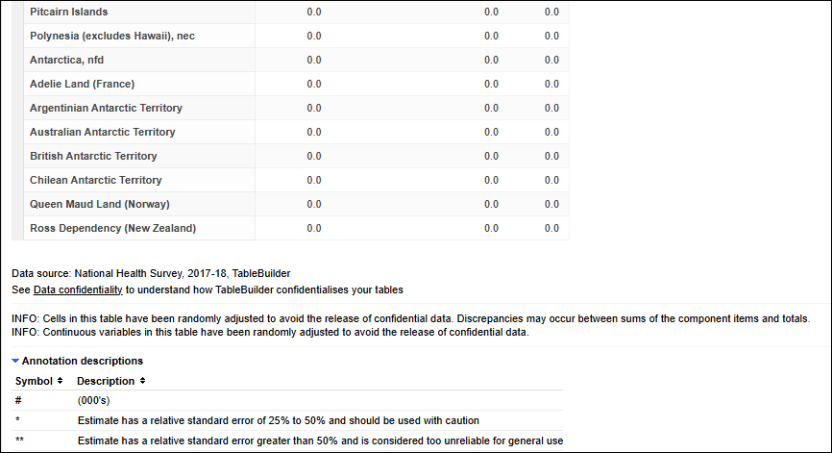
Estimates with RSEs of 25% or more are not considered reliable for most purposes. Estimates with RSEs greater than 25% but less than or equal to 50% are annotated by an asterisk (*) to indicate they are subject to high standard errors and should be used with caution. Estimates with RSEs greater than 50% have their RSE suppressed in order to prevent the release of confidential data, and are annotated by a double asterisk (**). These estimates are considered too unreliable for general use. Occasionally an estimate of RSE may be suppressed and displayed as ‘np’ (not published). This occurs because the RSE cannot be estimated reliably, and in this case the RSE should be interpreted as being greater than 50%.
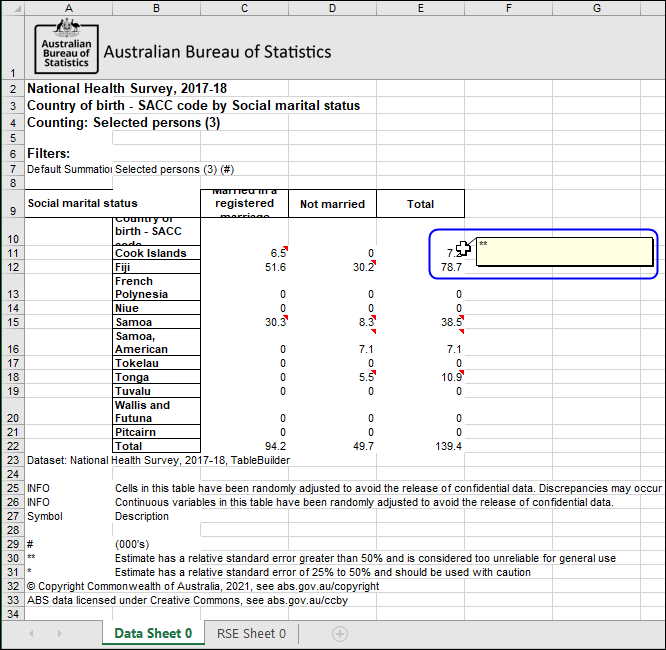
Excel downloads include small red arrows which indicate an annotation for cells that are asterisked
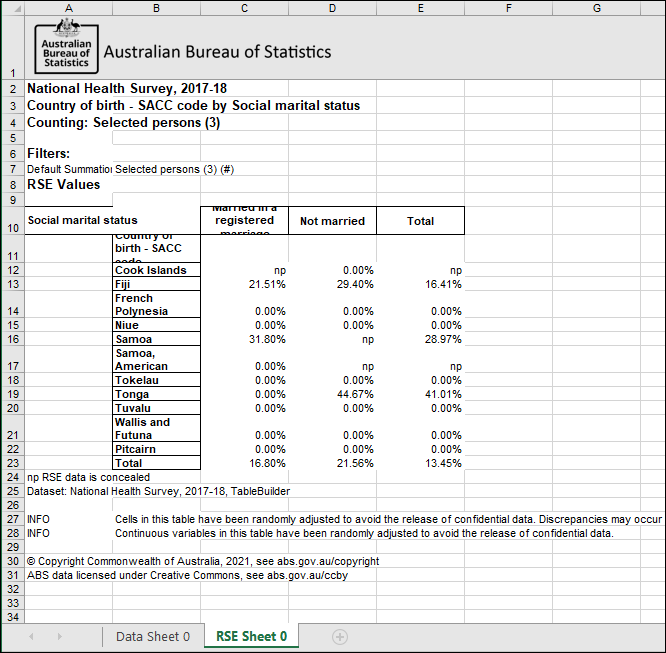
Excel downloads include np and RSE percentage data in a separate RSE Excel worksheet (tab)
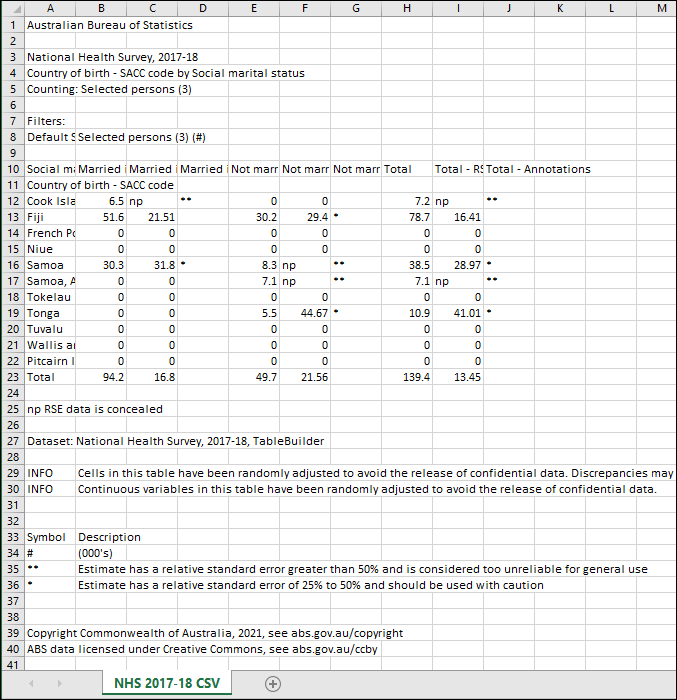
CSV displays asterisk, np and RSE percentage data within the same sheet as the counts data
Non-sampling error
The imprecision due to sampling variability and random adjustment should not be confused with inaccuracies that may occur because of imperfections in reporting by respondents and recording by interviewers, and errors made in coding and processing data. Inaccuracies of this kind are referred to as non-sampling error, and they may occur in any enumeration, whether it be a full count or a sample. Every effort is made to reduce non-sampling error to a minimum by careful design of questionnaires, intensive training and supervision of interviewers, and efficient operating procedures.
Sparsity
Some datasets have an additional quality measure called sparsity applied to tables with too many small cells. Sparsity does not apply to most Census of Population and Housing datasets.
Small cells may not be reliable, as not enough records have been selected in the sample to accurately estimate the population for that combination of characteristics.
In this example table showing Country of Birth (using the most detailed level of this hierarchical variable) by Social marital status, an error is located at the bottom of the table.
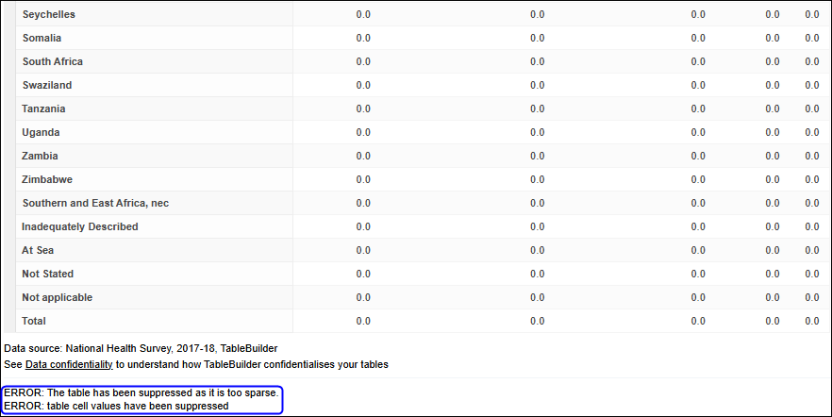
To continue working, you can try creating a variant of the original table. For example, removing a Not applicable category may reduce the number of small cells in the table and allow the data to be retrieved. Possible methods to reduce the size of the table include:
- removing one or more variables
- removing one or more categories
- using a less detailed level of a hierarchical variable
- creating a custom range to combine less relevant categories.
For this table, the Marital status categories of Not applicable and Married in a defacto marriage were removed. Then the full Country of birth variable was replaced with all categories within Oceania and Antarctica, still at the most detailed level of this hierarchical variable. This table was able to be retrieved.