Building a basic table
Open a dataset, using and removing rows and columns, variables and categories
Open a dataset
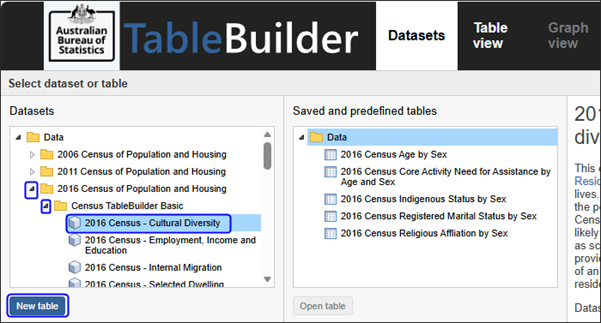
On the TableBuilder home page, click the triangle to expand the folder to display the datasets that you have access to. Either double-click the dataset or select the dataset and use the New table button at the bottom of the panel to start creating a new table.
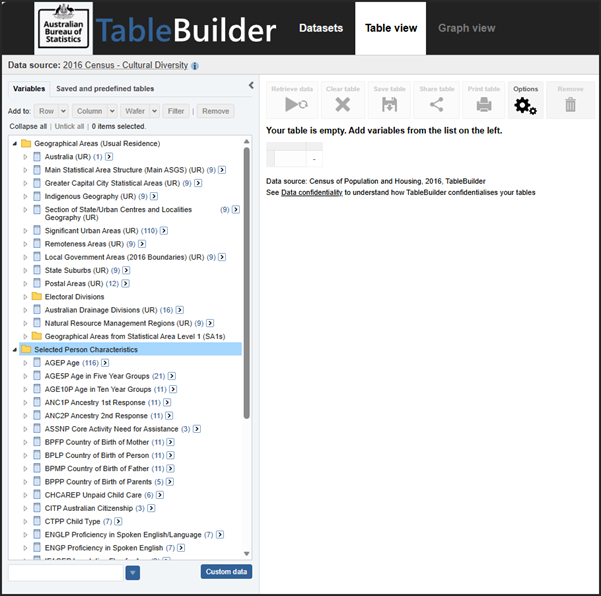
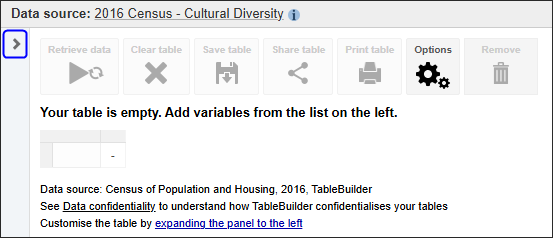
This opens the Table view where you can build and modify tables. There are two panels:
- the left panel shows the variables and categories that can be added to your table
- the right panel is where you build your table
Add variables and categories to a table
Variables and categories
When a dataset is opened in Table view, the left panel shows a list of variables and categories included in that dataset that can be added to your table.
- Variables (or data items) are characteristics about the records in the dataset. For example, Age or Indigenous status (variables) are characteristics about people (records). There may be multiple similar variables in a dataset, such as Age in single years and Age in 5 year groupings.
- Categories are the responses to the questions that have been provided by the respondent. Each variable has multiple categories. For example, the categories of the variable Age in single years may be 0, 1, 2, 3 etc. Categories must be complete (include options for all possible responses) and mutually exclusive (not overlap).
Related variables are grouped together in folders. Click on the folders to view the available variables and categories.
Show and hide left panel
In most cases, when you are in the Table view the left panel is already open. To hide the left panel select the < arrow at the top of the menu. To show it again select the > arrow.
Hide left panel
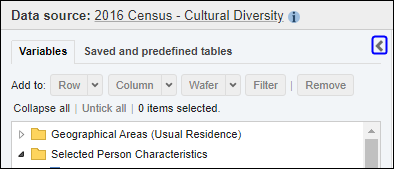
Show left panel
Rows, columns, wafers and filters
To create a table, select a variable from the list in left panel and add it to the table in the rows, columns, wafers, or filters.
- Rows are horizontal displays of data, with the row headings appearing down the left side of the table.
- Columns are vertical displays of data, with the column headings appearing across the top of the table.
- Wafers are where data is displayed in multiple layers of a table. This can be a useful option for including a time or geography variable for example. When tables using wafers are exported or downloaded to a spreadsheet, each wafer appears on a different tab (if you download in xlsx format). Wafers may also be called layers or sheets.
- Filters are used to limit the data in a table to only display data for specific variable categories. For example, by including New South Wales in a filter, the table results displays counts for New South Wales only, rather than the whole of Australia. See Add and remove a filter.
Selecting variables and categories
There are three ways to select variables or categories to be added to a table:
- Open the variable folder in the left panel and click in the tick boxes for the categories. Use the Add to Row, Column, Filter or Wafer buttons at the top of the left panel. This option is useful for selecting a few categories of a variable. You can also use Shift-click to select multiple categories at once.
- Drag the variable or category name to the right. A pop-up menu appears with options for adding to Column, Row or Wafer. Dropping the variable onto one of these options selects all categories of the variable at once. Dropping a category adds that category only.
- Click the arrow at the end of the variable name to show the Select a level drop-down list. Click on the variable in the drop-down list to select all categories of the variable at once. Hierarchical variables may have multiple options for selection, e.g. Age in 10 year ranges, Age in 5 year ranges and Age in single years. Then use the Add to Row, Column, Filter or Wafer buttons at the top of the panel.
Using the 2016 Census - Cultural Diversity dataset we create a table with Age in Ten Year Groups in the rows and Registered Marital Status in the columns.
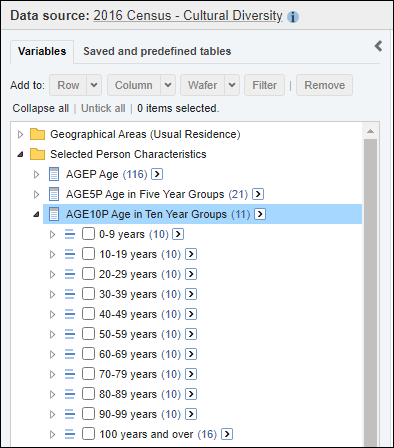
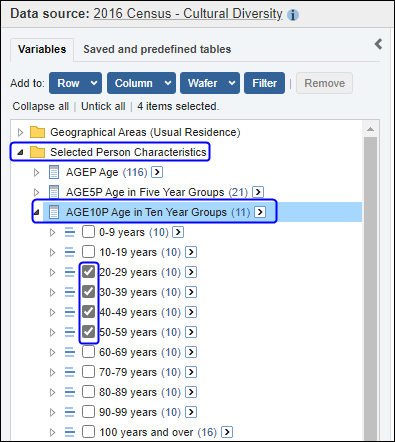
1. In the left panel, click the Selected Person Characteristics folder to expand the list of available variables.
2. Expand the Age in Ten Year Groups folder to see the list of categories.
3. Select the tick boxes next to the categories to be added to the table, in this example 20-29, 30-39, 40-49, 50-59.
4. Click the add to Row button.
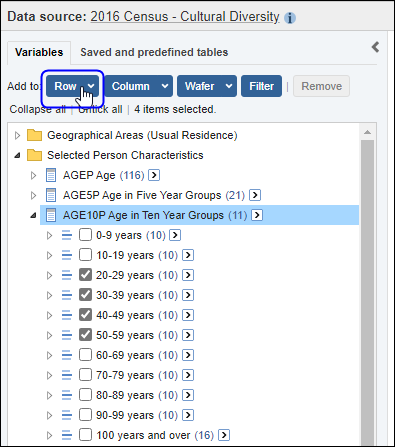
5. TableBuilder adds the selected categories to the table. Categories that are in your table are shown in bold in the left panel.
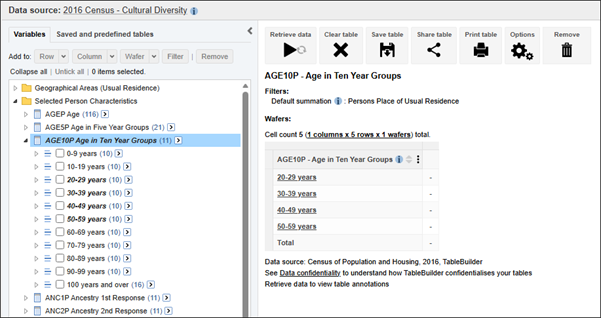
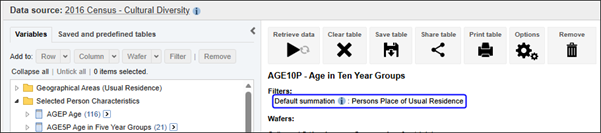
6. When the first variable is added to the table, TableBuilder also adds a default summation (what the table is counting). For 2016 Census - Cultural Diversity dataset, the default summation is counting the number of persons at their place of usual residence. See Understanding what is being counted in a table and Summation options for continuous variables sections for more detail on summation.
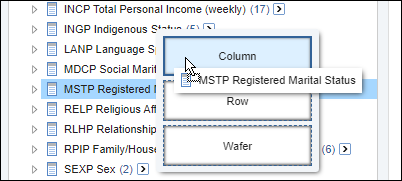
7. Next, add the Registered Marital Status variable to the column headings. Using the drag and drop shortcut, all the available categories in a particular variable can be added to the table. The Column, Row and Wafer pop-up menu appears. Drop onto Column.
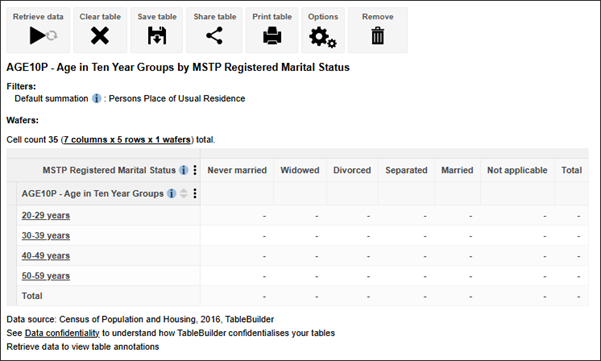
8. TableBuilder adds all the available categories from Marital Status to the column headings.
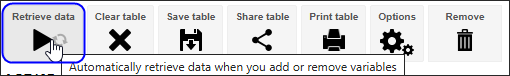
Retrieving data
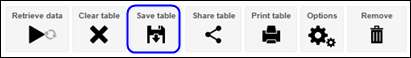
Once you have finished building your table structure, press the Retrieve data button.
The following datasets cannot be previewed on-screen. You will need to use the Download table button, located on the top right of your screen, to download and view the data:
- BLADE
- Labour Force Survey
- Jobs in Australia
- Jobs and Income of Employed Persons (all years).
Your table has been tabulated but your table structure has not yet been saved. If you also want to save your table structure so that you can modify or retrieve the data again it in the future, you also need to use the Save table button
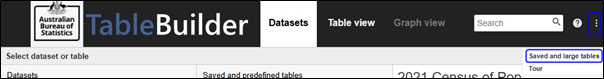
From the Saved and large tables view, you can also click on View to open a table structure again and make further changes.
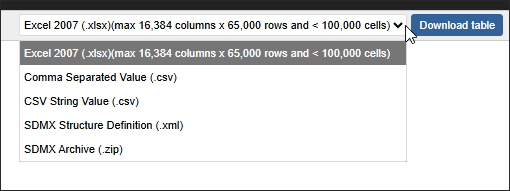
Tables can be downloaded in the following formats:
- Excel 2007 (.xlsx) (max 16,384 columns x 65,000 rows and < 100,000 cells)
- Comma Separated Value (.csv)
- CSV string value (.csv)
- SDMX Structure Definition (.xml)
- SDMX Archive (.zip)
'Select a level' drop-down list
Another way to add a variable to a table is to use the 'Select a level below' in the drop-down list to quickly select all categories. This is useful when there are a large number of categories or for hierarchical variables.
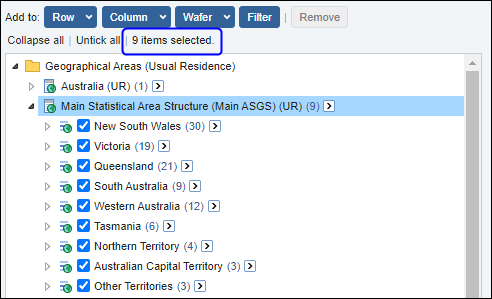
1. Click the arrow to the right of the variable. A drop-down list displays. Main Statistical Area Structure (Main ASGS) is a hierarchical variable so there are multiple options (levels) that you can choose. These are always displayed in descending order, with the smallest categories last.
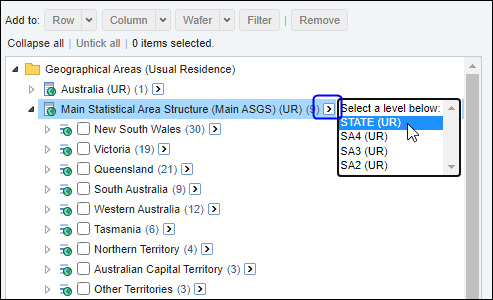
2. Selecting State from the drop-down list includes all the available categories at this level in the hierarchy. When the Main Statistical Area Structure variable is expanded you can see that TableBuilder has selected all the available categories at this level in the hierarchy. At the top of the hierarchy TableBuilder indicates the number of categories are currently selected (in this case, 9 categories).
3. Click the Add to Row button. TableBuilder adds all the selected categories to the row headings.
Shift-click to select multiple variable categories
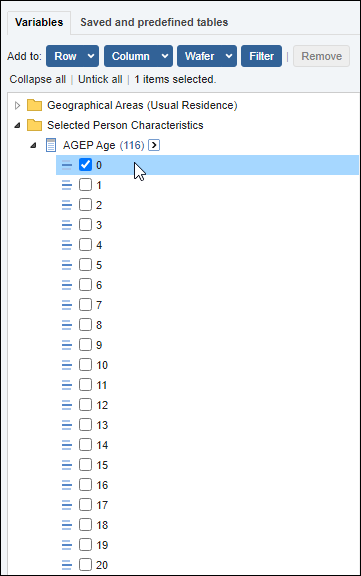
Another way to quickly select multiple categories is to use Shift-click. This selects all categories between your first and last selection. This example adds all categories of the Age variable from 0 to 18.
1. In the left panel, expand the Age variable and select the first category in your range (in this case, 0).
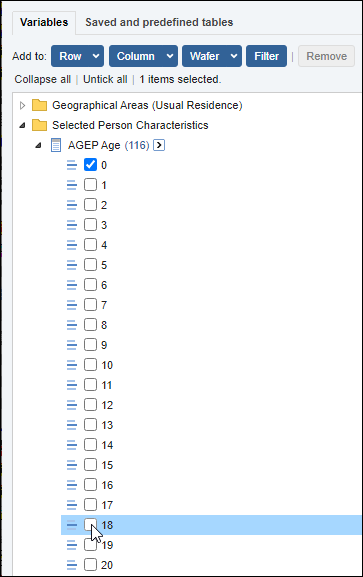
2. Hold down the Shift key and click the last category in the range (in this case, 18).
3. TableBuilder automatically selects all the categories in between.
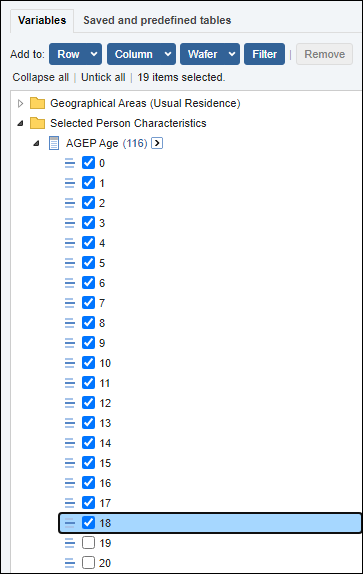
4. Click Add to Row or Add to Column to add the categories to the table, or click and drag the selected categories to the right into the Column, row, wafer pop-up menu.
Move a variable to a different axis
To swap the columns, rows and wafers, drag and drop the variable names within the table.
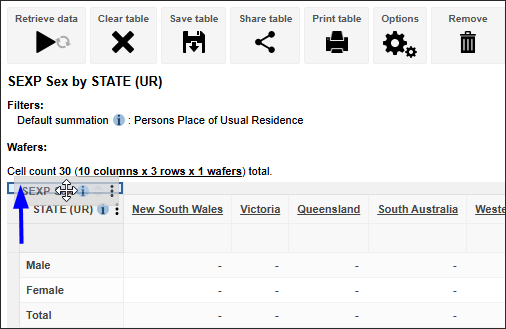
1. Starting with a table with Sex in the rows and state in the columns, drag and drop the Sex variable name onto the column headings. Drop the variable once the column header area turns blue.
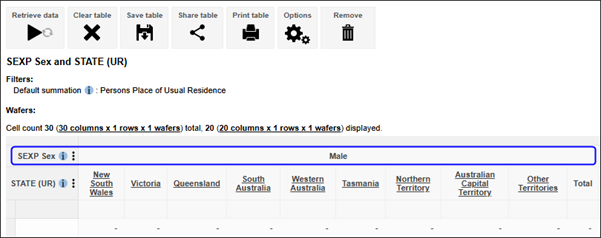
2. This adds Sex to the column headings. As there are now two variables in the columns, Sex and State are displayed as nested variables. For more information about nesting, see Add multiple variables to rows, columns or wafers.
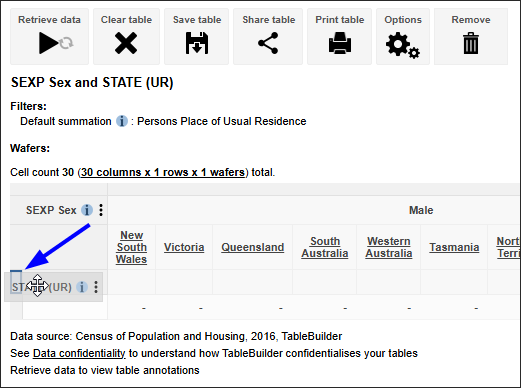
3. Now drag the State variable name onto the row. Drop the variable once the row header area turns blue.
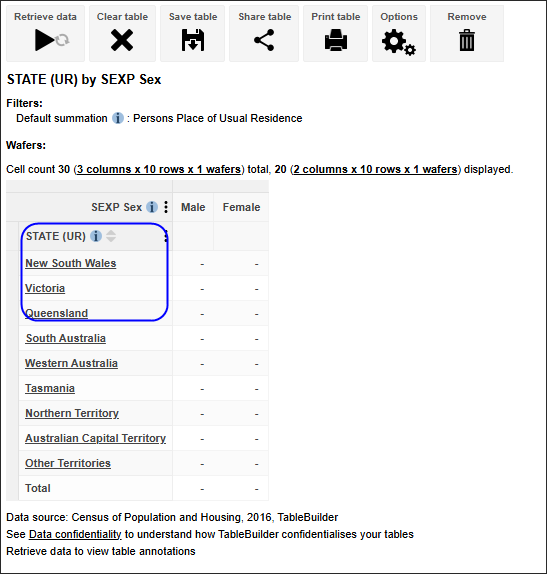
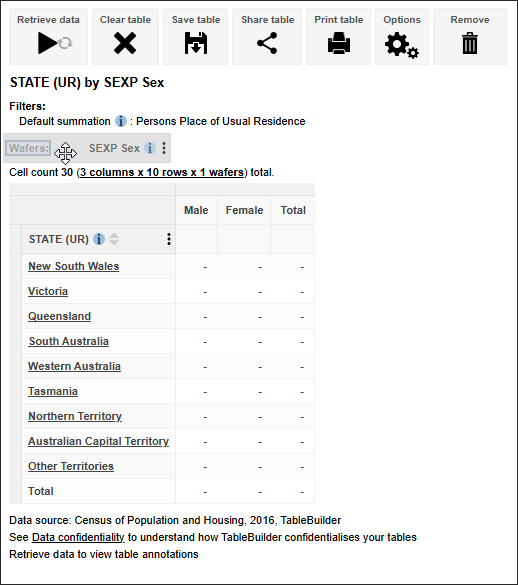
4. The table updates to show State in the rows.
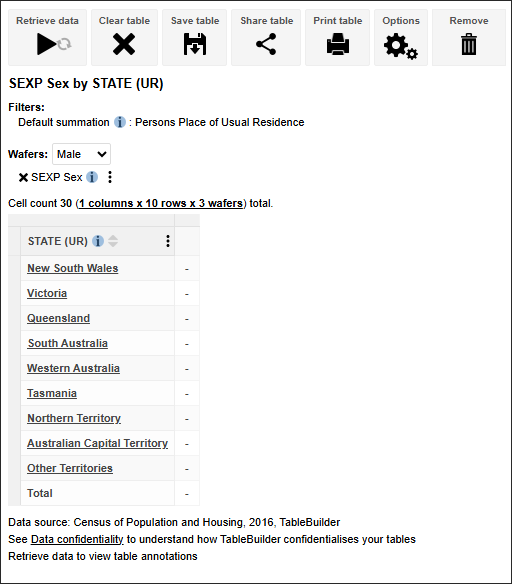
5. Variables can also be dragged and dropped to the Wafer area.
6. The table shows Sex in the Wafer and State in the rows. For more information on wafers see Add a variable to wafers.
7. Click on Retrieve data to tabulate your table
Remove a variable
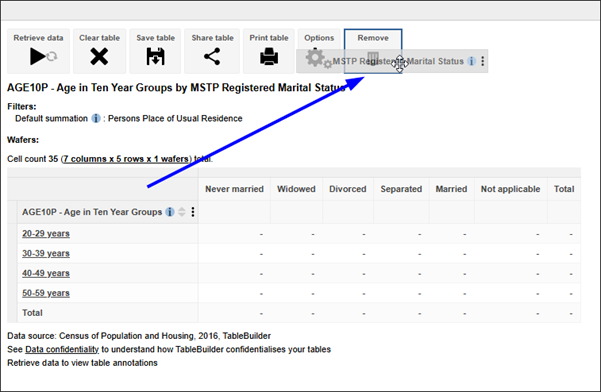
You can remove an entire variable from the table by dragging and dropping the variable name onto the Remove icon above the table. You can drag and drop variables to Remove from rows, columns or wafers.
1. Drag and drop the Marital Status variable name onto Remove.
2. TableBuilder removes the entire variable from the table.
Remove categories
Instead of removing an entire variable, you can use the Remove button at the top of the left panel to remove one or more categories. If categories that have been removed are subsequently re-added, they appear in the order that they were added, not their original order.
For example to remove all the categories of the Marital Status variable from the table:
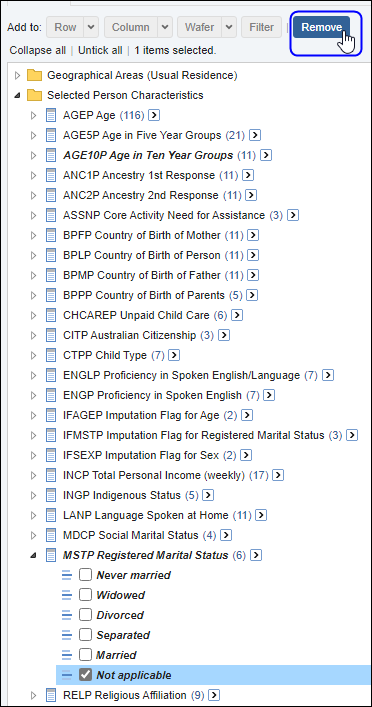
1. Click the folder icon to expand Marital Status. The categories that are currently in the table appear in bold (in this case, all the categories are in the table).
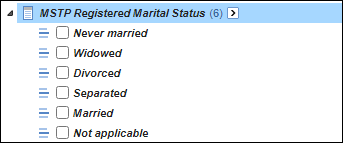
2. Select the tick boxes for the categories to be removed from the table (for example Not applicable)
3. Click Remove. TableBuilder removes these categories from the table.
Clear the table
You can remove all variables from your table by using the Clear table button.
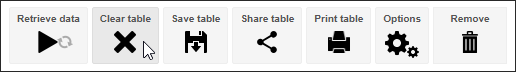
1. Click the Clear table icon.
2. TableBuilder confirms the deletion of the table. Click OK. TableBuilder clears the table.
Change datasets
To choose a different dataset, click the Datasets tab in the header menu. This returns you to the TableBuilder home page.
If you can't see the dataset you are interested in, your organisation may not have subscribed to that data series:
- Check which datasets your organisation has access to in Registration Centre, using the same user ID and password that you use for TableBuilder.
- To subscribe to additional data series, see How to access.
- For a list of all data series and datasets, see Topics.
Opening another dataset clears the current table. If you want to use the current table again, save the table before switching datasets.