Quantitative and qualitative data
Quantitative and qualitative data
Quantitative = Quantity
Quantitative data are
- measures of values or counts and are expressed as numbers.
- data about numeric variables (e.g. how many, how much or how often).
Qualitative = Quality
Qualitative data are
- measures of 'types' and may be represented by a name, symbol, or a number code.
- Qualitative data are data about categorical variables (e.g. what type).
Data collected about a numeric variable will always be quantitative and data collected about a categorical variable will always be qualitative. Therefore, you can identify the type of data, prior to collection, based on whether the variable is numeric or categorical.
Importance of quantitative and qualitative data
Quantitative and qualitative data provide different outcomes, and are often used together to get a full picture of a population. For example, if data are collected on annual income (quantitative), occupation data (qualitative) could also be gathered to get more detail on the average annual income for each type of occupation.
Quantitative and qualitative data can be gathered from the same data unit depending on whether the variable of interest is numerical or categorical.
| Data unit | Numeric variable = Quantitative data | Categorical variable = Qualitative data | ||
|---|---|---|---|---|
| A person | "How many children do you have?" | 4 children | "In which country were your children born?" | Australia |
| "How much do you earn?" | $60,000 p.a. | "What is your occupation?" | Photographer | |
| "How many hours do you work?" | 38 hours per week | "Do you work full-time or part-time?" | Full-time | |
| A house | "How many square metres is the house?" | 200 square metres | "In which city or town is the house located?" | Brisbane |
| A business | "How many workers are currently employed?" | 264 employees | "What is the industry of the business?" | Retail |
| A farm | "How many milk cows are located on the farm?" | 36 cows | "What is the main activity of the farm?" | Dairy |
Using quantitative and qualitative data
It is important to identify whether the data are quantitative or qualitative as this affects the statistics that can be produced.
Frequency counts
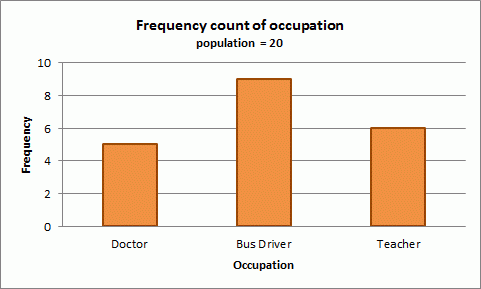
The number of times an observation occurs (frequency) for a data item (variable) can be shown for both quantitative and qualitative data.
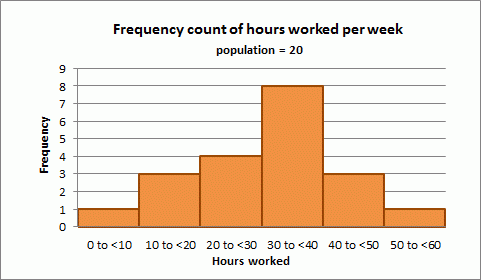
The graphs below arrange the quantitative and qualitative data to show the frequency distribution of the data.
Quantitative data
Image

Description
Qualitative data
Image

Description
As absolute frequencies can be calculated on quantitative and qualitative data, relative frequencies can also be produced, such as percentages, proportions, rates and ratios. 8 people worked < 30 hrs.
Descriptive (summary) statistics
Statistics that describe or summarise can be produced for quantitative data and to a lesser extent for qualitative data.
As quantitative data are always numeric they can be ordered, added together, and the frequency of an observation can be counted. Therefore, all descriptive statistics can be calculated using quantitative data.
As qualitative data represent individual (mutually exclusive) categories, the descriptive statistics that can be calculated are limited, as many of these techniques require numeric values which can be logically ordered from lowest to highest and which express a count.
Mode can be calculated, as it it the most frequency observed value. Median, measures of shape, measures of spread such as the range and interquartile range require an ordered data set with a logical low-end value and high-end value. Variance and standard deviation require the mean to be calculated, which is not appropriate for categorical variables as they have no numerical value.
Inferential statistics
By making inferences about quantitative data from a sample, estimates or projections for the total population can be produced.
Quantitative data can be used to inform broader understandings of a population, or to consider how that population may change or progress into the future.
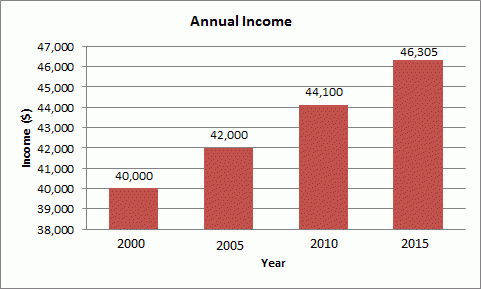
For example, a simple income projection for an employee in 2015 may be inferred from the rate of change for data collected in 2000, 2005, and 2010.
As shown in the graph below, data collected over time indicates a 5% increase every five years. Therefore, if the rate of increase continues to follow the same pattern, it can be projected that the annual income for that employee in 2015 will be $46,305, which is the 2010 wage of $44,100 increased by an additional 5%.
Projected income growth
Image

Description
Qualitative data are not compatible with inferential statistics as all techniques are based on numeric values.