Average earnings guide
Guide to labour statistics
Learn about our average earnings measures and how to use them
Released
7/11/2022
Release date and time
07/11/2022 11:30am AEDT
Overview
Average earnings can be represented as either a median or mean value.
While the mean is the most commonly understood measure of average, median measures are most representative of an "average" employee’s earnings as earnings data has a positively skewed distribution. The mean is higher than the median value because of a small number of people with very high earnings.
The Earnings guide includes information about other earnings measures.
Median weekly earnings
- Most representative measure of the "average" level of earnings.
- Provides the "middle" earnings figure, where half of people earn more than the median earnings value and half earn less than the median earnings value.
- Employee Earnings and Hours, Australia includes median earnings by age, method of setting pay, employment status, occupation and industry.
- Employee earnings includes median earnings by education qualification, main and secondary jobs, and working arrangements.
Personal Income in Australia (and Jobs in Australia) includes median income estimates for small geographic areas.
Mean (average) weekly earnings
- The arithmetic average, calculated by dividing total earnings by the total number of people (or employees).
- Often just referred to as average earnings, however they do not represent the earnings of the "average" person.
- Average Weekly Earnings, Australia includes mean weekly earnings by industry, state/territory and public/private sector.
- Employee Earnings and Hours, Australia includes average hourly total earnings for non-managerial employees in addition to a range of weekly estimates.
- Managerial employees (more likely to have high earnings) are excluded so these EEH estimates are closer to median measures than estimates from AWE.
- Employee earnings includes mean earnings by education qualification, main and secondary jobs, and working arrangements.
- Personal Income in Australia includes average income estimates for small geographic areas.
Earnings distributions
- Give more detail than average measures by providing information on the range of earnings of the population.
- Refer to the level of earnings at which a certain percentage of people earn more or less than that value.
- For example, 50% of people earn more and 50% earn less than the median (midpoint) value, 75% earn more than the 1st (of 4) quartile and 25% earn less, 10% earn more than the 9th (of ten) decile and 90% earn less.
- Employee Earnings and Hours, Australia provides robust estimates by full-time/part-time status, method of setting pay, occupation and industry.
- Employee earnings provides earnings distribution data by education qualification, working arrangements and main job.
- Personal Income in Australia provides income distributions for small geographic areas.
Distribution of weekly total cash earnings (Original)
Image
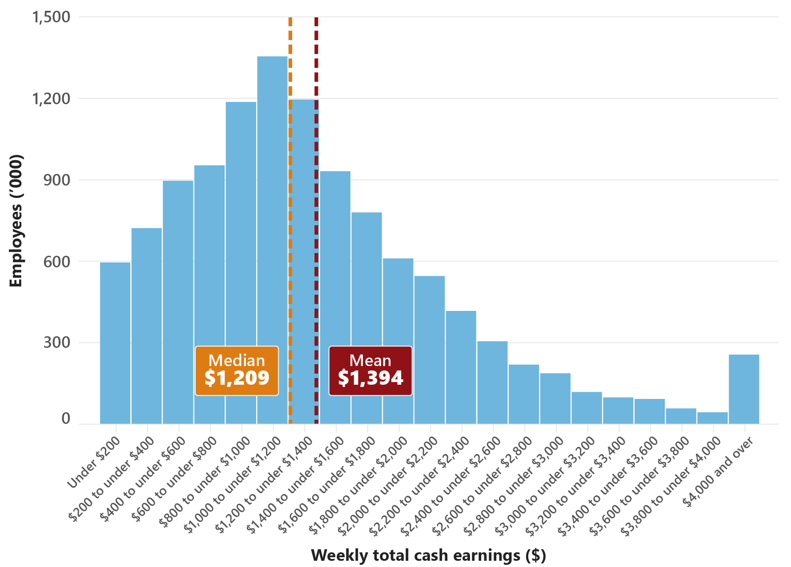
Description
The image is a graph showing the distribution of weekly total cash earnings. Starting with under $200, the number of employees in each earning bracket increases, then peaks at $1000 to under $1200 bracket. After this, the number of employees drops off significantly, before showing an increase for employees earning $4000 and over. The graph also shows median weekly total cash earnings is $1209 and mean weekly total cash earnings is $1394.