Schools

This is not the latest release View the latest release

Data on students, staff, schools, rates and ratios for government and non-government schools, for all Australian states and territories

Reference period
2021
Released
23/02/2022

Key statistics

In Australia in 2021:

  • 4,030,717 students were enrolled in 9,581 schools.
  • the Year 7/8 to 12 full-time apparent retention rate was 83.1%.
  • the average student to teaching staff ratio for all schools was 13.3 students to one teacher.
  • the annual growth rate for school enrolments was 0.6% (23,743 students), the lowest growth rate since 2008.

COVID-19 in this publication

The census date for the National Schools Statistics Collection is held the first Friday of August each year. For 2021, the census enrolment reference date was 6 August.

Due to the COVID-19 pandemic, various restrictions were in place at this time, which may impact on the data.
While the majority of schools across Australia continued as normal, initiatives to help reduce the spread of COVID-19 in the community were put in place, including the implementation of remote online learning where required.

Overall, due to the way the collection counts enrolment it is estimated that the impacts of COVID-19 on the quality of the data were minor. COVID-19 however may have impacted overall school enrolments in 2021, including the reduction in Full Fee Paying Overseas Students (FFPOS) numbers, as shown in the Students section of this publication.

For the collection, a student is a person who is formally (officially) enrolled or registered at a school and who is also active in a primary, secondary or special education program at that school. Students were considered to be active in an education program, even if that program had been temporarily disrupted by COVID-19. Education programs included those that may have been temporarily delivered online or remotely due to COVID-19 disruptions. Students were included even if on census day the school was not delivering education programs due to COVID-19. 

Schools which were temporarily closed due to COVID-19 related reasons were considered to be operating for the purposes of the collection. This included schools ceasing operations due to COVID-19 restrictions, with teachers and staff not working, no students attending and no remote learning delivered. Schools were included in the census if, before the restrictions came into effect, they had students who were enrolled and involved in an active course of study, who meet all other eligibility criteria, and who would have otherwise been included in the census.

See Methodology for more information on Schools, Australia 2021.
Students

In 2021:

  • 4,030,717 students were enrolled in schools across Australia, representing 23,743 more students (0.6%) than 2020.
  • government schools held the greatest share of enrolments (65.1%), followed by Catholic schools (19.5%) and independent schools (15.4%).

Total student enrolments have continued to increase in the five years to 2021, with a 4.7% increase. Independent schools had the largest increase with 11.4%, followed by government schools with 3.9% and Catholic schools with 2.6%.

Table 1. Student enrolments by school affiliation, Australia, 2017 to 2021
 202120202019201820172017-21 (% change)
Government2,622,7552,629,1432,594,8302,558,1692,524,8653.9
Catholic787,181778,605769,719765,735766,8702.6
Independent620,781599,226584,262569,930557,49011.4
TOTAL4,030,7174,006,9743,948,8113,893,8343,849,2254.7


The highest annual growth rates of student enrolments in 2021 were in:

  • Australian Capital Territory: 1.5%
  • Western Australia: 1.5%
  • Queensland: 1.1%.

The lowest was in the Northern Territory (-0.6%).

Population growth rates for 5 to 19 year olds in 2021 showed a similar pattern: 

  • Australian Capital Territory: 1.2%
  • Western Australia: 1.2%
  • Queensland: 0.7%.

The lowest were in Tasmania (-0.2%) and Victoria (-0.1%).

In 2021, the annual growth rate for school enrolments was 0.6% (23,743 more students), the lowest growth rate since 2008:

  • government school enrolments experienced a fall of 0.2% (6,388 fewer students).
  • non-government school enrolments experienced an increase of 2.2% (30,131 more students).


Primary school student enrolments dipped slightly, with 836 fewer students enrolled compared with the year before (a change of 0.0%):

  • government primary school enrolments decreased -0.8% (13,368 fewer students).
  • non-government primary school enrolments increased 1.9% (12,532 more students).


Secondary school student enrolments increased by 24,579 students (a change of 1.4%):

  • government secondary school enrolments increased 0.7% (6,980 more students).
  • non-government secondary school enrolments grew by 2.5% (17,599 more students).

The lower growth rate for school enrolments in 2021 compared with previous years is not unexpected given the 2021 Estimated Residential Population figures for 5-19 year olds (see National, state and territory population, June 2021).  In the 2020-21 financial year, overseas migration was a net loss of 88,000, the first loss since 1946 (see Overseas Migration, Australia 2020-21).


Furthermore, there was a reduction in Full-Fee Paying Overseas Student (FFPOS) enrolments in 2021, falling 24.5% (5,480 students) from 2020 and 36.5% (9,696 students) since 2019. 

  • FFPOS numbers are collected in the National Schools Statistics Collection (NSSC) but not published in the Schools, Australia data cubes.
  • The above calculations exclude the FFPOS numbers for Northern Territory government schools, as 2019 and 2020 data unavailable in the NSSC. Graph 5 does include Northern Territory government schools FFPOS data for 2021.

Data unavailable for Northern Territory government schools in 2019 and 2020.

The proportion of students enrolled in non-government schools in 2021 was:

  • highest in the Australian Capital Territory (38.7%) and South Australia (36.5%)
  • lowest in the Northern Territory (25.8%)
  • lower for students enrolled in schools in very remote areas (13.0%) than for remote areas (21.4%), outer regional areas (27.0%), inner regional areas (34.7%) and major cities (36.3%).

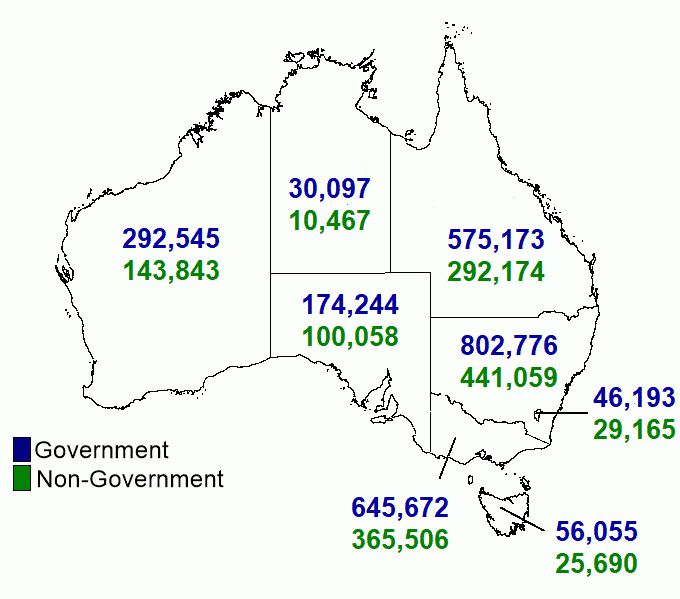
Map 1. Student enrolment counts by state and territory and school affiliation, 2021

A map of Australia showing student enrolment counts by state and territory and school affiliation for 2021

Map 1. Student enrolment counts by state and territory and school affiliation, 2021

A map of Australia showing student enrolment counts by state and territory and affiliation for 2021. Western Australia 292,545 Government student enrolments; 143,843 Non-Government enrolments. Northern Territory 30,097 Government student enrolments; 10,467 Non-Government enrolments. South Australia 174,244 Government student enrolments; 100,058 Non-Government enrolments. Victoria 645,672 Government student enrolments; 365,506 Non-Government enrolments. Tasmania 56,055 Government student enrolments; 25,690 Non-Government enrolments. Australian Capital Territory 46,193 Government student enrolments; 29,165 Non-Government enrolments. New South Wales 802,776 Government student enrolments; 441,059 Non-Government enrolments. Queensland 575,173 Government student enrolments; 292,174 Non-Government enrolments.

Retention rates

In 2021:

  • the Year 7/8 to 12 full-time apparent retention rate for Australia decreased slightly to 83.1%, from 83.6% in 2020.
  • the apparent retention rate for females (87.6%) was higher than for males (78.7%).

In 2021:

  • South Australia had the highest apparent retention rate at 91.1%, and the Northern Territory had the lowest at 56.8%.
  • independent schools had the highest apparent retention rate (94.7%), followed by Catholic schools (81.5%) and government schools (80.0%).

Aboriginal and Torres Strait Islander students

In 2021:

  • there were 249,103 Aboriginal and Torres Strait Islander students enrolled in Australian schools, 3.7% more than in 2020.
  • Aboriginal and Torres Strait Islander students accounted for 6.2% of all students.
  • four in five (82.9%) Aboriginal and Torres Strait Islander students were enrolled in government schools.
  • the Year 7 to 12 full-time apparent retention rate for Aboriginal and Torres Strait Islander students was 59.0%. This is 10.3 percentage points more than a decade ago (48.7% in 2011). The 2021 rate is a slight decrease from 59.6% in 2020. 
  • the Northern Territory had the highest proportion of Aboriginal and Torres Strait Islander students at 39.0%.

Schools

In 2021:

  • there were 9,581 schools in Australia. This represents a net increase of 39 schools since 2020, comprised of 17 government and 22 independent schools.
  • Victoria reported the largest increase in total school counts (13 schools), followed by Queensland (12 schools), New South Wales and Western Australia (5 schools each).
Table 2. School counts by state and territory, 2020 to 2021
 NSWVic.QldSAWATas.NTACTAust
20213,1122,2671,7827161,1132641911369,581
20203,1072,2541,7707151,1082621901369,542


Staff

In 2021:

  • there were 303,539 full-time equivalent (FTE) teaching staff in Australian schools, of which 85,316 were male and 218,224 were female.
  • there were 156,041 teachers in primary schools, and 147,498 teachers in secondary schools.
  • there was a higher proportion of male teachers in secondary schools (38.8%) than primary schools (18.0%).

The student to teaching staff ratio for all schools in 2021 was 13.3 students to one teacher, and was higher in primary schools (14.5 students to one teacher) than secondary schools (11.9 students to one teacher).

Independent schools had a lower student to teacher ratio in 2021 (11.8 students to one teacher) than government and Catholic schools (13.6 students to one teacher).

Data downloads

Table 32a Non-special Schools by Primary Enrolment, 2004-2021

Table 33a Non-special Schools by Secondary Enrolment, 2004-2021

Table 35b Counts of all Schools, 2010-2021

Table 36a Non-special Schools by Enrolment Size Ranges, 2015-2021

Table 42b Number of Full-time and Part-time Students, 2006-2021

Table 43a Full-time Equivalent Students, 2006-2021

Table 46a Students (FTE) by ASGS Remoteness Indicator, 2021

Table 50a In-school Staff (Number), 2006-2021

Table 51a In-school Staff (FTE), 2006-2021

Table 53a Student (FTE) to Teaching Staff (FTE) Ratios, 2006-2021

Table 57a Out-of-school Staff (Number and FTE), 2015-2021

Table 62a Capped Apparent Continuation Rates, 2011-2021

Table 63a Capped Apparent Retention Rates by Single Year (Grade), 2011-2021

Table 64a Capped Apparent Retention Rates, 2011-2021

Table 64b Capped Apparent Retention Rates (FTE), 2013-2021

Table 66a Capped School Participation Rates for Students Aged 6-19 Years, 2011-2021

Table 67a Consolidated Student Rates, 2011-2021

Table 90a Key Information, by States and Territories, 2020 to 2021

All Data Cubes

Previous catalogue number

This release previously used catalogue number 4221.0.

Back to top of the page