Overseas Arrivals and Departures, Australia

This is not the latest release View the latest release

Statistics on international travel, including tourism trips, arriving in and departing from Australia. Focusing on short-term trips (less than 1 year)

Reference period
February 2020
Released
15/04/2020

Key statistics

  • Overseas visitor arrivals decreased 12.5% since the previous month.
  • Australian resident returns decreased 2.9% since the previous month.
  • Overseas visitor arrivals decreased 26.1% since the same month previous year.
  • Australian resident returns increased 5.3% since the same month previous year.

Overseas arrivals and departures statistics are international travel movements of persons arriving in, and departing from Australia with a focus on short term trips (less than 1 year). It is the number of international border crossings rather than the number of people.

The trend estimates have been suspended from February 2020 for all Short-term Visitor Arrivals (STVA) and Short-term Resident Returns (STRR) series due to the impact of the COVID-19 pandemic on international travel. For more information, see the end of the Data Quality Issues Appendix.

February 2020 seasonally adjusted estimates for short-term trips:

  • Overseas visitor arrivals to Australia decreased 12.5% since the previous month to 647,000 trips
  • Australian resident returns from overseas decreased 2.9% since the previous month to 928,500 trips.
     

1.3 Monthly and annual change

  Feb '20Jan '20 to Feb '20
  '000% change
Visitor arrivals — short-term trips  
 Trend     na    na
 Seasonally adjusted647.0-12.5
 Original685.4      ..
Resident returns — short-term trips  
 Trend     na    na
 Seasonally adjusted928.5  -2.9
 Original785.4      ..

na not available - see the end of the Data Quality Issues Appendix.
. . not applicable
 

Visitor arrivals monthly

Statistics on international travel movements of persons arriving in Australia for short term trips (less than 1 year). It is the number of international border crossings rather than the number of people.

The trend estimates have been suspended from February 2020 for all Short-term Visitor Arrivals (STVA) series due to the impact of the COVID-19 pandemic on international travel. For more information, see the end of the Data Quality Issues Appendix.

Key statistics

Visitors arriving in Australia for a short-term trip in February 2020 (original estimates):

  • Decreased 26.1% since the same month previous year
  • Reported New Zealand as the largest source country, accounting for 13% of all visitor arrivals.
     

a. For more information see Methodology 19-33.

Source countries (original estimates)

The three leading source countries for visitor arrivals to Australia in February 2020 were:

  • New Zealand (87,900 trips)
  • UK (84,700)
  • USA (78,300).


a. Includes the United Kingdom, Channel Islands and Isle of Man.
b. Excludes SARs & Taiwan.

Among the top ten source countries, the only annual increase was recorded for:

  • India (15.6%)
     

The highest annual decreases were recorded for:

  • China (-89.7%)
  • Hong Kong (-27.7%)
  • Singapore (-25.3%)
     

2.3 Visitor arrivals - top 10 source countries(a) - annual change

 Seasonally adjustedOriginalFeb '19 to Feb '20
Country of Residence'000'000% change - original
New Zealand117.187.9 -4.7
UK(b)  59.184.7 -0.7
USA  62.378.3 -7.0
Japan  38.443.8 -1.7
India  34.437.5 15.6
Hong Kong  26.025.0-27.7
Singapore  32.224.0-25.3
Canada  15.123.1  -4.2
Germany  15.322.0-16.2
China(c)  19.521.3-89.7

a. Top 10 source countries based on original estimates.
b. Includes the United Kingdom, Channel Islands and Isle of Man.
c. Excludes SARs & Taiwan.
 

State or territory of stay (original estimates)

All travellers are asked their intended address in Australia upon arrival. State or territory of stay statistics are only available from original estimates as seasonally adjusted and trend estimates are only applied to source countries.

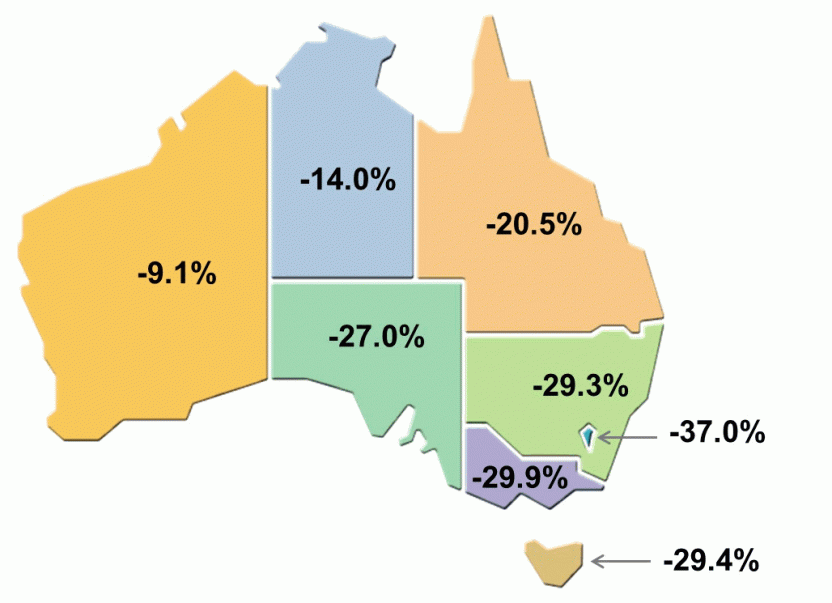
For those who visited Australia in February 2020, compared to the same month of the previous year, there were decreases across all states and territories, the largest being:

  • a decrease of 37.0% fewer visitors to the Australian Capital Territory
  • a decrease of 29.9% fewer visitors to Victoria
  • a decrease of 29.4% fewer visitors to the Tasmania
     

2.4 Visitor arrivals, state or territory of stay - annual change to February 2020 (original estimates)

Map: 2.4 Visitor arrivals, State or territory of stay - Annual change to February 2020 (original estimates)
Map shows growth in visitor arrivals by state or territory in Februrary 2020 compared to the same month of the previous year. Tasmania saw a decrease of 29.4%, Queensland saw a decrease of 20.5%, Western Australia saw a decrease of 9.1%, South Australia saw a decrease of 27%, Northern Territory saw a decrease of 14%, Victoria saw a decrease of 29.9%, New South Wales saw a decrease of 29.3% and Australian Capital Territory saw a decrease of 37%.

2.5 Visitor arrivals, state or territory of stay(a) - annual change to February 2020 (original estimates)

 Feb '19Feb '20Feb '19 to Feb '20
State or territory of stay'000'000% change - original
NSW 357.4  252.7 -29.3
Vic. 259.1  181.5 -29.9
Qld 165.3  131.3 -20.5
SA   30.2    22.1 -27.0
WA   82.5    75.0   -9.1
Tas.   13.3      9.4 -29.4
NT     5.1      4.4 -14.0
ACT   14.4      9.1 -37.0
Australia(b)927.2 685.4-26.1

a. Only available from original estimates.
b. Includes Other Territories.
 

Resident returns monthly

Statistics on international travel movements of residents arriving back in Australia after short term trips (less than 1 year) overseas. It is the number of international border crossings rather than the number of people.

The trend estimates have been suspended from February 2020 for all Short-term Resident Returns (STRR) series due to the impact of the COVID-19 pandemic on international travel. For more information, see the end of the Data Quality Issues Appendix.

Key statistics

In February 2020, Australian residents returning from a short-term trip overseas (original estimates):

  • Increased 5.3% since the same month previous year
  • Reported New Zealand as the most popular destination country, accounting for 16% of all those returning.
     

a. For more information see Methodology 19-33.

Destination countries (original estimates)

The three leading destination countries for Australian residents in February 2020 were:

  • New Zealand (125,100 trips)
  • Indonesia (92.500)
  • USA (59.800).
     

a. Excludes SARs & Taiwan.

Among the top ten destination countries, the highest annual increases were recorded for:

  • Vietnam (30.9%)
  • Indonesia (17.3%)
  • Japan (11.1%).
     

The highest annual decreases were recorded for:

  • China (-13.6%)
  • Thailand (-9.9%)
     

3.3 Resident returns - top 10 destination countries(a) - annual change

 Seasonally adjustedOriginalFeb '19 to Feb '20
Country of stay'000'000% change - original
New Zealand124.2125.1     8.2
Indonesia123.3  92.5   17.3
USA  83.6  59.8    4.0
India  36.6  59.1    3.7
Japan  43.7  55.7  11.1
China(b)  39.8  40.0 -13.6
Vietnam  28.4  34.9  30.9
Thailand  41.2  32.3   -9.9
Malaysia  25.0  27.0    6.8
Philippines  21.2  24.4    9.4

a. Top 10 destination countries based on original estimates.
b. Excludes SARs & Taiwan.
 

State or territory of residence (original estimates)

All travellers are asked their intended address in Australia upon arrival. State or territory of residence statistics are only available from original estimates as seasonally adjusted and trend estimates are only applied to destination countries.

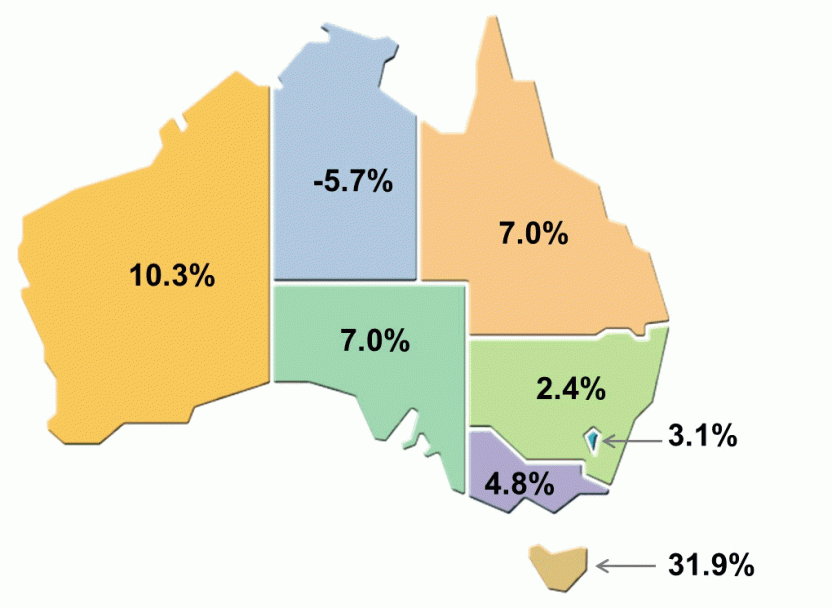
For those residents who returned to Australia in February 2020, compared to the same month of the previous year, there was:

  • an increase of 31.9% travelling home to Tasmania
  • an increase of 10.3% travelling home to Western Australia
  • a decrease of 5.7% travelling home to Northern Territory
     

3.4 Resident returns, state or territory of residence - annual change to February 2020 (original estimates)

Map: 3.4 Resident returns, State or territory of residence - Annual change to February 2020 (original estimates)
Map shows growth in Australian residents who returned to their home state in February 2020, compared to the same month of the previous year. Western Australia saw an increase of 10.3%, Tasmania saw an increase of 31.9%, Queensland saw an increase of 7%, Victoria saw an increase of 4.8%, New South Wales saw an increase of 2.4%, South Australia saw an increase of 7%, the Australian Capital Territory saw an increase of 3.1% and finally the Northern Territory saw a decrease of 5.7%.

3.5 Resident returns, state or territory of residence(a) - annual change to February 2020 (original estimates)

 Feb '19Feb '20Feb '19 to Feb '20
State or territory of residence'000'000% change - original
NSW 254.7 260.9  2.4
Vic. 202.2 211.9  4.8
Qld 133.0 142.3  7.0
SA   31.5   33.7  7.0
WA   95.7 105.610.3
Tas.     5.8     7.731.9
NT     7.6     7.2-5.7
ACT   15.3   15.8  3.1
Australia(b)746.1785.4 5.3

a. Only available from original estimates.
b. Includes Other Territories.
 

Visitor arrivals by state or territory

New South Wales

This series of feature articles provides detail of overseas traveller movements at the state and territory level. The additional information is provided in the context of the outbreak of COVID-19 which started in China in December 2019.

Visitor arrivals statistics are international travel movements of persons arriving in Australia. It is the number of trips rather than the number of people. All data in this article has used original estimates as trend and seasonally adjusted estimates are not available for all variables being analysed.

Key statistics

Visitors arriving in NSW for a short-term trip (less than 1 year) in February 2020:

  • Decreased 29.3% since the same month previous year
  • Largest source countries were USA, UK and New Zealand
  • China decreased 88.7% since the same month previous year
  • India increased 13.8% in the same time period.
     

Of all arrivals to NSW travelling on an international student visa in February 2020, there was a:

  • Decrease of 23,140 students (-37%) compared to the same month in the previous year.
     

Source countries

The three leading source countries for visitor arrivals to NSW in February 2020 were:

  • USA (43,000 trips)
  • UK (29,300)
  • New Zealand (26,500).
     

a. Includes the United Kingdom, Channel Islands and Isle of Man.
b. Excludes SARs & Taiwan.

Among the top ten source countries, the only country to record an annual increase was:

  • India (13.8%).
     

The largest annual decreases were recorded for:

  • China (-88.7%)
  • South Korea (-44.6%)
  • Hong Kong (-27.9%).
     

4.3 Visitor arrivals, NSW - top 10 source countries(a) - annual change - original estimates

  Feb '19 to Feb '20
Country of Residence'000% change
USA43.0  -4.2
UK(b)29.3  -6.9
New Zealand26.5-10.1
Japan12.2  -9.2
India11.2 13.8
Korea, South10.7-44.6
Canada  9.4  -9.2
Hong Kong  9.2-27.9
China(c)  9.2-88.7
Germany  8.7-20.6

a. Top 10 source countries based on original estimates.
b. Includes the United Kingdom, Channel Islands and Isle of Man.
c. Excludes SARs & Taiwan.
 

For additional information relating to COVID-19 see the Notes Section.

International students

The outbreak of COVID-19 which started in China in December 2019, is expected to disrupt the movement of international students, particularly from February, due to the introduction of travel bans. In 2019, China was the largest source country nationally. Educational exports are an important contributor to the Australian economy.

Of all arrivals to NSW travelling on an international student visa in February 2020, there was a decrease of 23,140 students (-37%) compared to the same month in the previous year.

The highest numeric increases were for:

  • the Vocational Education and Training sector, with 190 more students (4%)
  • Student Other (100 more students or 3%).
     

The highest numeric decreases were for:

  • the Higher Education sector, with 22,590 fewer students (-46%)
  • Schools (530 fewer students or -44%)
  • the Postgraduate Research sector (180 fewer students or -12%).
     

a. Includes short-term (less than 1 year) and long-term (1 year or more) visitor arrivals.
b. English Language Intensive Courses for Overseas Students.

Victoria

This series of feature articles provides detail of overseas traveller movements at the state and territory level. The additional information is provided in the context of the outbreak of COVID-19 which started in China in December 2019.

Visitor arrivals statistics are international travel movements of persons arriving in Australia. It is the number of trips rather than the number of people. All data in this article has used original estimates as trend and seasonally adjusted estimates are not available for all variables being analysed.

Key statistics

Visitors arriving in Vic. for a short-term trip (less than 1 year) in February 2020:

  • Decreased 29.9% since the same month previous year
  • Largest source countries were New Zealand, UK and USA
  • China decreased 90.3% since the same month previous year
  • India increased 16.2% in the same period.
     

Of all arrivals to Vic. travelling on an international student visa in February 2020, there was a:

  • Decrease of 20,310 students (-33%) compared to the same month in the previous year.
     

Source countries

The three leading source countries for visitor arrivals to Vic. in February 2020 were:

  • New Zealand (25,900 trips)
  • UK (20,200)
  • USA (15,900).
     

a. Includes the United Kingdom, Channel Islands and Isle of Man.
b. Excludes SARs & Taiwan.

Among the top ten source countries, the largest annual increases were recorded for:

  • India (16.2%)
  • Canada (3.7%)
  • UK (3.0%).
     

The largest annual decreases were recorded for:

  • China (-90.3%)
  • Singapore (-30.7%)
  • Malaysia (-28.9%).
     

5.3 Visitor arrivals, Vic. - top 10 source countries(a) - annual change - original estimates

  Feb '19 to Feb '20
Country of Residence'000% change
New Zealand25.9  -4.8
UK(b)20.2   3.0
USA15.9-17.1
India15.7 16.2
Malaysia  8.0-28.9
Japan  7.5  -2.8
Hong Kong  6.7-27.5
China(c)  6.6-90.3
Singapore  6.3-30.7
Canada  6.2   3.7

a. Top 10 source countries based on original estimates.
b. Includes the United Kingdom, Channel Islands and Isle of Man.
c. Excludes SARs & Taiwan.
 

For additional information relating to COVID-19 see the Notes Section.

International students

The outbreak of COVID-19 which started in China in December 2019, is expected to disrupt the movement of international students, particularly from February, due to the introduction of travel bans. In 2019, China was the largest source country nationally. Educational exports are an important contributor to the Australian economy..

Of all arrivals to Vic. travelling on an international student visa in February 2020, there was a decrease of 20,310 students (-33%) compared to the same month in the previous year.

The highest numeric increases were for:

  • Independent ELICOS (130 more students or 11%)
  • Student Other (100 more students or 5%).
     

The highest numeric decreases were for:

  • the Higher Education sector, with 19,510 fewer students (-38%)
  • the Schools sector, with 880 fewer students (-46%)
  • the Postgraduate Research sector (130 fewer students or -10%).
     

a. Includes short-term (less than 1 year) and long-term (1 year or more) visitor arrivals.
b. English Language Intensive Courses for Overseas Students.

Queensland

This series of feature articles provides detail of overseas traveller movements at the state and territory level. The additional information is provided in the context of the outbreak of COVID-19 which started in China in December 2019.

Visitor arrivals statistics are international travel movements of persons arriving in Australia. It is the number of trips rather than the number of people. All data in this article has used original estimates as trend and seasonally adjusted estimates are not available for all variables being analysed.

Key statistics

Visitors arriving in Qld for a short-term trip (less than 1 year) in February 2020:

  • Decreased 20.5% since the same month previous year
  • Largest source countries were New Zealand, Japan and the UK
  • Germany increased 14.2% since the same month previous year
  • China decreased 92.0% in the same period.
     

Of all arrivals to Qld travelling on an international student visa in February 2020, there was a:

  • Decrease of 8,930 students (-34%) compared to the same month in the previous year.
     

Source countries

The three leading source countries for visitor arrivals to Qld in February 2020 were:

  • New Zealand (26,000 trips)
  • Japan (18,800)
  • UK (12,200).
     

a. Includes the United Kingdom, Channel Islands and Isle of Man.

Among the top ten source countries, the largest annual increases were recorded for:

  • Germany (14.2%)
  • UK (7.1%)
  • India (5.1%).
     

The largest annual decreases were recorded for:

  • Hong Kong (-34.8%)
  • Taiwan (-20.4%)
  • Canada (-12.3)
     

6.3 Visitor arrivals, Qld - top 10 source countries(a) - annual change - original estimates

  Feb '19 to Feb '20
Country of Residence'000% change
New Zealand26.0   0.9
Japan18.8   1.5
UK(b)12.2   7.1
USA10.8  -0.9
Taiwan  5.6-20.4
Korea, South  5.6  -5.8
India  4.7   5.1
Canada  4.5-12.3
Hong Kong  3.8-34.8
Germany  3.3 14.2

a. Top 10 source countries based on original estimates.
b. Includes the United Kingdom, Channel Islands and Isle of Man.
 

For additional information relating to COVID-19 see the Notes Section.

International students

The outbreak of COVID-19 which started in China in December 2019, is expected to disrupt the movement of international students, particularly from February, due to the introduction of travel bans. In 2019, China was the largest source country nationally. Educational exports are an important contributor to the Australian economy.

Of all arrivals to Qld travelling on an international student visa in February 2020, there was a decrease of 8,930 students (-34%) compared to the same month in the previous year.

The highest numeric increases were for:

  • the Vocational Education and Training sector, with 240 more students (13%)
  • Independent ELICOS, with 180 more students (17%)
  • Student Other (50 more students or 3%).


The highest numeric decreases were for:

  • the Higher Education sector, with 9,070 fewer students (-44%)
  • the Schools sector (220 fewer students or -41%).
     

a. Includes short-term (less than 1 year) and long-term (1 year or more) visitor arrivals.
b. English Language Intensive Courses for Overseas Students.

South Australia

This series of feature articles provides detail of overseas traveller movements at the state and territory level. The additional information is provided in the context of the outbreak of COVID-19 which started in China in December 2019.

Visitor arrivals statistics are international travel movements of persons arriving in Australia. It is the number of trips rather than the number of people. All data in this article has used original estimates as trend and seasonally adjusted estimates are not available for all variables being analysed.

Key statistics

Visitors arriving in SA for a short-term trip (less than 1 year) in February 2020:

  • Decreased 27.0% since the same month previous year
  • Largest source countries were the UK, New Zealand and USA
  • China decreased 91.2% since the same month previous year
  • Singapore decreased by 29.8% in the same period.
     

Of all arrivals to SA travelling on an international student visa in February 2020, there was a:

  • Decrease of 2,450 students (-26%) compared to the same month in the previous year.
     

Source countries

The three leading source countries for visitor arrivals to SA in February 2020 were:

  • UK (3,900 trips)
  • New Zealand (2,200)
  • USA (1,600).
     

a. Includes the United Kingdom, Channel Islands and Isle of Man.
b. Excludes SARs & Taiwan.

Among the top ten source countries, the only country to record an annual increase was:

  • India (22.8%).
     

The largest annual decreases were recorded for:

  • China (-91.2%)
  • Singapore (-29.8%)
  • Hong Kong (-21.7).
     

7.3 Visitor arrivals, SA - top 10 source countries(a) - annual change - original estimates

  Feb '19 to Feb '20
Country of Residence'000% change
UK(b)3.9  -3.0
New Zealand2.2-19.6
USA1.6  -9.3
India1.3 22.8
Hong Kong1.3-21.7
Japan1.0-19.8
Malaysia1.0  -6.1
Germany0.8-14.9
Singapore0.7-29.8
China(c)0.7-91.2

a. Top 10 source countries based on original estimates.
b. Includes the United Kingdom, Channel Islands and Isle of Man.
c. Excludes SARs & Taiwan.
 

For additional information relating to COVID-19 see the Notes Section.

International students

The outbreak of COVID-19 which started in China in December 2019, is expected to disrupt the movement of international students, particularly from February, due to the introduction of travel bans. In 2019, China was the largest source country nationally. Educational exports are an important contributor to the Australian economy.

Of all arrivals to SA travelling on an international student visa in February 2020, there was a decrease of 2,450 students (-26%) compared to the same month in the previous year.

The highest numeric increases were for:

  • Independent ELICOS (100 more students or 140%)
  • the Postgraduate Research sector, with 50 more students (27%)
  • Student Other (30 more students or 8%).
     

The highest numeric decreases were for:

  • the Higher Education sector, with 2,510 fewer students (-31%)
  • the Schools sector (140 fewer students or -39%).
     

a. Includes short-term (less than 1 year) and long-term (1 year or more) visitor arrivals.
b. English Language Intensive Courses for Overseas Students.

Western Australia

This series of feature articles provides detail of overseas traveller movements at the state and territory level. The additional information is provided in the context of the outbreak of COVID-19 which started in China in December 2019.

Visitor arrivals statistics are international travel movements of persons arriving in Australia. It is the number of trips rather than the number of people. All data in this article has used original estimates as trend and seasonally adjusted estimates are not available for all variables being analysed.

Key statistics

Visitors arriving in WA for a short-term trip (less than 1 year) in February 2020:

  • Decreased 9.1% since the same month previous year
  • Largest source countries were UK, Singapore and Malaysia
  • Japan increased 46.9% since the same month previous year
  • Malaysia decreased 36.8% in the same period.
     

Of all arrivals to WA travelling on an international student visa in February 2020, there was a:

  • Decrease of 1,970 students (-17%) compared to the same month in the previous year.
     

Source countries

The three leading source countries for visitor arrivals to WA in February 2020 were:

  • UK (17,100 trips)
  • Singapore (6,200)
  • Malaysia (4,800)
     

a. Includes the United Kingdom, Channel Islands and Isle of Man.

Among the top ten source countries, the largest annual increases were recorded for:

  • Japan (46.9%)
  • Indonesia (21.0%)
  • India (19.8%).
     

The largest annual decreases were recorded for:

  • Malaysia (-36.8%)
  • Hong Kong (-20.3%).
     

8.3 Visitor arrivals, WA - top 10 source countries(a) - annual change - original estimates

  Feb '19 to Feb '20
Country of Residence'000% change
UK(b)17.1   2.6
Singapore  6.2-19.3
Malaysia  4.8-36.8
USA  4.8 17.3
New Zealand  4.6   1.2
Japan  3.5 46.9
Indonesia  3.1 21.0
India  3.1 19.8
Germany  2.8-14.6
Hong Kong  2.4-20.3

a. Top 10 source countries based on original estimates.
b. Includes the United Kingdom, Channel Islands and Isle of Man.
 

For additional information relating to COVID-19 see the Notes Section.

International students

The outbreak of COVID-19 which started in China in December 2019, is expected to disrupt the movement of international students, particularly from February, due to the introduction of travel bans. In 2019, China was the largest source country nationally. Educational exports are an important contributor to the Australian economy

Of all arrivals to WA travelling on an international student visa in February 2020, there was a decrease of 1,970 students (-17%) compared to the same month in the previous year.

The highest numeric increases were for:

  • Student Other (350 more students or 56%)
  • Independent ELICOS, with 170 more students (87%).
     

The highest numeric decreases were for:

  • the Higher Education sector, with 2,230 fewer students (-24%)
  • the Vocational Education and Training sector, with 150 fewer students (-17%)
  • the Postgraduate Research sector, with 110 fewer students (-23%).
     

a. Includes short-term (less than 1 year) and long-term (1 year or more) visitor arrivals.
b. English Language Intensive Courses for Overseas Students.

Tasmania

This series of feature articles provides detail of overseas traveller movements at the state and territory level. The additional information is provided in the context of the outbreak of COVID-19 which started in China in December 2019.

Visitor arrivals statistics are international travel movements of persons arriving in Australia. It is the number of trips rather than the number of people. All data in this article has used original estimates as trend and seasonally adjusted estimates are not available for all variables being analysed.

Key statistics

Visitors arriving in Tas. for a short-term trip (less than 1 year) in February 2020:

  • Decreased 29.4% since the same month previous year
  • Largest source countries were New Zealand, Hong Kong and the UK
  • China decreased 91.0% since the same month previous year
  • USA decreased 40.4% since the same month previous year
  • India increased 102.6% in the same period.
     

Of all arrivals to Tas. travelling on an international student visa in February 2020, there was a:

  • Decrease of 990 students (-34%) compared to the same month in the previous year.
     

Source countries

The three leading source countries for visitor arrivals to Tas. in February 2020 were:

  • New Zealand (1,400 trips)
  • Hong Kong (1,100)
  • UK (900).
     

a. Includes the United Kingdom, Channel Islands and Isle of Man.

Among the top ten source countries, the only country to record an annual increase was:

  • India (102.6%)
     

The largest annual decreases were recorded for:

  • USA (-40.4%)
  • Hong Kong (-34.0%)
  • Singapore (-18.8).
     

9.3 Visitor arrivals, Tas. - top 10 source countries(a) - annual change - original estimates

  Feb '19 to Feb '20
Country of Residence'000% change
New Zealand1.4 -10.1
Hong Kong1.1 -34.0
UK(b)0.9   -5.9
USA0.9 -40.4
Japan0.5 -12.9
Singapore0.4 -18.8
India0.4102.6
Germany0.4  -5.9
Canada0.4  -6.1
France0.3  -9.8

a. Top 10 source countries based on original estimates.
b. Includes the United Kingdom, Channel Islands and Isle of Man.
 

For additional information relating to COVID-19 see the Notes Section.

International students

The outbreak of COVID-19 which started in China in December 2019, is expected to disrupt the movement of international students, particularly from February, due to the introduction of travel bans. In 2019, China was the largest source country nationally. Educational exports are an important contributor to the Australian economy.

Of all arrivals to Tas. travelling on an international student visa in February 2020, there was a decrease of 990 students (-34%) compared to the same month in the previous year.

The highest numeric increases were for:

  • Student Other (60 more students or 138%)
  • the Vocational Education and Training sector, with 30 more students (21%).
     

The highest numeric decreases were for:

  • the Higher Education sector, with 970 fewer students (-43%)
  • the Schools sector (120 fewer students or -40%).
     

a. Includes short-term (less than 1 year) and long-term (1 year or more) visitor arrivals.
b. English Language Intensive Courses for Overseas Students.

Northern Territory

This series of feature articles provides detail of overseas traveller movements at the state and territory level. The additional information is provided in the context of the outbreak of COVID-19 which started in China in December 2019.

Visitor arrivals statistics are international travel movements of persons arriving in Australia. It is the number of trips rather than the number of people. All data in this article has used original estimates as trend and seasonally adjusted estimates are not available for all variables being analysed.

Key statistics

Visitors arriving in NT for a short-term trip (less than 1 year) in February 2020:

  • Decreased 14.0% since the same month previous year
  • Largest source countries were USA, UK and Germany
  • Canada increased 247.6% since the same month previous year
  • Germany decreased 49.8% in the same period.
     

Of all arrivals to NT travelling on an international student visa in February 2020, there was a:

  • Decrease of 90 students (-17%) compared to the same month in the previous year.
     

Source countries

The three leading source countries for visitor arrivals to NT in February 2020 were:

  • USA (600 trips)
  • UK (400 trips)
  • Germany (400 trips)
     

a. Includes the United Kingdom, Channel Islands and Isle of Man.

Among the top ten source countries, the largest annual increases were recorded for:

  • Canada (247.6%)
  • Switzerland(104.2%)
  • France (94.2%).
     

The largest annual decreases were recorded for:

  • Germany (-49.8%)
  • Philippines (-15.9%).
     

10.3 Visitor arrivals, NT - top 10 source countries(a) - annual change - original estimates

  Feb '19 to Feb '20
Country of Residence'000% change
USA0.6    8.4
UK(b)0.4  33.0
Germany0.4 -49.8
New Zealand0.4  78.9
India0.3  45.9
Indonesia0.2  84.3
France0.2  94.2
Switzerland0.1104.2
Canada0.1247.6
Philippines0.1-15.9

a. Top 10 source countries based on original estimates.
b. Includes the United Kingdom, Channel Islands and Isle of Man.
 

For additional information relating to COVID-19 see the Notes Section

International students

The outbreak of COVID-19 which started in China in December 2019, is expected to disrupt the movement of international students, particularly from February, due to the introduction of travel bans. In 2019, China was the largest source country nationally. Educational exports are an important contributor to the Australian economy.

Of all arrivals to NT travelling on an international student visa in February 2020, there was a decrease of 90 students (-17%) compared to the same month in the previous year.

The highest numeric increases were for:

  • the Vocational Education and Training sector (20 more students or 40%)
  • Student Other, with 20 more students ( 85%).
     

The highest numeric decreases were for:

  • the Higher Education sector, with 100 fewer students (-24%)
  • the Postgraduate Research sector (30 fewer students or -76%)
     

a. Includes short-term (less than 1 year) and long-term (1 year or more) visitor arrivals.
b. English Language Intensive Courses for Overseas Students.

Australian Capital Territory

This series of feature articles provides detail of overseas traveller movements at the state and territory level. The additional information is provided in the context of the outbreak of COVID-19 which started in China in December 2019.

Visitor arrivals statistics are international travel movements of persons arriving in Australia. It is the number of trips rather than the number of people. All data in this article has used original estimates as trend and seasonally adjusted estimates are not available for all variables being analysed.

Key statistics

Visitors arriving in ACT for a short-term trip (less than 1 year) in February 2020:

  • Decreased 37.0% since the same month previous year
  • Largest source countries were China, USA and New Zealand
  • China decreased 82.9% since the same month previous year
  • Hong Kong increased 68.1% in the same period.
     

Of all arrivals to ACT travelling on an international student visa in February 2020, there was a:

  • Decrease of 4,710 students (-61%) compared to the same month in the previous year.
     

Source countries

The three leading source countries for visitor arrivals to ACT in February 2020 were:

  • China (1,000 trips)
  • USA (900)
  • New Zealand (800).
     

a. Excludes SARs & Taiwan.
b. Includes the United Kingdom, Channel Islands and Isle of Man.


Among the top ten source countries, the largest annual increases were recorded for:

  • Hong Kong (68.1%)
  • India (39.7%)
  • New Zealand (27.6%).
     

The largest annual decreases were recorded for:

  • China (-82.9%)
  • USA (-38.8%)
  • Malaysia (-31.6%).
     

11.3 Visitor arrivals, ACT - top 10 source countries(a) - annual change - original estimates

  Feb '19 to Feb '20
Country of Residence'000% change
China(b)1.0-82.9
USA0.9-38.8
New Zealand0.8 27.6
India0.8 39.7
UK(c)0.6-20.2
Hong Kong0.4 68.1
Indonesia0.4   5.7
Canada0.3-17.1
Malaysia0.3-31.6
Japan0.3-27.0

a. Top 10 source countries based on original estimates.
b. Excludes SARs & Taiwan.
c. Includes the United Kingdom, Channel Islands and Isle of Man.
 

For additional information relating to COVID-19 see the Notes Section.

International students

The outbreak of COVID-19 which started in China in December 2019, is expected to disrupt the movement of international students, particularly from February, due to the introduction of travel bans. In 2019, China was the largest source country nationally. Educational exports are an important contributor to the Australian economy.

Of all arrivals to ACT travelling on an international student visa in February 2020, there was a decrease of 4,710 students (-61%) compared to the same month in the previous year.

The highest numeric increase was for:

  • the Vocational Education and Training sector, with 80 more students (51%).
     

The highest numeric decreases were for:

  • the Higher Education sector, with 4,440 fewer students (-68%)
  • the Schools sector, with 230 fewer students (-61%)
  • the Postgraduate Research sector, with 50 fewer students (-20%)
     

a. Includes short-term (less than 1 year) and long-term (1 year or more) visitor arrivals.
b. English Language Intensive Courses for Overseas Students.

International student arrivals - Aust. - Feb 2020

This feature article provides detail of overseas traveller movements at the national level for international student arrivals. The additional information is provided in the context of the outbreak of COVID-19 which started in China in December 2019.

Visitor arrivals statistics are international travel movements of persons arriving in Australia. It is the number of trips rather than the number of people. All data in this article has used original estimates as trend and seasonally adjusted estimates are not available for all variables being analysed.

Key statistics

Of all arrivals to Australia travelling on an international student visa in February 2020, there was a:

  • Decrease of 62,590 students (-34%) compared to the same month in the previous year.
     

International students

The outbreak of COVID-19 which started in China in December 2019, is expected to disrupt the movement of international students, particularly from February, due to the introduction of travel bans. In 2019, China was the largest source country nationally. Educational exports are an important contributor to the Australian economy.

Of all arrivals to Australia travelling on an international student visa in February 2020, there was a decrease of 62,590 students (-34%) compared to the same month in the previous year.

The highest numeric increases were for:

  • Student Other, with 660 more students (7%)
  • the Vocational Education and Training sector (410 more students or 3%)
  • Independent ELICOS (400 more students or 10%).
     

The highest numeric decreases were for:

  • the Higher Education sector, with 61,400 fewer students (-41%)
  • the Schools sector (2,100 fewer students or -43%)
  • the Postgraduate Research sector, with 560 fewer students or -12%.
     

a. Includes short-term (less than 1 year) and long-term (1 year or more) visitor arrivals.
b. English Language Intensive Courses for Overseas Students.

Visitor arrivals annually - 2019

Statistics on travel movements of persons arriving in Australia for short term trips (i.e. less than 1 year). It is the number of international border crossings rather than the number of people.

​​​​​​​Key statistics

Visitors arriving in Australia in 2019 (original estimates).

  • There were 9.5 million visitor arrivals, the highest year on record
  • China was the largest source country with over 1.4 million visitors nationally, largest source for NSW, Vic, SA, Tas. and the ACT
  • There were more visits by women than men. The opposite was true in 2009
  • The main reason for travel was holiday (47%)
  • Nationally, the median duration of stay in Australia was 10 days.
     

​​​​​​​Short-term visitor arrivals

The record annual 9.5 million visitors in 2019 was 3.9 million more than 10 years earlier and 220,300 more than 1 year ago. There has generally been an ongoing increase of visitor arrivals to Australia over recent decades.

  • Peaks were seen during Brisbane Expo in 1988 and the Sydney Olympics in 2000
  • Decreases were experienced during the Asian financial crisis from 1998, the Severe Acute Respiratory Syndrome (SARS) outbreak in 2003 and the Global Financial Crisis (GFC) in 2008.
  • Australia experienced strong increases during 2015 and 2016.
     

Source countries

Residents from nearly every country around the world visited Australia in 2019. China (1.44 million) remained the largest source country for visitor arrivals with New Zealand (1.43 million) in second place. This reflects strong growth in the number of Chinese visitors over the decade, with a 297% increase since 2009. However, this growth has slowed more recently (0.46% from 2018 to 2019) and is likely to decrease in early 2020 due to the coronavirus (COVID-19) outbreak.

a. Top 5 source countries based on year ending December 2019.
b. Includes United Kingdom, Channel Islands and Isle of Man.

Among the top 10 source countries, there was also strong growth from other Asian countries over the last decade.

13.3 Short-term visitor arrivals, Australia - top 10 source countries(a) - 2019 - year ending

 '0002018 to 20192009 to 2019
Country of Residence % change% change
China1439   0.5296.7
New Zealand1434   3.5  30.4
USA  818   3.7  68.9
UK(b)  716 -2.4    4.6
Japan  499   6.2  40.9
Singapore  479   6.8  94.1
India  399 11.6234.4
Malaysia  385 -4.0  88.5
Hong Kong  315   2.1118.6
Korea, South  280 -2.6  51.0

a. Top 10 source countries based on year ending December 2019.
b. Includes United Kingdom, Channel Islands and Isle of Man.
 

​​​​​​​State or territory of stay

All travellers are asked their intended address in Australia upon arrival. The proportion of short-term visitor arrivals by intended state or territory in 2019, were as follows:

  • NSW (37% of all short-term visitors)
  • Vic. (27%)
  • Qld (21%)
  • SA (3%)
  • WA (9%)
  • Tas. (1.0%)
  • NT (0.8%)
  • ACT (1.2%).
     

In 2009 this pattern was slightly different, with more visitors intending to stay in Qld than in Vic. All states and territories recorded growth in international visitors in the ten year period.

At the state and territory level, the mix of source countries varies from that at the national level.

During 2019:

  • China was the leading source country for NSW, Vic., SA, Tas. and the ACT
  • New Zealand provided the most visitors for Qld
  • Singapore for WA
  • The USA for the NT.
     

Ten years earlier in 2009, New Zealand was the leading source country for NSW, Vic., Qld, and Tas. However, the UK was the leading source country for SA and WA, and the USA for the NT and ACT.

Age and sex

There were more visits to Australia by women than men in 2019 (4.9 million women compared with 4.5 million men). The opposite was true in 2009 (2.9 million men and 2.7 million women).

In 2019, men and women visiting Australia had the same median age (40 years). The largest group of visitor arrivals were aged between 25 and 29 years. There were also large numbers of women arriving aged 56 with the largest source country being from China at this age.

Main reason for journey

In 2019, the most frequently stated main reason for journey by short-term visitors to Australia was:

  • holiday (47%)
  • visiting friends and relatives (30%)
  • business (7.1%)
  • education (6.6%).
     

Female visitors were more likely than males to record their main reason for journey as holiday (50% of all females compared with 44% of all males), visiting friends and relatives (33% compared with 27%), and education (6.6% compared with 6.5%). Male visitors, on the other hand were more likely to travel to Australia for business (11% of all males compared with 3% of all females), to attend a convention/conference (4% compared with 3%), and for employment (3% compared with 2%).

Duration of stay

Visitors are asked their intended duration in Australia upon arrival.

During 2019, the median duration of stay in Australia was 10 days. However, this varies between the states and territories and between the numerous source countries. It also varies depending on a traveller's main reason for journey.

In 2019, the median duration of days for those visiting SA and ACT was 16 days, whereas for NSW and Qld it was 10 days. Those from India (with a median duration of stay of 40 days) stated their intention to stay longer than most others but this also varied between the states and territories. Those from Japan only visited for 6 days on average.

13.6 Short-term visitor arrivals, Australia - top 10 source countries(a) by state/territory of stay - median duration of stay - 2019

 NSWVic.QldSAWATas.NTACTAust.(b)
 daysdaysdaysdaysdaysdaysdaysdaysdays
India304930706156616140
UK(c)162020212120191719
China121410301530129012
USA101111131314161010
Hong Kong  9101011  9  9101210
Malaysia  8  9  810  710  811  8
Singapore  7  8  8  9  710  7  9  8
Korea (South)  610  9131010  811  7
New Zealand  5  5  7  710  811  6  7
Japan  6  7  610  6  7  6  7  6
All countries101210161212151610

a. Top 10 source countries are based at the Australia level.
b. Includes Other Territories.
c. Includes United Kingdom, Channel Islands and Isle of Man.
 

The duration of stay of short-term visitors to Australia varied by their reason for journey:

  • Those travelling for employment and education stayed the longest (122 days)
  • visiting friends and relatives (16 days)
  • holiday (9 days)
  • business travellers and those travelling for conventions/conferences stayed the shortest (6 days).

Resident returns annually - 2019

Statistics on travel movements of residents arriving back in Australia after short term trips (i.e. less than 1 year) overseas. It is the number of international border crossings rather than the number of people.

Key statistics

Australian residents returning to Australia in 2019 (original estimates).

  • There were 11.3 million resident returns to Australia from overseas, the highest year on record.
  • New Zealand continued to be the leading destination country for Australians travelling overseas, with nearly 1.5 million trips
  • Indonesia was the leading destination for those living in SA, WA and the NT
  • The main reason for travel was holiday (57%)
  • Nationally, the median duration away was 14 days.
     

Short-term resident returns

The record annual 11.3 million resident trips in 2019 was 5.1 million more than 10 years earlier and 247,500 more than 1 year ago. There has generally been an ongoing increase of Australian residents travelling overseas over recent decades. However, decreases were experienced due to various historical events such as the:

  • early 1990s recession in Australia
  • September 11 terrorist attacks in 2001
  • Bali bombings in 2002
  • Severe Acute Respiratory Syndrome (SARS) outbreak in 2003
  • Global Financial Crisis (GFC) in 2008.
     

Destination countries

Australians travelled across the globe during 2019:

  • New Zealand (1.46 million trips) remained the leading destination country
  • Indonesia moved from fourth to second over the last decade (1.40 million - an increase of 156%)
  • The USA (1.06 million) was the third leading destination but had a lower level than its peak in 2018.
     

a. Top 5 destination countries based on year ending December 2019.
b. Includes United Kingdom, Channel Islands and Isle of Man.

Among the top 10 destination countries, the strongest growth over the last decade was for Australians visiting Asian countries.

14.3 Short-term resident returns, Australia - top 10 destination countries(a) - 2019 - year ending

 '0002018 to 20192009 to 2019
Destination Country % change% change
New Zealand1 463  1.9  43.8
Indonesia1 401  9.4156.4
USA1 056 -3.6  83.2
UK(b)   663  0.0  41.3
China   608  2.4134.9
Thailand   543 -5.2  40.2
Japan   52213.3230.4
India   426  8.6200.2
Singapore   417  0.4  83.3
Fiji   345  0.9  35.8

a. Top 10 destination countries based on year ending December 2019.
b. Includes United Kingdom, Channel Islands and Isle of Man.
 

State or territory of residence

All travellers are asked their intended address in Australia upon arrival. The proportion of short-term resident returns by their state or territory of residence in 2019, were as follows:

  • NSW (34% of all short-term resident returns)
  • Vic. (28%)
  • Qld (18%)
  • SA (5%)
  • WA (12%)
  • Tas. (1.0%)
  • NT (0.9%)
  • ACT (2%).
     

In 2009 this pattern was very similar with a slightly higher proportion of those travelling overseas from NSW (36%), WA (14%), Tas. (1.1%) and NT (1.0%).

At the state and territory level, the mix of destination countries varied from that at the national level.

During 2019:

  • New Zealand was the leading destination country for residents of NSW, Vic., Qld, Tas. and the ACT
  • Indonesia was the leading destination for those from SA, WA and the NT.
     

Ten years earlier in 2009, New Zealand was the leading destination for residents of all state and territories except for WA and the NT (for which Indonesia was the leading destination).

Age and sex

There were more trips taken overseas by Australian men than women in 2019 (5.9 million men compared with 5.4 million women), similar to 2009 (3.3 million men and 2.9 million women).

In 2019, Australian men and women travelling overseas had a similar median age (42 years and 41 years respectively). Among those aged 18 to 30, there were more trips undertaken by women than men.

Main reason for journey

In 2019, the most frequently stated main reason for journey by Australian residents returning home after a short-term trip was:

  • holiday (57%)
  • visiting friends and relatives (26%)
  • business (8%).
     

Female residents were more likely than males to record their main reason as a holiday (61% of all females compared with 54% of all males), visiting friends and relatives (28% compared with 24%), and education (1.3% compared with 1.1%). Male residents were more likely to travel overseas for business (12% of all males compared with 4% of all females), to attend a convention/conference (3% compared with 2%), and for employment (2% compared with 1%).

Duration of stay

For Australian residents returning from overseas their exact duration away is measured.

During 2019, the median duration away for Australians on a short-term trip was 14 days. However, this varies between the states and territories and between the numerous destination countries. It also varies greatly depending on a traveller's main reason for journey.

In 2019, the median duration away overseas for Victorians, South Australians, Tasmanians and those from the ACT was 15 days, whereas for those from WA and the NT it was 12 days. Those travelling to the UK were usually away for an average of 24 days which was longer than all the other top 10 destinations. Those travelling to Fiji were away for 7 days on average.

14.6 Short-term resident returns, Australia - top 10 destination countries(a) by state/territory of residence - median duration of stay - 2019

 NSWVic.QldSAWATas.NTACTAust.(b)
 daysdaysdaysdaysdaysdaysdaysdaysdays
UK(c)242426262331252624
India222523272219252323
China171815171516151717
USA151616171919171616
Japan141514151515151514
Thailand111212121113121212
Indonesia1010  9  9  711  8  9  9
Singapore  8  8  8  9  711  6  8  8
New Zealand  7  7  810121011  8  8
Fiji  7  8  7  7  8  8  8  7  7
All countries141514151215121514

a. Top 10 destination countries are based at the Australia level.
b. Includes Other Territories.
c. Includes United Kingdom, Channel Islands and Isle of Man.
 

The duration of stay of short-term trips by Australian residents going overseas varied by their reason for journey:

  • Those travelling for employment stayed away the longest (24 days)
  • visiting friends and relatives (20 days)
  • education (19 days)
  • holiday (13 days)
  • business travellers stayed the shortest (7 days).
     

Notes

Suspension of trend estimates

The trend estimates have been suspended from February 2020 for all Short-term Visitor Arrival (STVA) and Short-term Resident Return (STRR) series due to the impact of the COVID-19 pandemic on international travel.

The trend series attempts to measure the underlying behaviour in passenger travel movements. This measurement may be significantly affected by unusual influences in the original and seasonally adjusted data, like those currently observed for February 2020. These current influences are expected to continue for the coming months. If the trend estimates were to be calculated without fully accounting for these unusual influences, they would be likely to provide a misleading view of the underlying trend in activity over the longer term.

Appropriate seasonally adjusted estimates can be produced and will continue to be published as usual. The trend estimates will be reintroduced when patterns in the underlying behaviour of passenger travel movements stabilise.

For more details on trend estimates, please see paragraphs 19-33 of the Methodology and the ABS Feature Article: When It's not "Business-as-usual": Implications for ABS Time Series (cat. no. 1350.0 for Aug 2009).

COVID-19 from February 2020

In response to the need for additional data and analysis due to the COVID-19 pandemic, the ABS is releasing a series of feature articles containing additional state and territory level analysis of overseas visitor arrivals over the coming months, as well as national and state and territory information on arrivals of overseas students. See the left hand navigation pane to access information on a specific state/territory or article.

The World Health Organisation (WHO) commenced daily situation reports of the COVID-19 outbreak on 21 January 2020 and identified it as an international health emergency on 30 January. This was less than a month after suspected cases were reported in Wuhan, China. The Australian Government placed travel restrictions on those travelling to Australia initially from mainland China commencing 1 February. Other restrictions from other countries soon followed as the crisis worsened around the globe. Currently, all overseas travel is banned, with few exceptions. For more information, see the Smartraveller page from the Australian government Department of Foreign Affairs and Trade website or the News and Media page at the Australian government Department of Home Affairs website.

In February 2020, visitors arriving in Australia for a short-term trip decreased 26.1% since the same month of the previous year (original estimates). New Zealand was the largest source country for visitors to Australia although it had decreased 4.7% since the previous year.

For Australian residents returning from a short-term trip, there was an increase of 5.3% since the same month of the previous year (original estimates). New Zealand was also the most popular destination country with an increase of 8.2% since the previous year.

Data notes

This release contains overseas movement data which should not be interpreted as 'persons'. See Explanatory Note 7 for more detail.

The statistics in this release have been rounded. See Explanatory Note 36 for more detail.

Inquiries

For further information about these and related statistics, contact the National Information and Referral Service on 1300 135 070. The ABS Privacy Policy outlines how the ABS will handle any personal information that you provide to the ABS.

Data downloads

I-note

  1. The trend estimates have been suspended from February 2020 for all Short-term Visitor Arrivals (STVA) and Short-term Resident Returns (STRR) series due to the impact of the COVID-19 pandemic on international travel. For more information, see the end of the Data Quality Issues Appendix.
  2. For further information about the data, including updates or changes, see the Methodology section of this issue and the related Appendices such as Data Quality Issues.
  3. Short-term arrival movements are based on a sample and are subject to sampling error. See paragraphs 10 and 11 of the Methodology section of this issue.
  4. Occasionally situations occur that necessitate breaks being applied to the trend series. For an overview of the breaks currently included in the trend series, see paragraphs 30-31 of the Methodology section of this issue.

Table 1: total movement, arrivals - category of movement

Table 2: total movement, departures - category of movement

Table 3: short-term movement, visitors arriving - selected countries of residence: trend

Table 4: short-term movement, visitors arriving - selected countries of residence: seasonally adjusted

Table 5: short-term movement, visitors arriving - selected countries of residence: original

Table 6: short-term movement, visitors arriving - intended length of stay and main reason for journey: original

Table 7: short-term movement, residents returning - selected destinations: trend

Table 8: short-term movement, residents returning - selected destinations: seasonally adjusted

Table 9: short-term movement, residents returning - selected destinations: original

Table 10: short-term movements, residents returning - length of stay and main reason for journey: original

Table 11: short-term movement, visitors arriving - state of intended stay: original

Table 12: short-term movement, residents returning - state of intended stay: original

Back to top of the page