National Health Measures Survey

Latest release

Information on biomarkers of chronic disease and nutrition including selected health risk factors

Reference period
2022-24

Key statistics

  • One in fifteen (6.6%) adults had diabetes
  • One in seven (14.2%) adults had indicators of chronic kidney disease, up from 10.8% a decade earlier
  • Almost one in three (30.2%) of adults had an abnormally high total cholesterol level
  • One in five (20.6%) adults had a vitamin D deficiency, down from 23.8% in 2011–12

About the National Health Measures Survey

The National Health Measures Survey (NHMS) 2022–24 was conducted from January 2022 to April 2024 and involved the collection of biomedical samples from participants aged 5 years and over across Australia. The NHMS measured specific biomarkers for chronic disease and nutrition status, from tests on blood and urine samples. 

Some data has been randomly adjusted to avoid the release of confidential data. Discrepancies may occur between sums of the component items and totals. For more information, see the National Health Measures Survey methodology, 2022–24.
Diabetes

Definitions

Diabetes is a chronic condition where the body is unable to produce or effectively use insulin (a hormone that controls blood glucose levels)[1]. If left undiagnosed or poorly managed, diabetes can lead to kidney failure, stroke, limb amputations or blindness[2]. In 2023, diabetes was the sixth leading cause of death in Australia[3].

The NHMS 2022–24 included two tests to measure diabetes:

  • fasting plasma glucose (FPG)
  • glycated haemoglobin (HbA1c).

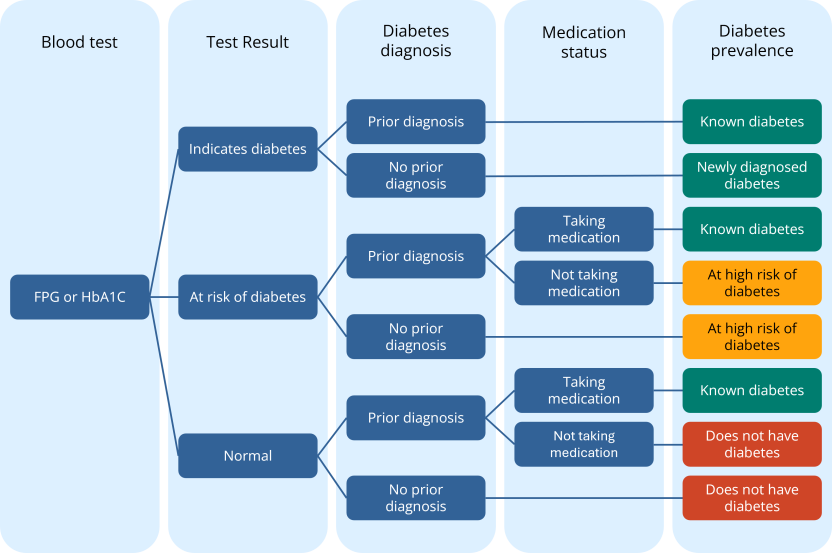
Diabetes prevalence in the NHMS is defined using a combination of blood test results, self-reported diabetes diagnosis and medication use. Using this information, participants are classified as one of the following:

  • known diabetes
  • newly diagnosed diabetes
  • at high risk of diabetes
  • no diabetes.

There were minor differences in prevalence rates when using FPG or HbA1c test results. Results for diabetes prevalence using FPG results are presented only for people who fasted for 8 hours or more prior to their blood test. Results for diabetes prevalence using HbA1c results are presented for all people who gave a blood sample. For more information, see the IHMHS: Concepts, Sources and Methods.

Diabetes prevalence classification

Changes to diabetes diagnosis methods between 2011–12 and 2022–24

The previous NHMS in 2011–12 included tables with diabetes prevalence rates for both FPG and HbA1c tests. The commentary and analysis were based solely on FPG results because FPG was the standard test for diabetes diagnosis in Australia at that time. In 2011–12, based on FPG results, 5.1% of Australians aged 18 years and over had diabetes. This comprised 4.2% with known diabetes and 0.9% with diabetes newly diagnosed from their test results. To see how diabetes data changed between 2011–12 and 2022–24, see Comparing biomedical results over time.

Health professionals now use HbA1c to diagnose diabetes as well as to assess longer term management of diabetes. This provides an alternative to traditional glucose-based methods of diagnosis like FPG[4][5][6]. 

Diabetes prevalence data from the NHMS 2022–24 has been calculated based on both diagnostic tests. Diabetes prevalence (FPG) and Diabetes prevalence (HbA1c) recorded similar rates of known and newly diagnosed diabetes prevalence. 

Comparison of diabetes prevalence (FPG) and diabetes prevalence (HbA1c), persons aged 18 years and over(a)
 Diabetes prevalence (FPG) (%)
 Has known or newly diagnosed diabetesAt high risk of diabetesNo diabetesTotal persons(b)
Diabetes prevalence (HbA1c) (%)Has known or newly diagnosed diabetes5.80.30.36.5
At high risk of diabetes0.30.93.74.9
No diabetes0.1(c)1.485.087.9
Total persons(b)6.62.789.3100.0
  1. Weighted results for persons where a fasted blood sample was collected.
  2. Totals include people who gave a fasted blood test but whose test results were not reported (reasons may include, but are not limited to, machine error or insufficient sample volume).
  3. This proportion has a high margin of error and should be used with caution.

Diabetes prevalence (FPG and HbA1c)

In 2022–24, of people aged 18 years and over:

  • 6.6% had diabetes (FPG), comprising 5.8% with known diabetes and 1.0% with newly diagnosed diabetes
  • 6.4% had diabetes (HbA1c), comprising 5.5% with known diabetes and 0.9% with newly diagnosed diabetes
  • males were more likely than females to have known or newly diagnosed diabetes using FPG results (8.5% compared to 4.7%) and HbA1c results (8.3% compared to 4.7%)
  • a similar pattern for prevalence of known or newly diagnosed diabetes was observed across age for HbA1c and FPG.
  1. Weighted results for persons where a blood sample was collected.
  2. Includes people who had known diabetes and those with newly diagnosed diabetes.
  3. Includes only people who fasted for 8 hours or more prior to their blood test.

Additionally, of people aged 18 years and over:

  • 2.7% were at high risk of diabetes (FPG)
  • 4.8% were at high risk of diabetes (HbA1c).

Diabetes prevalence patterns

The following section relates to people who had known or newly diagnosed diabetes as defined by a participant’s FPG results, self-reported diabetes status and medication use.

People with gestational diabetes and no other diabetes diagnosis were excluded from the ‘known diabetes’ category. People who self-reported a diabetes diagnosis, who also reported they were not taking medication and had a blood test result below the diabetes cut-offs (e.g. they were managing the condition with diet and lifestyle interventions) were classified as not having diabetes. See the Diabetes prevalence classification section of this publication for more information.

In 2022–24: 

  • males were more likely than females to have known or newly diagnosed diabetes (8.5% compared to 4.7%)
  • the prevalence of diabetes increased with age
  • males aged 65 years and over were more likely to have diabetes than males aged 18–44 years (16.9% compared to 2.4%)
  • females aged 65 years and over were more likely to have diabetes than females aged 18–44 years (10.5% compared to 0.9%).
  1. Weighted results for persons where a fasted blood sample was collected.
  2. Includes people who had known diabetes and those with newly diagnosed diabetes.

In 2022–24, people aged 18 years and over who:

  • had a waist circumference that put them at an increased risk of disease were more likely to have diabetes than those who did not (8.9% compared to 1.8%)
  • had high measured blood pressure were more likely to have diabetes than those with low or normal measured blood pressure (10.1% compared to 5.6%)
  • lived in areas of most disadvantage were more likely to have diabetes than those in areas of least disadvantage (9.3% compared to 3.5%).

Health risk factors in the NHMS 2022–24 include Body Mass Index (BMI), waist circumference, blood pressure, and current smoker status. People aged 18 years and over with known or newly diagnosed diabetes were more likely than people without diabetes to have two (55.3% compared to 41.1%) or three of these health risk factors (31.7% compared to 18.7%). Conversely, people without diabetes were more likely to have zero risk factors than people with known or newly diagnosed diabetes (20.7% compared to 3.5%).

  1. Weighted results for persons where a fasted blood sample was collected. People who self-reported being pregnant at the time of their interview were excluded from this analysis as they did not have their height, weight, waist circumference, or blood pressure measured.
  2. Selected health risk factors include: having a measured BMI of overweight/obese (≥25.00), having a measured waist circumference that of increased risk of disease (≥94cm for males and ≥88cm for females), having high measured blood pressure (≥140/90 mmHg), and reporting that they were a current smoker. People who were classified as 'unable to be determined' were considered to not have that risk factor.

In 2023, for deaths where diabetes was the underlying cause, cardiovascular diseases were among the most common associated causes of death[3]. In NHMS 2022–24, 25.1% of people aged 18 years and over who had diabetes also self-reported having heart, stroke and vascular disease. Additionally, people aged 18 years and older who had diabetes were more likely than those who did not have diabetes to have:

  • an abnormally low HDL cholesterol level (35.2% compared to 12.3%)
  • an abnormally high triglycerides level (32.6% compared to 13.1%)
  • albuminuria (40.4% compared to 8.4%)
  • an abnormally low estimated glomerular filtration rate (16.6% compared to 4.1%).
  1. Weighted results for persons where a fasted blood sample was collected.
  2. An albumin/creatinine ratio of ≥2.5 mg/mmol for males and ≥3.5 mg/mmol for females
  3. Includes only persons where a urine sample was collected.
  4. <1.0 mmol/L for males and <1.3 mmol/L for females
  5. <60 mL/min/1.73m²
  6. Does not include people who were at high risk of diabetes.

Diabetes management

The following section relates to people who had known diabetes as determined by their glycated haemoglobin (HbA1c) results, self-reported diabetes status, and medication status.

People with gestational diabetes and no other diabetes diagnosis were excluded from the ‘known diabetes’ category. People who self-reported a diabetes diagnosis, who also reported they were not taking medication and had a blood test result below the diabetes cut-offs (e.g. they were managing the condition with diet and lifestyle interventions) were classified as not having diabetes. See the Diabetes prevalence classification section of this publication for more information.

The Royal Australian College of General Practitioners (RACGP) details goals for diabetes management. For more information, see the IHMHS: Concepts, Sources and Methods.

In 2022–24, half (50.9%) of people aged 18 years and over with known diabetes had a HbA1c result within the optimum diabetes management range (≤7.0%). Among people aged 18 years and over with known diabetes in 2022–24: 

  • 48.3% met the target for total cholesterol levels (<4.0 mmol/L)
  • 46.2% met the target for triglycerides (<2.0 mmol/L)
  • 63.2% met the target for their albumin/creatinine ratio (<2.5 mg/mmol for males, <3.5 mg/mmol for females).

The goals for optimum diabetes management also include targets for health behaviours. In 2022–24, of people aged 18 years and over with known diabetes:

  • 88.9% were non-smokers
  • 70.5% had measured blood pressure in the normal range (≤140/90 mmHg).
  1. Weighted results for persons where a blood sample was collected.
  2. Includes only people who fasted for 8 hours or more prior to their blood test.
  3. The cut-off for ACR is <2.5 mg/mmol for males and <3.5 mg/mmol for females.

Cardiovascular disease

Definitions

Cardiovascular disease (CVD) is an umbrella term that includes heart, stroke, and blood vessel diseases. In 2024, CVD contributed to 11.8% of the total burden of disease[7]. In 2023, ischaemic heart diseases and cerebrovascular diseases were the number one and number three leading causes of death in Australia[3]. There are many risk factors for developing CVD, including smoking, alcohol consumption and abnormal blood lipids[8].

The NHMS 2022–24 measured the following indicators of CVD: 

  • total cholesterol
  • high-density lipoprotein (HDL) cholesterol
  • low-density lipoprotein (LDL) cholesterol
  • triglycerides. 

For more information on the collection of CVD data, see the IHMHS: Concepts, Sources and Methods.

Total cholesterol

Cholesterol (a waxy, fat-like substance) is a lipid necessary to make hormones, including vitamin D, and also assists in digestion[9]. Total cholesterol includes both LDL and HDL cholesterol.

In 2022–24, of people aged 18 years and over:

  • 30.2% had an abnormally high total cholesterol level (≥5.5 mmol/L)
  • 17.8% had a total cholesterol level that was close to abnormal (≥5.0 to <5.5 mmol/L)
  • females were more likely to have an abnormally high total cholesterol level than males (32.1% compared to 28.2%)
  • prevalence of an abnormally high total cholesterol level for males increased from 25.1% of those aged 25–34 years to a peak of 41.7% of those aged 45–54 years (peaking 10 years earlier than for females)
  • prevalence of an abnormally high total cholesterol level for females increased with age, from 15.9% of those aged 25–34 years to a peak of 53.5% of those aged 55–64 years. 
  1. Weighted results for persons where a blood sample was collected.
  2. The proportion for ‘males’ has a high margin of error and should be used with caution. 

High cholesterol is a health condition that doesn’t always have symptoms, but if left untreated long-term, it can increase the risk of serious health complications[9]. In 2022–24, of the 30.2% of people aged 18 years and over with an abnormally high total cholesterol level, only 9.2% self-reported having high cholesterol as a current long-term health condition.

In 2022–24, people aged 18 years and over who:

  • had a measured waist circumference that put them at increased risk of disease, were more likely to have an abnormally high total cholesterol level than those who did not (33.1% compared to 24.2%)
  • had high measured blood pressure were more likely to have an abnormally high total cholesterol level than those who had normal or low measured blood pressure (34.4% compared to 28.9%)
  • reported they were current smokers were no more likely to have an abnormally high total cholesterol level than those who were non-smokers (29.2% and 30.3%, the difference is not statistically significant).

High-density lipoprotein (HDL) cholesterol

HDL, also known as ‘good’ cholesterol, picks up cholesterol in the blood and transports it to the liver to be broken down. Having abnormal HDL cholesterol levels may increase the risk of heart attack or stroke[9].

In 2022–24, of people aged 18 years and over:

  • 14.9% had an abnormally low HDL cholesterol level (<1.0 mmol/L for males and <1.3 mmol/L for females)
  • females were more likely to have an abnormally low HDL cholesterol level than males (18.7% compared to 11.0%)
  • males had a mean HDL cholesterol level of 1.3 mmol/L, and females had a mean HDL cholesterol level of 1.6 mmol/L
  • those who lived in Outer Regional or Remote areas of Australia were more likely to have an abnormally low HDL cholesterol level than those in Major Cities (24.3% compared to 13.5%).
  1. Weighted results for persons where a blood sample was collected.

People aged 18 years and over who had an abnormally low HDL cholesterol level were more likely to have:

  • known or newly diagnosed diabetes (FPG) than those who had a normal HDL cholesterol level (16.8% compared to 5.0%)
  • albuminuria than those who had a normal HDL cholesterol level (15.4% compared to 9.5%).

People aged 18 years and over who had a measured waist circumference that put them at increased risk of disease were more likely to have an abnormally low HDL cholesterol level than those who did not (18.5% compared to 6.7%).

Low-density lipoprotein (LDL) cholesterol

LDL, also known as ‘bad’ cholesterol, can leave fatty deposits called plaque in blood vessels, leading to a reduced flow of blood in the body. Having high levels of LDL may increase the risk of heart attack or stroke[9]. LDL cholesterol levels are presented only for people who fasted 8 hours or more prior to their blood test. In the NHMS, LDL cholesterol results are calculated for each respondent based on the results of total cholesterol, HDL cholesterol, and triglycerides. For more information, see the IHMHS: Concepts, Sources and Methods.

In 2022–24, of people aged 18 years and over:

  • 27.8% had an abnormally high LDL cholesterol level (≥3.5 mmol/L)
  • 19.0% had an LDL cholesterol level that was close to the high range (3.0 to <3.5 mmol/L)
  • males and females had a similar prevalence of abnormally high LDL cholesterol levels (29.5% and 26.3%)
  • people who had high measured blood pressure were more likely to have an abnormally high LDL cholesterol level (32.7%) than those who had normal or low measured blood pressure (26.4%).
  1. Weighted results for persons where a fasted blood sample was collected.

Triglycerides

Triglycerides are lipids that circulate in the blood and are the most common type of fat in the body. Alongside abnormally low HDL and abnormally high LDL cholesterol, an abnormally high triglycerides level can increase someone’s risk of cardiovascular disease[9]. Results are presented only for people who fasted for 8 hours or more prior to their blood test.

In 2022–24, of people aged 18 years and over:

  • 14.5% had an abnormally high triglycerides level (≥2.0 mmol/L)
  • males were more likely to have an abnormally high triglycerides level than females (18.3% compared to 10.8%)
  • prevalence of abnormally high triglycerides levels varied with age, from 8.9% of people aged 18–29 years to 14.9% of people aged 65 years and over.
  1. Weighted results for persons where a fasted blood sample was collected.

In 2022–24, adults who had an abnormally high triglycerides level were more likely than those with a normal triglycerides level to have:

  • an abnormally high total cholesterol level (52.2% compared to 28.1%)
  • an abnormally low HDL cholesterol level (37.1% compared to 9.8%)
  • an abnormally high LDL cholesterol level (33.5% compared to 26.9%).
  1. Weighted results for persons where a fasted blood sample was collected.
  2. <1.0 mmol/L for males and <1.3 mmol/L for females

Dyslipidaemia

Dyslipidaemia is a term used to describe abnormal levels of lipids found in the blood. In 2022–24, dyslipidaemia status was calculated for persons aged 18 years and over who had fasted for 8 hours or more prior to their blood test.

The components of dyslipidaemia are some of a range of inputs into the Australian cardiovascular disease risk (AusCVDRisk) calculator, which along with the 2023 'Guideline for assessing and managing CVD risk’ was developed by the Heart Foundation and is used to assess CVD risk[10]. For more information, refer to the IHMHS: Concepts, Sources and Methods

Dyslipidaemia in the NHMS

There are several definitions of dyslipidaemia and caution must be taken when comparing dyslipidaemia prevalence in the NHMS 2022–24 to external data sources. 

In the NHMS 2022–24, a person was defined as having dyslipidaemia if they had at least one of the following characteristics:

  • were taking lipid-lowering medication
  • an abnormally high total cholesterol result
  • an abnormally low HDL cholesterol result
  • an abnormally high LDL cholesterol result
  • an abnormally high triglycerides result.

In 2022–24:

  • 58.9% of people aged 18 years and over had dyslipidaemia
  • males aged 18 years and over were more likely to have dyslipidaemia than females in the same age group (61.1% compared to 56.9%)
  • over half (51.6%) of people aged 45–64 had abnormal lipid levels and were not taking lipid-lowering medication
  • 10.4% of people aged 18 years and over were taking lipid-lowering medication and had normal lipid levels.

Of people aged 18 years and over with dyslipidaemia:

  • three in ten (30.5%) took some form of cholesterol-lowering medication
  • seven in ten (69.6%) took no medication but had either an abnormally high total cholesterol level, an abnormally low HDL cholesterol level, an abnormally high LDL cholesterol level or an abnormally high triglycerides level based on their test results. 
  1. Weighted results for persons where a fasted blood sample was collected.
  2. The proportion for ‘using lipid medication and has normal lipid levels’ has a high margin of error and should be used with caution.
  3. The proportion for ‘using lipid medication and has abnormal lipid levels’ has a high margin of error and should be used with caution.

Chronic kidney disease

Chronic kidney disease (CKD) is characterised by a gradual loss of kidney function over time. This affects the kidney's ability to filter blood and leads to a build-up of waste and fluid inside the body. CKD can result in other health problems such as high blood pressure, heart disease and anaemia[11].

The NHMS 2022–24 calculated the following indicators of CKD:

  • estimated glomerular filtration rate (eGFR)
  • albumin/creatinine ratio (ACR).

While an abnormally low eGFR or high ACR result in the NHMS may indicate impaired kidney function, CKD can only be confirmed if a high ACR or an eGFR of less than 60 mL/min/1.73m² is persistent for at least three months[11]. For more information, see the IHMHS: Concepts, Sources and Methods.

Estimated glomerular filtration rate (eGFR)

eGFR measures how well the kidneys filter wastes from the blood and is a measure of kidney function. eGFR helps determine if a person has kidney damage. A low filtration rate (<60 mL/min/1.73m²) means that the kidneys are not working properly[12].

In 2022–24, of people aged 18 years and over: 

  • 5.2% had an abnormally low eGFR (<60 mL/min/1.73m²)
  • the proportion of males and females with an abnormally low eGFR was similar (4.8% and 5.6%)
  • both males and females had a mean eGFR of 83 mL/min/1.73m².

Of people aged 18 years and over with an abnormally low eGFR:

  • the proportion increased with age from 0.4% of people aged 18–44 years to 29.3% of those aged 75 years and over
  • 14.0% self-reported that they had kidney disease as a long-term health condition.
  1. Weighted results for persons where a blood sample was collected.
  2. The proportion for people aged 45–54 years has a high margin of error and should be used with caution.

An abnormally low eGFR was associated with other biomarkers of chronic disease. People aged 18 years and over who had an abnormally low eGFR were more likely than people with a normal eGFR to have:

  • an abnormally low HDL level (22.0% compared to 14.6%)
  • an abnormally high triglycerides level (21.0% compared to 14.2%)
  • albuminuria (36.7% compared to 9.4%)
  • known or newly diagnosed diabetes (FPG) (21.6% compared to 5.8%)
  • an abnormally low haemoglobin level (23.9% compared to 6.8%).
  1. Weighted results for persons where a blood sample was collected.
  2. An albumin/creatinine ratio of ≥2.5 mg/mmol for males and ≥3.5 mg/mmol for females.
  3. Includes only persons where a urine sample was collected.
  4. <130 g/L for males and <120 g/L for females.
  5. <1.0 mmol/L for males and <1.3 mmol/L for females.
  6. Includes only people who fasted for 8 hours or more prior to their blood test.

Certain health risk factors can increase the likelihood of developing CKD, such as high blood pressure and excess bodyweight[13]. In 2022–24, people aged 18 years and over were more likely to have an abnormally low eGFR if they:

  • had high measured blood pressure than those with normal blood pressure (9.7% compared to 3.9%)
  • had a waist circumference that put them at an increased risk of disease compared to those who did not (6.7% compared to 2.1%)
  • were obese compared to people who were overweight (7.9% compared to 5.2%) and people who were in the underweight/normal weight range (7.9% compared to 2.6%).

Albuminuria

Albuminuria occurs when excessive amounts of albumin are present in the urine and is an indicator of CKD[11]. Albuminuria is determined by the ACR, which is measured by dividing the amount of albumin (a protein) in the urine by the amount of creatinine (a metabolism byproduct) in the urine.

In 2022–24, of people aged 18 years and over:

  • 10.8% had albuminuria (an ACR of ≥2.5 mg/mmol for males and ≥3.5 mg/mmol for females)
  • people were more likely to have microalbuminuria than macroalbuminuria (9.7% compared to 1.1%)
  • the proportion of people who had albuminuria increased with age, from 4.8% of those aged 18–29 to 27.2% of those aged 75 years and over
  • males were more likely to have albuminuria than females (12.1% compared to 9.6%)
  • males aged 65 years and over were more likely to have albuminuria than females in the same age group (25.9% compared to 16.2%)
  • the mean ACR was similar for males and females (2.5 mg/mmol and 2.3 mg/mmol)
  • those living in Outer Regional and Remote areas were more likely to have albuminuria than people in Major Cities (14.4% compared to 10.4%).
  1. Weighted results for persons where a urine sample was collected.

People with CKD may experience complications such as iron deficiency anaemia[11]. In 2022–24, people aged 18 years and over with albuminuria were more likely to have abnormally low haemoglobin than those without albuminuria (15.1% compared to 6.8%). They were also more likely to have:

  • an abnormally low HDL cholesterol level (22.1% compared to 13.8%)
  • an abnormally high triglycerides level (26.5% compared to 13.1%)
  • known or newly diagnosed diabetes (FPG) (25.8% compared to 4.6%)
  • an abnormally low eGFR (18.0% compared to 3.8%)
  • an abnormally high gamma-glutamyl transferase level (21.3% compared to 13.6%).
  1. Weighted results for persons where a urine sample was collected.
  2. <1.0 mmol/L for males and <1.3 mmol/L for females.
  3. Includes only persons where a blood sample was collected.
  4. Includes only persons where a fasted blood sample was collected.
  5. <60 mL/min/1.73m²
  6. >50 U/L for males and >35 U/L for females.
  7. <130 g/L for males and <120 g/L for females.

High blood pressure and excess body weight can increase the risk of developing albuminuria[14]. In 2022–24, people aged 18 years and over who:

  • were obese were more likely to have albuminuria than people who were overweight (14.9% compared to 10.0%) and people who were in the underweight/normal weight range (14.9% compared to 7.5%)
  • had a waist circumference that put them at an increased risk of disease were more likely to have albuminuria than those who did not (12.8% compared with 6.4%)
  • had high measured blood pressure were more likely than those with normal blood pressure to have albuminuria (16.5% compared to 9.2%).

Indicators of chronic kidney disease

There are five stages of CKD, ranging in severity from Stage 1 to Stage 5[11]. In the NHMS 2022–24, CKD stages were determined by combining participants' eGFR and ACR. 

In 2022–24, 14.2% of people aged 18 years and over had indicators of CKD, comprising:

  • 5.1% with Stage 1 CKD (eGFR ≥90 mL/min/1.73 m² & albuminuria)
  • 3.9% with Stage 2 CKD (eGFR 60–89 mL/min/1.73 m² & albuminuria)
  • 3.8% with Stage 3a CKD (eGFR 45–59 mL/min/1.73 m²)
  • 1.4% with Stage 3b CKD (eGFR 30–44 mL/min/1.73 m²)
  • 0.1% with Stage 4–5 CKD (eGFR <30 mL/min/1.73 m²).

The proportion of males and females aged 18 years and over with indicators of CKD was similar (14.4% and 13.9%). Like the patterns seen for eGFR and ACR individually, the proportion of people with indicators of CKD increased with age. One in twenty (4.8%) people aged 18–29 years had indicators of CKD, compared to nine in twenty (44.7%) people aged 75 years and over.

In 2022–24, only 7.4% of people aged 18 years and over who had indicators of CKD self-reported having kidney disease.

  1. Weighted results for persons where a urine and blood sample were collected.

Liver function

The liver regulates most chemical levels in the blood and excretes a product called bile. It works as the body's filter, removing toxins from the blood, processing nutrients, and regulating metabolism. A range of factors, including fatty liver disease (where fat accumulates in the liver), infections and excessive alcohol consumption can prevent the liver from performing these functions as it should and can lead to liver damage[15].

The NHMS 2022–24 measured the following indicators of liver function:

  • alanine aminotransferase (ALT)
  • gamma-glutamyl transferase (GGT). 

While these tests cannot diagnose the presence of liver disease, elevated levels for either test may indicate liver damage. For more information, see the IHMHS: Concepts, Sources and Methods.

Alanine aminotransferase (ALT)

ALT is an enzyme used to break down food into energy. ALT is mainly found in the liver, but smaller amounts are found in the muscles, kidneys and other organs. Elevated levels of ALT indicates a degree of liver inflammation[16]. 

In 2022–24, of people aged 18 years and over:

  • 25.5% had an abnormally high ALT level (>40 U/L for males and >30 U/L for females)
  • males had a mean ALT of 37 U/L and females had a mean ALT of 25 U/L
  • the proportion of people with an abnormally high ALT level peaked at 31.1% of people aged 25–34 years before declining to 11.7% of people aged 75 years and over
  • males were more likely than females to have an abnormally high ALT level (30.5% compared with 20.7%). 

The proportion of people with an abnormally high ALT level also differed by age for males and females. In 2022–24:

  • the proportion of males with an abnormally high ALT level declined with age, from 46.4% of those aged 25–34 years, to 9.7% for those aged 75 years and over
  • the proportion of females with an abnormally high ALT level increased with age and peaked at 34.3% of those aged 55–64 years before declining to 13.0% of those aged 75 years and over.
  1. Weighted results for persons where a blood sample was collected.

Excess fat in the liver can lead to tissue damage and affect liver function[15]. In 2022-24, people aged 18 years and over who:

  • were obese were more likely to have an abnormally high ALT level than those who were overweight (36.4% compared to 24.9%) and those who were in the underweight/normal weight range (36.4% compared to 14.7%)
  • had a waist circumference that put them at an increased risk of disease were more likely to have an abnormally high ALT level than those who did not (28.9% compared to 18.0%).

In 2022–24, people aged 18 years and over with abnormally high ALT levels were more likely than those with normal ALT levels to have:

  • an abnormally high total cholesterol level (35.6% compared to 28.3%)
  • an abnormally high GGT level (33.5% compared to 8.1%)
  • an abnormally high triglycerides level (24.8% compared to 11.0%)
  • an abnormally low HDL cholesterol level (21.0% compared to 12.9%)
  • known or newly diagnosed diabetes (FPG) (8.5% compared to 6.1%).
  1. Weighted results for persons where a blood sample was collected.
  2. >50 U/L for males and >35 U/L for females.
  3. Includes only people who fasted for 8 hours or more prior to their blood test.
  4. <1.0 mmol/L for males and <1.3 mmol/L for females.

Gamma-glutamyl transferase (GGT)

GGT is a common enzyme found in many of the body’s tissues and organs, primarily in the liver. Elevated levels of GGT can indicate poor liver function[17].

In 2022–24, of people aged 18 years and over:

  • 14.5% had an abnormally high GGT level (>50 U/L for males and >35 U/L for females)
  • males and females had similar rates of abnormally high GGT levels (14.8% and 14.1%)
  • males had a mean GGT level of 37 U/L and females had a mean GGT level of 26 U/L
  • people who were living in areas of most disadvantage were more likely than those likely than those in areas of least disadvantage to have an abnormally high GGT level (19.7% compared to 12.3%).

In 2022–24, the proportion of people with an abnormally high GGT level increased with age, peaking at 24.0% of those aged 55–64 years, then declining to 16.2% of those aged 75 years and over. The proportion of people with an abnormally high GGT level peaked at 21.9% for males aged 35–44 years, and at 29.6% for females aged 55–64 years.

  1. Weighted results for persons where a blood sample was collected.
  2. The proportions for 'males' and 'females' have high margins of error and should be used with caution.

Elevated GGT levels were also associated with certain health risk factors. People aged 18 years and over who:

  • were obese were more likely to have an abnormally high GGT level compared to those who were overweight (22.8% compared to 13.9%) and those who were in the underweight/normal weight range (22.8% compared to 6.2%)
  • had a measured waist circumference that put them at an increased risk of disease were more likely to have an abnormally high GGT level than those who did not (18.4% compared to 5.8%)
  • had high measured blood pressure were more likely to have an abnormally high GGT level than those with normal blood pressure (19.4% compared to 13.0%)
  • reported being current smokers were more likely to have an abnormally high GGT level than those who were non-smokers (24.0% compared to 13.6%).

In 2022–24, people aged 18 years and over with an abnormally high GGT level were more likely than those with a normal GGT level to have:

  • albuminuria (16.0% compared to 10.0%)
  • an abnormally high ALT level (59.0% compared to 19.9%)
  • an abnormally high total cholesterol level (45.6% compared to 27.6%)
  • an abnormally high triglycerides level (33.8% compared to 11.3%)
  • an abnormally low HDL cholesterol level (20.5% compared to 13.9%)
  • known or newly diagnosed diabetes (FPG) (10.9% compared to 6.0%).
  1. Weighted results for persons where a blood sample was collected.
  2. >40 U/L for males and >30 U/L for females.
  3. Includes only people who fasted for 8 hours or more prior to their blood test.
  4. <1.0 mmol/L for males and <1.3 mmol/L for females.
  5. An albumin/creatinine ratio of ≥2.5 mg/mmol for males and ≥3.5 mg/mmol for females.
  6. Includes only persons where a urine sample was collected.

Iron and haemoglobin

Iron is an essential mineral which is needed to produce red blood cells. Iron deficiency can lead to fatigue and decrease immunity. It is the leading cause of anaemia worldwide[18][19]. 

The NHMS 2022–24 biomarkers that were used to measure the amount of iron stored in the body were:

  • serum ferritin
  • soluble transferring receptor (sTfR)
  • haemoglobin. 

The NHMS 2022–24 also measured C-reactive protein (CRP) to help understand the serum ferritin results. CRP is not reported on individually.

For more information on these tests, see the IHMHS: Concepts, Sources and Methods.

Serum ferritin

Ferritin is a blood protein that stores iron. While normal serum ferritin levels vary by age and sex, a low level indicates iron depletion, and a high level indicates risk of iron overload. A low ferritin level is the first stage indicator of iron deficiency anaemia[20][21]. 

In 2022-24:

  • the mean serum ferritin level for people aged 18 years and over was 133 µg/L
  • mean serum ferritin level increased with age, from 90 µg/L for people aged 18–24 years, to 162 µg/L for those aged 75 years and over
  • males had a higher mean serum ferritin level than females in every age group
  • the mean serum ferritin level for children aged 12–17 years old was 41 µg/L.
  1. Weighted results for persons where a blood sample was collected and excludes test results that were not reported.

The World Health Organization (WHO) specifies different cut-offs for iron overload and iron deficiency as measured by serum ferritin for both ‘apparently healthy’ and ‘non-healthy’ individuals[22]. The WHO defines an ‘apparently healthy’ individual as someone “with physical well-being for their age and physiological status, without detectable diseases or infirmities”. It is not possible to accurately define this population in the NHMS. Cut-offs for serum ferritin deficiency are the same across both the ‘apparently healthy’ and ‘non-healthy’ populations.

The WHO also recommends excluding individuals with elevated inflammatory markers, such as CRP, when analysing serum ferritin results because serum ferritin levels are affected by inflammation. People with a CRP level >10 mg/L were excluded from serum ferritin analysis in line with this recommendation.

In 2022–24, of people aged 18 years and over:

  • 3.3% had a serum ferritin level under the WHO cut-off (15 µg/L)
  • females were more likely to be ferritin deficient than males (5.6% compared to 0.9%).
  1. Weighted results for persons where a blood sample was collected.
  2. A serum ferritin level of <15ug/L.

Soluble transferrin receptor (sTfR)

sTfR is an iron-related protein that is important in the process of carrying iron to cells. When serum ferritin results indicate depleted iron stores, sTfR can be used to assess the severity of the iron depletion because levels increase in iron deficiency anaemia, reflecting the body’s demand for iron[21][23].

In 2022–24:

  • the mean sTfR level for people aged 18 years and over was 2.8 mg/L
  • mean sTfR was steady across age for both males and females
  • mean sTfR was similar between males and females across all age groups, except for those aged 55–64 years, where males had a higher mean sTfR than females (2.8 mg/L compared to 2.6 mg/L)
  • the mean sTfR level for children aged 12–17 years was 3.1 mg/L.

Haemoglobin

Haemoglobin is a protein found in red blood cells that helps transport oxygen from the lungs to the rest of the body[20]. As iron is an essential part of the haemoglobin molecule, the haemoglobin concentration of whole blood can be used to test for iron deficiency anaemia. 

In 2022–24:

  • 7.7% of people aged 18 years and over had an abnormally low haemoglobin level (<130 g/L for males and <120 g/L for females)
  • Females aged 18 years and over were more likely to have an abnormally low haemoglobin level than males aged 18 years and over (10.5% compared to 4.8%)
  • people aged 75 years and over were more likely to have an abnormally low haemoglobin level than any other age group
  • 10.5% of children aged 12–17 years old had an abnormally low haemoglobin level.
  1. Weighted results for persons where a blood sample was collected.

Anaemia is associated with diabetes and CKD[24][25]. In 2022–24, of people aged 18 years and over, those with an abnormally low haemoglobin level were more likely than those with a normal haemoglobin level to have:

  • known or newly diagnosed diabetes (FPG) (11.6% compared to 6.3%)
  • an abnormally low eGFR (16.2% compared to 4.4%)
  • albuminuria (21.1% compared to 10.0%)
  • ferritin deficiency (17.6% compared to 2.2%).
  1. Weighted results for persons where a blood sample was collected.
  2. An albumin/creatinine ratio of ≥2.5 mg/mmol for males and ≥3.5 mg/mmol for females.
  3. Includes only persons where a urine sample was collected.
  4. <60 mL/min/1.73m²
  5. Includes only people who fasted for 8 hours or more prior to their blood test

Nutrient biomarkers

Iodine

Iodine is an essential part of thyroid hormones that regulate normal growth and metabolism. Iodine plays a role in physical and mental development[26]. In the NHMS 2022–24, iodine results were obtained for people aged 5 years and over who provided a urine sample.

In 2022–24:

  • the population aged 18 years and over were iodine sufficient[27] with a median urinary iodine concentration (UIC) of 112 µg/L
  • 17.4% of the population aged 18 years and over had an iodine concentration less than 50 µg/L
  • females aged 18 years and older had a lower median UIC than males aged 18 years and older (101 µg/L compared to 123 µg/L)
  • children aged 5–17 years were also iodine sufficient, with a median UIC of 171 µg/L
  • 8.0% of children aged 5–17 years had a concentration less than 50 µg/L.
  1. Weighted results for persons where a blood sample was collected and excludes test results that were not reported.

Adequate iodine intake is important during pregnancy, as iodine deficiency in pregnancy can impact foetal development[26]. In 2022–24:

  • the median UIC for females aged 16–44 years was 101 µg/L. While this was inside the range for iodine sufficiency for the general population (100-199 µg/L), it was below the range for people who are pregnant (150-249 µg/L)
  • the median UIC for females aged 25–34 years (87 µg/L) and 35–44 years (97 µg/L) were under the 100 µg/L cut-off with more than 20% of the individual results under 50 µg/L.

Vitamin D

Vitamin D is a hormone that is essential for the body to absorb and retain calcium and phosphorus effectively, which is important for bone health and muscle function[28]. In the NHMS 2022–24, vitamin D was measured in the form of calcidiol (25(OH)D) that measured both vitamin D2 and vitamin D3. Vitamin D results were obtained for people who provided a blood sample.

In 2022–24:

  • 20.6% of people aged 18 years and over had a vitamin D deficiency
  • males and females aged 18 years and over had similar rates of vitamin D deficiency (22.5% and 18.6%), however females had a higher median vitamin D level than males (69 nmol/L compared to 65 nmol/L)
  • vitamin D deficiency was highest for the 18–29 year age groups (29.2%)
  • 28.7% of children aged 12–17 years old had a vitamin D deficiency.
  1. Weighted results for persons where a blood sample was collected and excludes test results that were not reported.

People aged 18 years and over were more likely to be vitamin D deficient in winter (26.1%) than they were in summer (15.5%).

  1. Weighted results for persons where a blood sample was collected.
  2. The proportions for 'Summer' and 'Winter' have high margins of error and should be used with caution.

Serum folate

Folate is a B group vitamin (B9) that the body uses to make DNA and other genetic material. It is essential for healthy growth and development, particularly for the foetus in the first 3 months of pregnancy[29][30]. Serum folate (folate) results were obtained for people who provided a blood sample.

In 2022–24:

  • the mean folate level for people aged 18 years and over was 30.6 nmol/L, which is above the population cut-off for folate deficiency of <10 nmol/L
  • males and females aged 18 years and over had similar mean folate levels (30.3 nmol/L and 30.8 nmol/L)
  • people aged 18–24 years had a lower mean folate level (26.9 nmol/L) than any other age group
  • females aged 16–44 years had a mean folate level of 30.0 nmol/L
  • the mean folate level for children aged 12–17 years old was 31.5 nmol/L.
  1. Weighted results for persons where a blood sample was collected and excludes test results that were not reported.

In 2022–24, people aged 18 years and over who:

  • lived in areas of most disadvantage had a lower mean folate level than those in areas of least disadvantage (29.8 nmol/L compared to 31.8 nmol/L)
  • lived in Outer Regional or Remote areas of Australia had a lower mean folate level than those who lived in Major Cities (28.6 nmol/L compared to 31.0 nmol/L)
  • reported being current smokers had a lower mean folate level than those who were non-smokers (26.3 nmol/L compared to 30.9 nmol/L).

Vitamin B12

Vitamin B12 is important for several functions in the body. If left untreated, vitamin B12 deficiency can lead to anaemia, nerve damage and brain damage[31]. Vitamin B12 results were obtained for people who provided a blood sample.

In 2022–24: 

  • people aged 18 years and over had a mean vitamin B12 level of 391 pmol/L, which is above the population cut-off for vitamin B12 deficiency (<150 pmol/L)[32]
  • mean vitamin B12 varied with age and sex, however overall, females aged 18 years and over had a higher mean vitamin B12 level than males in the same age group (402 pmol/L and 379 pmol/L)
  • females aged 16–44 years had adequate levels of vitamin B12 with a mean of 390 pmol/L, which is well above the WHO cut-off for vitamin B12 deficiency
  • 96.9% of females aged 16–44 years had a vitamin B12 level of 150 pmol/L or higher
  • the mean vitamin B12 level for children aged 12–17 years old was 402 pmol/L.
  1. Weighted results for persons where a blood sample was collected and excludes test results that were not reported.

Comparing biomedical results over time

The NHMS 2022–24 is the second iteration of this survey. The ABS first collected the NHMS as part of the Australian Health Survey 2011–13.

The following section includes analysis over time for selected biomarkers using biomedical data collected in the NHMS 2011–12 and the NHMS 2022–24. It is important to note that statistically significant movements may not represent clinically significant changes in the population, and caution should be used when interpreting these results.

There are a range of factors that may impact the comparability of survey results across time. In some cases, it may be difficult to distinguish between changes due to methods, changes due to equipment updates, underlying biomedical changes, and/or population ageing. It is important to be aware of these factors when comparing results between ABS biomedical collections. For detailed information on time series comparability, see the IHMHS: Concepts, Sources and Methods.

Chronic disease biomarkers over time

Between 2011–12 and 2022–24 the proportion of people aged 18 years and over with:

  • an abnormally low eGFR increased from 3.7% to 5.2%
  • albuminuria increased from 8.3% to 10.8%
  • an abnormally low haemoglobin level increased from 4.5% to 7.7%
  • diabetes (FPG) increased from 5.1% to 6.6%
  • an abnormally high total cholesterol level decreased from 33.2% to 30.2%.
  1. Weighted results for persons where a blood sample was collected.
  2. Weighted results for persons where a fasted blood sample was collected.
  3. The change between 2011–12 and 2022–24 is not statistically significant.
  4. <60 mL/min/1.73m²
  5. Weighted results for persons where a urine sample was collected.
  6. An albumin/creatinine ratio of ≥2.5 mg/mmol for males and ≥3.5 mg/mmol for females.
  7. <130 g/L for males and <120 g/L for females.

CVD biomarkers over time

Interpreting CVD biomarkers over time

In the NHMS, LDL cholesterol results are calculated for each respondent based on the results of total cholesterol, HDL cholesterol and triglycerides. Information on how LDL is calculated for NHMS is available in the IHMHS: Concepts, Sources and Methods.

Total cholesterol, HDL cholesterol, LDL cholesterol, and triglyceride results, as well as dyslipidaemia, are not used in isolation when assessing the risk of developing CVD. These tests results are one component used in the 2023 CVD risk calculator, which also considers factors such as age, smoking status, and blood pressure. More information on using the CVD risk calculator with results from the NHMS is available in the IHMHS: Concepts, Sources and Methods

The NHMS collects information on total cholesterol, HDL cholesterol, LDL cholesterol, triglycerides and dyslipidaemia. Between 2011–12 and 2022–24, the proportion of people aged 18 years and over with:

  • an abnormally low HDL cholesterol level decreased from 23.4% to 14.9%
  • an abnormally high LDL cholesterol level decreased from 33.2% to 27.8%
  • an abnormally high triglycerides level remained steady (13.9% and 14.5%)
  • dyslipidaemia decreased from 63.2% to 58.9%.

The decrease in the proportion of people who had an abnormally low HDL cholesterol level was a contributor to the decrease in the proportion of people with an abnormally high total cholesterol level.

An abnormally low HDL level is defined as an HDL level of below 1.0 mmol/L for males or 1.3 mmol/L for females. Between 2011–12 and 2022–24, the mean HDL level for both males and females increased by 0.1 mmol/L for people aged 18 years and over. The change in the means represents a shift in the population results, where more people now have an HDL cholesterol level that is just above the abnormal cut-off. 

The mean HDL level of males aged 18 years and over increased from 1.2 mmol/L in 2011–12 to 1.3 mmol/L in 2022–24.

  1. Weighted results for males where a blood sample was collected.
  2. The change between 2011–12 and 2022–24 is not statistically significant.

The mean HDL level of females aged 18 years and over increased from 1.5 mmol/L in 2011–12 to 1.6 mmol/L in 2022–24.

  1. Weighted results for females where a blood sample was collected.

Diabetes and CKD biomarkers over time

The NHMS collects a range of information on diabetes that can be analysed over time. Between 2011–12 and 2022–24, the proportion of people aged 18 years and over with known or newly diagnosed diabetes (FPG) increased from 5.1% to 6.6%.

  1. Weighted results for persons where a fasted blood sample was collected.
  2. The change between 2011–12 and 2022–24 is not statistically significant.

Diabetes and chronic kidney disease (CKD) share many risk factors and diabetes is a major cause of CKD[13]. Like the pattern seen with diabetes between 2011–12 and 2022–24, the proportion of people with indicators of CKD increased from 10.8% to 14.2%.

In the NHMS, indicators of CKD were determined by a combination of eGFR and ACR results. Between 2011-12 and 2022–24, the proportion of people aged 18 years and over with:

  • an abnormally low eGFR increased from 3.7% to 5.2%
  • albuminuria increased from 8.3% to 10.8%.

People with selected health risk factors and indicators of CKD have also changed over time. Between 2011–12 and 2022–24, the proportion of people aged 18 years and over who:

  • reported that they currently smoked and had indicators of CKD increased from 8.3% to 14.2%
  • had a measured waist circumference that put them at increased risk of disease and had indicators of CKD has increased from 11.7% to 17.2%.

The change in indicators of CKD by stage varied. An increase in the proportion of people aged 18 years and over with indicators of CKD was observed for Stages 2, 3a and 3b. Proportions of people in Stage 1 and Stages 4-5 remained steady.

  1. Weighted results for persons where a urine and blood sample were collected.
  2. The change between 2011–12 and 2022–24 is not statistically significant.

Nutrient biomarkers over time

The NHMS collects a range of information on nutrients that can be analysed over time. Between 2011–12 and 2022–24 for people aged 18 years and over:

  • mean serum ferritin level decreased from 146 µg/L to 133 µg/L
  • mean serum folate level decreased from 33.6 nmol/L to 30.6 nmol/L
  • mean vitamin B12 level increased from 369 pmol/L to 391 pmol/L
  • mean vitamin D level increased from 66 nmol/L to 68 nmol/L
  • median urinary iodine concentration decreased from 124 µg/L to 112 µg/L. 

Between 2011–12 and 2022–24, the proportions of people aged 18 years and over who had:

  • an abnormally low haemoglobin level increased from 4.5% to 7.7%
  • vitamin D deficiency decreased from 23.8% to 20.6%.

Iron and haemoglobin over time

Between, 2011–12 and 2022–24 mean serum ferritin level for people aged 18 years and over:

  • decreased from 146 µg/L to 133 µg/L. This was still above the WHO cut-off for iron deficiency (<15 µg/L)
  • decreased for males overall (204 µg/L to 176 µg/L) and for every male age group except 18–24 years and 75 years and older
  • remained steady for females overall (87 µg/L and 91 µg/L) but increased for females aged 18–24 years (44 µg/L to 57 µg/L) and 25–34 years (51 µg/L to 61 µg/L).
  1. Weighted results for males where a blood sample was collected and excludes test results that were not reported.
  2. The change between 2011–12 and 2022–24 is not statistically significant.

Between 2011–12 and 2022–24, the proportion of people aged 18 years and over who had an abnormally low haemoglobin level increased from 4.5% to 7.7%. This increase was driven by an increase in the proportion of people aged between 35 and 64 years old who had an abnormally low haemoglobin level.

  1. Weighted results for persons where a blood sample was collected.
  2. The change between 2011–12 and 2022–24 is not statistically significant.

Iodine biomarkers over time

Between 2011–12 and 2022–24, the median urinary iodine concentration (UIC) of people aged 18 years and over decreased from 124 µg/L to 112 µg/L. Despite this decrease, the population was still iodine sufficient (the population cut-off for iodine deficiency is a median UIC of <100 µg/L). 

Between 2011–12 and 2022–24:

  • males aged 18 years and over remained iodine sufficient, however their median UIC decreased from 131 µg/L to 123 µg/L
  • females aged 18 years and over remained iodine sufficient, however their median decreased from 118 µg/L to 101 µg/L
  • the median UIC for females aged 16–44 years decreased from 121 µg/L to 101 µg/L, which is just inside the range for iodine sufficiency.
  1. Weighted results for persons where a blood sample was collected and excludes test results that were not reported.

Vitamin D biomarkers over time

The proportion of people aged 18 years and over who were vitamin D deficient decreased from 23.8% in 2011–12 to 20.6% in 2022–24. This decrease was mostly observed in people aged 65–74 years (15.5% to 10.4%) and 75 years and over (20.4% to 11.9%).

  1. Weighted results for persons where a blood sample was collected.
  2. The change between 2011–12 and 2022–24 is not statistically significant.

While the proportion of males aged 18 years and over with vitamin D deficiency did not change significantly (24.5% in 2011–12 and 22.5% in 2022–24), the proportion of females with vitamin D deficiency in the same age group decreased from 23.1% to 18.6%.

Serum folate biomarkers over time

Between 2011–12 and 2022–24, the mean serum folate level decreased for:

  • all people aged 18 years and over across all age groups (33.6 nmol/L to 30.6 nmol/L)
  • all males aged 18 years and over (33.3 nmol/L to 30.3 nmol/L)
  • all females aged 18 years and over (33.9 nmol/L to 30.8 nmol/L)
  • females aged 16–44 years old (32.9 nmol/L to 30.0 nmol/L).
  1. Weighted results for persons where a blood sample was collected and excludes test results that were not reported.

Vitamin B12 biomarkers over time

In contrast to folate, the mean vitamin B12 level increased from 369 pmol/L in 2011–12 to 391 pmol/L in 2022–24. The following population groups saw increases:

  • males aged 18 years and over (366 pmol/L to 379 pmol/L)
  • females aged 18 years and over (371 pmol/L to 402 pmol/L)
  • people aged 35–44 years (375 pmol/L to 403 pmol/L)
  • people aged 45–54 years (373 pmol/L to 407 pmol/L)
  • people aged 65–74 years (346 pmol/L to 370 pmol/L).
  1. Weighted results for persons where a blood sample was collected and excludes test results that were not reported.
  2. The change between 2011–12 and 2022–24 is not statistically significant.

Acknowledgements

The ABS would like to acknowledge our partnership with Sonic Healthcare Australia Pathology who was the pathology provider for the NHMS 2022–24. 

The ABS would also like to acknowledge the assistance and advice received from specialists in the duration of the National Health Measures Survey planning and dissemination, including the following peer reviewers:

  • Prof. Jonathan Shaw, Deputy Director (Clinical and Population Health), the Baker Heart and Diabetes Institute
  • Dr. Bernie Towler, Principal medical advisor, (Population Health Division), the Department of Health and Aged Care
  • Prof. Steve Chadban, Head of the Department of Renal Medicine at the Royal Prince Alfred Hospital and chair of the Chronic Kidney Disease Advisory Group at the Australian Institute of Health and Welfare
  • Dr. Melanie Wyld, renal and transplant physician, Westmead Hospital and clinical epidemiologist, the University of Sydney
  • Prof. Derek Chew, Director of Cardiology, MonashHeart and the Victorian Heart Hospital.

The ABS greatly values the knowledge, expertise and contributions of these reviewers and thanks them for their time and input.

Data downloads

National Health Measures Survey 2022–24

Data files

Footnotes

  1. Australian Institute of Health and Welfare, ‘Diabetes: Australian facts – Summary’, https://www.aihw.gov.au/reports/diabetes/diabetes/contents/summary; accessed 31/01/2025.
  2. Diabetes Australia, ‘What is Diabetes?’, https://www.diabetesaustralia.com.au/about-diabetes/what-is-diabetes/; accessed 30/01/2025.
  3. Australian Bureau of Statistics, ‘Causes of Death, Australia, 2023’, https://www.abs.gov.au/statistics/health/causes-death/causes-death-australia/2023; accessed 31/01/2025.
  4. World Health Organisation, ‘Classification of diabetes mellitus’, https://www.who.int/publications/i/item/classification-of-diabetes-mellitus; accessed 31/01/2025.
  5. Australian Diabetes Society, ‘Guidance concerning the use of glycated haemoglobin (HbA1c) for the diagnosis of diabetes mellitus - Position statement of the Australian Diabetes Society’, https://www.mja.com.au/journal/2015/203/2/guidance-concerning-use-glycated-haemoglobin-hba1c-diagnosis-diabetes-mellitus; accessed 31/01/2025.
  6. d’Emden MC, Shaw JE, Colman PG, Colagiuri S, Twigg SM, Jones GRD, Goodall I, Schneider HG and N Cheung NW, ‘The role of HbA1c in the diagnosis of diabetes mellitus in Australia’, https://www.mja.com.au/journal/2012/197/4/role-hba1c-diagnosis-diabetes-mellitus-australia; accessed 31/01/2025.
  7. Australian Institute of Health and Welfare, ‘Australian Burden of Disease Study 2024’, https://www.aihw.gov.au/reports/burden-of-disease/australian-burden-of-disease-study-2024/contents/summary; accessed 31/01/2025.
  8. Australian Institute of Health and Welfare, ‘Heart, stroke and vascular disease: Australian facts- Risk factors for heart, stroke and vascular disease', https://www.aihw.gov.au/reports/heart-stroke-vascular-diseases/hsvd-facts/contents/risk-factors; accessed 31/01/2025.
  9. The National Heart Foundation of Australia, ‘Blood cholesterol’, https://www.heartfoundation.org.au/your-heart/high-blood-cholesterol; accessed 31/01/2025.
  10. The National Heart Foundation of Australia, ‘2023 Guideline for assessing and managing CVD risk and Australian CVD risk calculator’, https://www.heartfoundation.org.au/for-professionals/guideline-for-managing-cvd; accessed 31/01/2025.
  11. Kidney Health Australia, ‘What is kidney disease: factsheet’, https://kidney.org.au/resources/factsheets-and-photosheets/what-is-chronic-kidney-disease-factsheet; accessed 31/01/2025.
  12. Kidney Health Australia, ‘Estimated glomerular filtration rate’, https://kidney.org.au/resources/factsheets-and-photosheets/egfr; accessed 31/01/2025.
  13. Australian Institute of Health and Welfare, ‘Chronic kidney disease: Australian facts’, https://www.aihw.gov.au/reports/chronic-kidney-disease/chronic-kidney-disease/contents/risk-factors; accessed 31/01/2025.
  14. Kidney Health Australia, ‘Albuminuria’, https://assets.kidney.org.au/resources/KHA-Factsheet-Albuminuria-Jan2025.pdf; accessed 31/01/2025.
  15. Liver Foundation, ‘About the liver’, https://liver.org.au/your-liver/about-the-liver/; accessed 31/01/2025.
  16. Pathology Tests Explained, ‘ALT (Alanine Aminotransferase)’, https://pathologytestsexplained.org.au/ptests.php?q=ALT%20(Alanine%20aminotransferase); accessed 31/01/2025.
  17. Liver Foundation, ‘Liver tests explained’, https://liver.org.au/your-liver/liver-terms-explained/; accessed 31/01/2025.
  18. Health Direct, ‘Iron Deficiency’, https://www.healthdirect.gov.au/iron-deficiency; accessed 31/01/2025.
  19. World Health Organization, ‘Haemoglobin concentrations for the diagnosis of anaemia and assessment of severity’, https://www.who.int/publications/i/item/WHO-NMH-NHD-MNM-11.1; accessed 31/01/2025.
  20. World Health Organisation, ‘WHO guideline on use of ferritin concentrations to assess iron status in individuals and population’, https://iris.who.int/handle/10665/331505; accessed 31/01/2025.
  21. Gibson, RS, & Friel, JK, ‘Principles of Nutritional Assessment: Iron’, https://nutritionalassessment.org/iron/index.html; accessed 31/01/2025.
  22. World Health Organisation, ‘Serum ferritin concentrations for the assessment of iron status in individuals and populations: technical brief’, https://www.who.int/publications/i/item/9789240008526; accessed 31/01/2025.
  23. World Health Organization, ‘Serum transferrin receptor levels for the assessment of iron status and iron deficiency in populations’, https://www.who.int/publications/i/item/WHO-NMH-NHD-EPG-14.6; accessed 31/01/2025.
  24. Tomic D, Salim A, Morton JI, Magliano DJ, Shaw JE, ‘Reasons for hospitalisation in Australians with type 2 diabetes compared to the general population, 2010–2017’, https://www.sciencedirect.com/science/article/abs/pii/S0168822722009573?via%3Dihub; accessed 31/01/2025.
  25. Kidney Health Australia, ‘Anaemia and Kidney Disease’, https://kidney.org.au/your-kidneys/living-with-kidney-disease/anaemia; accessed 31/01/2025.
  26. Eat for Health, ‘Iodine’ https://www.eatforhealth.gov.au/nutrient-reference-values/nutrients/iodine; accessed 31/01/2025.
  27. World Health Organisation, ‘Assessment of iodine deficiency disorders and monitoring their elimination: a guide for programme managers, 3rd ed’, https://www.who.int/publications/i/item/9789241595827; accessed 31/01/2025.
  28. Eat for Health, ‘Vitamin D’, https://www.eatforhealth.gov.au/nutrient-reference-values/nutrients/vitamin-d; accessed 31/01/2025.
  29. World Health Organisation, ‘Serum and red blood cell folate concentrations for assessing folate status in populations’, https://www.who.int/publications/i/item/WHO-NMH-NHD-EPG-15.01; accessed 31/01/2025.
  30. Gibson, RS, ‘Principles of Nutritional Assessment, Chapter 22: Folate and vitamin B12’, https://global.oup.com/academic/product/principles-of-nutritional-assessment-9780195171693?cc=au&lang=en&; accessed 31/01/2025.
  31. Eat for Health, ‘Vitamin B12’, https://www.eatforhealth.gov.au/nutrient-reference-values/nutrients/vitamin-b12; accessed 31/01/2025.
  32. de Benoist B, ‘Conclusions of a WHO Technical Consultation on Folate and Vitamin B12 Deficiencies’, https://journals.sagepub.com/doi/abs/10.1177/15648265080292S129; accessed 31/01/2025.

Post-release changes

3 April 2025

  • Corrections made to minor typographical and formatting errors in the commentary and data downloads.

Methodology

Scope

Includes:

  • all usual residents in Australia aged 2 years and over living in private dwellings
  • urban and rural areas in all states and territories, excluding very remote parts of Australia and discrete Aboriginal and Torres Strait Islander Communities.

Geography

The data available includes estimates for:

  • Australia.

Source

The National Health Measures Survey conducted by the Australian Bureau of Statistics.

Collection method

Face-to-face interview with an Australian Bureau of Statistics Interviewer

Biomedical sample collection by a trained Sonic Healthcare Australia Pathology specimen collector.  

Concepts, sources and methods

Descriptions of the underlying biomedical testing methods are available in IHMHS: Concepts, Sources and Methods

Health conditions are presented using a classification based on the 10th revision of the International Classification of Diseases (ICD-10).

History of changes

Full history of changes.

View full methodology
Back to top of the page