National Health Measures Survey methodology

Latest release
Reference period
2022-24

Overview

Scope

Includes:

  • all usual residents in Australia aged 2 years and over living in private dwellings
  • urban and rural areas in all states and territories, excluding very remote parts of Australia and discrete Aboriginal and Torres Strait Islander Communities.

Geography

The data available includes estimates for:

  • Australia.

Source

The National Health Measures Survey conducted by the Australian Bureau of Statistics.

Collection method

Face-to-face interview with an Australian Bureau of Statistics Interviewer

Biomedical sample collection by a trained Sonic Healthcare Australia Pathology specimen collector.  

Concepts, sources and methods

Descriptions of the underlying biomedical testing methods are available in IHMHS: Concepts, Sources and Methods

Health conditions are presented using a classification based on the 10th revision of the International Classification of Diseases (ICD-10).

History of changes

Full history of changes.

About this survey

The 2022-2024 National Health Measures Survey (NHMS) is a component of the wider Intergenerational Health and Mental Health Study (IHMHS) funded by the Australian Government Department of Health and Aged Care.

The 2022-24 NHMS was conducted from January 2022 to April 2024. Biomedical samples were collected from respondents who participated in either the 2022 National Health Survey (NHS) or the 2023 National Nutrition and Physical Activity Survey (NNPAS). Across the two surveys data was collected from approximately 22,000 households. Biomedical samples were collected from approximately 7,500 respondents.

The main aims of the NHMS are to provide information on:

  • chronic disease and nutrient biomarker levels
  • health risk factors
  • objective causes of disease. 

Biomedical tests included:

  • chronic disease biomarkers, including tests for diabetes, cholesterol, triglycerides, kidney disease and liver function
  • nutrition biomarkers, including tests for iron, folate, iodine, vitamin B12 and vitamin D levels.

Additional key topics included:

  • demographics and socio-economic characteristics of people
  • educational attainment and attendance
  • labour force participation
  • selected self-report health conditions
  • physical measures (weight, height, waist circumference and blood pressure).

How the data is collected

Scope

The scope of the survey included:

  • usual residents in Australia aged 2 years and over living in private dwellings
  • both urban and rural areas in all states and territories, except for very remote parts of Australia and discrete Aboriginal and Torres Strait Islander communities.

The following people were excluded:

  • visitors to private dwellings
  • overseas visitors who have not been working or studying in Australia for 12 months or more, or do not intend to do so
  • members of non-Australian defence forces stationed in Australia and their dependants
  • non-Australian diplomats, diplomatic staff and members of their households
  • people who usually live in non-private dwellings, such as hotels, motels, hostels, hospitals, nursing homes and short-stay caravan parks (people in long-stay caravan parks, manufactured home estates and marinas are in scope)
  • people in very remote areas
  • discrete Aboriginal and Torres Strait Islander communities
  • households where all Usual Residents are less than 18 years of age.

Sample design

The NHMS combined responses from the 2022 NHS and 2023 NNPAS. Households were randomly selected to participate in the 2022 NHS and the 2023 NNPAS. Households could not be selected in both surveys.  One adult (18+ years) and one child (0-17 years in the 2022 NHS, 2-17 years in the 2023 NNPAS) were randomly selected from each household. Responses for children less than 2 years of age who may have participated in the 2022 NHS were not included in the NHMS. 

Respondents aged 5 years and over were eligible to provide biomedical samples for testing. Participation in the biomedical component was voluntary. Respondents aged 5-11 years were invited to provide a urine sample. Respondents aged 12 years and over were invited to provide blood and urine samples. 

Collection method

Households could complete an initial household form, which collected basic demographic information about all usual residents of the household, via an online form, telephone interview or face-to-face interview. The individual questionnaires were completed via face-to-face interview only.  

At the completion of the 2022 NHS or 2023 NNPAS surveys, trained interviewers explained the biomedical component and provided an information pack to respondents who agreed to participate. Informed consent was sought from the respondent or guardian of participants less than 18 years old prior to sample donation. 

Ethics approval for the collection of biomedical samples was gained from a Human Research Ethics Committee at Bellberry Limited (Protocol number 906-A-3).

Respondents who agreed to provide biomedical samples were asked to attend a collection centre at their earliest convenience. Respondents who did not attend within 14 days received a reminder (up to three phone calls and a letter) to attend a collection centre if they still wished to participate. Respondents could withdraw at any time. 

Participants were asked to fast for at least 8 hours before giving blood samples. Blood samples were still collected even if they didn’t fast for the full 8 hours.

Biomedical samples were collected at Sonic Healthcare Australia Pathology collection clinics, their subsidiaries or via a home visit using standard operating procedures for phlebotomy collection. 

All blood and urine samples were sent to a central laboratory, Douglass Hanly Moir Pathology (DHM) in Sydney, Australia. Most of the biomedical testing was performed at DHM on machines accredited by the National Association of Testing Authorities (NATA). Iodine testing was performed by Sullivan Nicolaides Pathology in Queensland. All samples were tested on the same machines for the duration of the study. Machines were subject to ongoing internal and external quality control/assurance processes. No quality issues were flagged during the study.  

Participants were provided with a pathology report of their results via post and/or email. Participants could also nominate for their results to be sent to their regular doctor. When a test result required medical follow-up, Sonic Healthcare Australia Pathology contacted the respondent’s nominated doctor. If no doctor was nominated, the respondent was contacted by a qualified health professional and were advised of appropriate action. 

To cover expenses for travel, child-care or time off work, respondents were provided a reimbursement of $75, paid via gift card.
Response rates

There were 21,915 fully/adequately responding households across the 2022 NHS and 2023 NNPAS, a response rate of 56.0%. The following table presents household responses across each state and territory. 

2022 NHS and 2023 NNPAS combined household response rate
 Households approached (after sample loss) (no.)Fully/adequately responding households (no.)Response rate (%)
NSW8,5324,50452.8
Vic.6,4603,45653.5
Qld5,0923,06060.1
SA3,8032,27359.8
WA4,6933,06865.4
Tas.3,8062,22058.3
NT3,2351,60440.3
ACT3,4892,03058.2
Aust.39,11021,91556.0

Of the 26,725 respondents aged 5 years and over, 7,479 provided biomedical samples, a response rate of 28.0%. The following table presents response rates for the biomedical component. 

Biomedical component response rate table
  Number of persons (no.)Proportion of persons (%)
5 years and over 
 Persons in NHS and NNPAS26,725100.0
  Participated in biomedical component7,47928.0
  Urine sample provided7,26027.2
  Did not participate in biomedical component19,24672.0
12 years and over 
 Persons in NHS and NNPAS24,220100.0
  Participated in biomedical component7,02129.0
  Blood sample provided 
  Fasting sample4,86820.1
    Non fasting sample2,0708.5
  Did not participate in biomedical component17,19971.0

Not all biomedical respondents aged 12 years and over provided fasting blood and urine samples. Some respondents only provided a blood sample or a urine sample. This may have been through choice, or an inability to provide a sample at the time they attended a collection centre.  The sample types provided by biomedical respondents for different age groups are provided in the table below. 

Sample types provided by biomedical respondents 
Age GroupParticipated in biomedical component (count, unweighted)Provided blood sample (%)Provided fasting blood sample (%)Provided urine sample (%)Provided blood and urine sample (%)
12-1738188.757.593.482.2
18-2425099.670.094.894.4
25-3475199.365.897.997.2
35-441,09499.166.296.395.3
45-541,01598.968.997.996.8
55-641,24499.574.796.996.4
65-741,41199.672.797.497.1
75+87599.868.896.896.6
Total 7,02198.869.397.195.7

Content

Only content included in both the 2022 NHS and 2023 NNPAS surveys was included in the 2022-24 NHMS. The surveys collected the following content: 

  • demographics – age, sex at birth, gender, marital status
  • household details – type, size, household composition, tenure
  • labour force status
  • educational attainment
  • self-reported height and weight
  • long-term health conditions – cardiovascular diseases, diabetes, kidney disease
  • smoking status
  • physical measures – blood pressure, height, weight, and waist.

Chronic disease and nutrient biomarkers were measured in the provided blood and/or urine samples. The measured biomarkers are presented in the table below.

Summary of chronic disease and nutrient biomarkers
  AgeSample typeFasting
Cardiovascular disease biomarkersTotal cholesterol12+BloodNo
High-density lipoprotein (HDL) cholesterol12+BloodNo
Low-density lipoprotein (LDL) cholesterol12+BloodYes
Triglycerides12+BloodYes
Diabetes biomarkersFasting plasma glucose12+BloodYes
Glycated haemoglobin (HbA1c)12+BloodNo
Chronic kidney disease biomarkersUrine albumin5+UrineNo
Urine creatinine5+UrineNo
Albumin/creatinine ratio (ACR)5+UrineNo
Serum creatinine12+BloodNo
Estimated glomerular filtration rate (eGFR)18+BloodNo
Liver function biomarkersAlanine aminotransferase (ALT)12+BloodNo
Gamma glutamyl transferase (GGT) 12+BloodNo
Iron Studies and AnaemiaSerum ferritin 12+BloodNo
Soluble transferrin receptor 12+BloodNo
C-reactive protein (CRP) 12+BloodNo
Haemoglobin (Hb)12+Blood No
FolateSerum folate12+Blood No
Vitamin BSerum vitamin B1212+BloodNo
Vitamin DSerum 25-hydroxyvitamin D [25(OH)D]12+ BloodNo
IodineIodine concentration5+ UrineNo
SodiumSodium concentration5+UrineNo
PotassiumPotassium concentration5+ UrineNo

The 2022-2024 NHMS uses the Standard for Sex, Gender, Variations of Sex Characteristics and Sexual Orientation Variables, 2020. Data in this publication are presented using the Sex at birth variable. When a small number of responses are recorded in any output category, outputs may be suppressed or combined into other categories due to confidentiality and statistical issues. A small number of people in the study reported having a term other than male or female recorded as their sex at birth. Estimates for people whose sex at birth is neither male or female are not able to be output as a separate category but they are included in the estimates for total Persons. 

See the Intergenerational Health and Mental Health Study: Concepts, Sources and Methods for full details on laboratory testing methods.

See the Data Item List for full details of content collected in the 2022-2024 NHMS. 

How the data is processed

Estimation methods

As only a sample of people in Australia were surveyed, results needed to be converted into estimates for the whole population. This was done through a process called weighting:

  • Each person or household is given a number (known as a weight) to reflect how many people or households they represent in the whole population.
  • A person or household’s initial weight is based on their probability of being selected in the sample. For example, if the probability of being selected in the survey was one in 45, then the person would have an initial weight of 45 (that is, they would represent 45 people).

The person and household level weights are then calibrated to align with independent estimates of the in-scope population, referred to as ‘benchmarks’. The benchmarks use additional information about the population to ensure that:

  • people or households in the sample represent people or households that are similar to them
  • the survey estimates reflect the distribution of the whole population, not the sample.

Two person level weights were created for the 2022-24 NHMS. The first weight was created for all respondents from the pooled NHS/NNPAS surveys. This weight can be used to create estimates for non-biomedical test variables (e.g., BMI, smoking, education level). The second weight (biomedical weight) was created for respondents who participated in the biomedical component. The biomedical weight was used for creating biomedical test estimates. The biomedical weights are different to the person weights for the combined NHS/NNPAS due to different response patterns in the voluntary biomedical component and main surveys. 

There were some differences in characteristics between people who chose to participate in the biomedical collection and those who did not. The ABS investigated whether biomedical test estimates could be improved by adjusting for these differences in using different benchmarks. We considered multiple variables, including:

  • smoking status
  • Body Mass Index
  • marital status
  • employment status
  • self-reported long term health conditions (including diabetes and HSV disease).

While using some of these variables could have improved the accuracy of some biomedical test estimates, they made little difference to the main variables of interest and increased the measure of sampling error. For this reason, the ABS did not adjust the biomedical weights to account for any bias from these variables. 

Benchmarks align to the Australian estimated resident population (ERP) at September 2022 which was 10,029,000 households and 25,433,000 people (after excluding people living in non-private dwellings, very remote areas of Australia and discrete Aboriginal and Torres Strait Islander communities).

Sample counts and weighted estimates are presented in the table below. 

Sample counts and weighted estimates, NHS/NNPAS pooled household weight
Household CompositionHouseholds in sampleWeighted Estimate
Adults in household (no.)Children in household (no.)Households (no.)Households (‘000)
106,0892,737.1
11387152.1
12 or more445173.0
207,1053,263.1
211,589633.8
22 or more3,0461,013.5
3 or more02,1271,523.8
3 or more1657427.6
3 or more2 or more470295.0
Total 21,91510,219.0
Sample counts and weighted estimates, NHS/NNPAS pooled person weight
 Persons in NHS/NNPAS sampleWeighted Estimate
Age group (years)Males (no.)Females (no.)Persons (no.)Males (‘000)Females (‘000)Persons (‘000)
2-45395221,061463.8434.5898.3
5-111,2601,2452,5051,155.31,091.62,246.8
12-171,2161,0862,305984.1926.71,911.9
18-247277021,4311,137.51,068.62,207.4
25-341,6121,6793,2931,849.81,871.63,721.9
35-441,9052,1304,0371,764.51,823.73,592.4
45-541,6071,7423,3501,588.01,645.63,234.9
55-641,6191,8733,4921,455.21,532.52,987.8
65-741,6391,8953,5341,158.61,260.22,418.8
75 years and over1,1941,5842,778848.7985.11,833.8
Total all ages13,31814,45827,78612,405.412,640.025,054.0
Sample counts and weighted estimates, biomedical weight
 Persons in biomedical sampleWeighted Estimate
Age group (years)Males (no.)Females (no.)Persons (no.)Males (‘000)Females (‘000)Persons (‘000)
5-112332254581,155.31,091.62,246.8
12-17203178381984.1926.71,911.9
18-24981522501,137.51,068.62,207.4
25-343364157511,849.81,871.63,721.9
35-444906041,0941,764.51,823.73,592.4
45-544355791,0151,588.01,645.63,234.9
55-645427021,2441,455.21,532.52,987.8
65-746667451,4111,158.61,260.22,418.8
75 years and over418457875848.7985.11,833.8
Total all ages3,4214,0577,47911,945.712,206.724,155.7

Accuracy

Show all

Content changes

The following table summarises content changes applied to the 2022-2024 NHMS compared with the previous iteration in 2011-12. For full details of data items, refer to the Data Item List.

2022-24 NHMS content changes (changes between 2022-24 NHMS and 2011-12 Australian Health Survey (AHS))
TopicChanges
Overall
  • Instrument design and layout changes introduced to improve usability.
Gender and sexual orientation
Visa status
  • New question module and associated outputs.
Main language spoken at home
  • Question and sequencing updates to improve comparability across other household surveys. 
Education
  • Question and sequencing updates to improve comparability across other household surveys.
Employment
  • Question and sequencing updates to improve comparability across other household surveys. 
Self-reported physical measurements
  • New question module and associated outputs. Respondents asked module prior to actual physical measurements being collected. 
Smoking
  • Question and sequencing updates to improve comparability across other household surveys. 
Health conditions
  • Conditions coder updated
  • Minor changes to question wording and sequencing across all condition modules to improve user experience and data quality.
Physical Measurements (height, weight, waist and blood pressure)
  • Due to COVID-19, the procedures for collecting physical measurements have been adapted to account for increased hygiene and social distancing measures, including a move to collection via self-measurements only (rather than via ABS Interviewers) and use of single use waist measurement tape
  • New scales allowed for weight measurement up to 200kg.

Several data items available in the 2011-12 AHS were not able to be pooled for the 2022-24 NHMS. Data items not available in the 2022-24 NHMS may be available in the 2022 NHS or the 2023 NNPAS. The following table summarises the items not available in the 2022-24 NHMS.

Summary of content unavailable in the 2022-24 NHMS (concepts removed between 2022-24 NHMS and 2011-12 AHS)
Data Level Topics
Household
  • Tenure type
  • Number of bedrooms / housing suitability
  • Financial stress
  • Food security
  • Household smoking and exposure to tobacco smoke.
Person
  • Personal income
  • Self-assessed health
  • Female life stages
  • Physical activity
  • Alcohol consumption
  • Dietary behaviours.
Biomedical
  • Cotinine (a measure of recent nicotine exposure)
  • Red blood cells folate (a measure of folate content in red blood cells, no longer preferred test)
  • Apolipoprotein B (used in the assessment of cardiovascular risk).

Comparability with previous surveys

Data outputs from the 2022-24 NHMS are broadly comparable with the previous 2011-12 AHS aside from the exceptions below.

The following factors should be considered when making comparisons: 

  • Results from ALT and soluble transferrin receptor testing should not be compared with the previous survey due to substantial changes in test methodology. See the Intergenerational Health and Mental Health Study: Concepts, Sources and Methods for more information on the time series comparability of biomedical tests.
  • Participation in the biomedical testing component of the survey is voluntary. Respondents could choose to provide blood and/or urine samples. Consideration should be given to the characteristics of respondents providing specific samples when performing analysis particularly for smaller sub-populations.
  • Imputation was performed for physical measurement data to account for higher rates of non-response. Imputation was not performed in the 2011-12 AHS. Proportions should be used for comparisons.
  • 'Heart, stroke and vascular disease' has been redefined to include persons who reported having ischaemic heart diseases and cerebrovascular diseases that were not current and long-term at the time of interview. Data released for the 2011-12 AHS does not include those people who reported those conditions as not current and long-term at the time of interview.
  • Standard classifications used in the NHMS have been updated since the 2011-12 AHS. These include: the Standard Australian Classification of Countries (SACC), the Australian and New Zealand Standard Industrial Classification (ANZSIC), the Australian and New Zealand Classification of Occupations and the Australian Standard Classification of Education (ASCED). More information of ABS standard classifications can be found on the website. 

How the data is released

Release strategy

This release presents estimates of selected chronic disease and nutrition biomarkers for 2022-24. Commentary presents analysis by age groups, sex, state and selected population characteristics. 

Data cubes (spreadsheets) in this release present tables of estimates, proportions, means, quartiles and their associated measures of error. A data item list and concordance between the 2022-24 NHMS conditions output classification and that of the 2011-12 AHS and 2022 NHS is also available. 

Detailed microdata is available on Datalab for users who want to undertake interactive (real time) complex analysis of microdata in the secure ABS environment. 

Results of per- and polyfluoroalkyl substance testing will be available on the ABS website and as detailed microdata via Datalab later in 2025. 

Confidentiality

The Census and Statistics Act 1905 authorises the ABS to collect statistical information and requires that information is not published in a way that could identify a particular person or organisation. The ABS must make sure that information about individual respondents cannot be derived from published data.

To minimise the risk of identifying individuals in aggregate statistics, a technique called perturbation is used to randomly adjust cell values. Perturbation involves small random adjustment of the statistics. This has a negligible impact on the underlying pattern. This is considered the most satisfactory technique for avoiding the release of identifiable data while maximising the range of information that can be released. After perturbation, a given published cell value will be consistent across all tables. However, adding up cell values in Data Cubes to derive a total may give a slightly different result to the published totals.

Biomedical test ranges

Biomedical tests were ranged according to established cut-offs. The following table defines the criteria applied to each biomedical test. 

Biomedical test outcome criteria
Test Criteria
Cardiovascular disease biomarkersTotal cholesterol

Normal: <5.5 mmol/L 

Abnormal: ≥5.5 mmol/L

HDL cholesterol

Normal:

  • Male: ≥1.0 mmol/L
  • Female: ≥1.3 mmol/L

Abnormal: 

  • Male: <1.0 mmol/L
  • Female: <1.3 mmol/L
LDL cholesterol

Normal: <3.5 mmol/L

Abnormal: ≥3.5 mmol/L

Trigylcerides

Normal: <2.0 mmol/L

Abnormal: ≥2.0 mmol/L

Diabetes biomarkersFasting plasma glucose

Normal: <6.1 mmol/L

At risk of diabetes: 6.1 to <7.0 mmol/L

Indicates diabetes: ≥7.0 mmol/L

HbA1c

NGSP units

  • Normal: <6.0%
  • At risk of diabetes: 6.0 to 6.4%
  • Indicates diabetes: ≥6.5 %

SI units

  • Normal: <42 mmol/mol Hb
  • At risk of diabetes: 42 to 47 mmol/mol Hb
  • Indicates diabetes:  ≥48 mmol/mol Hb
Chronic kidney disease biomarkersUrine albuminNo criteria applied.
Urine creatinineNo criteria applied. 
ACR

Normoalbuminuria: 

  • Male: <2.5 mg/mmol
  • Female: <3.5 mg/mmol

Microalbuminuria: 

  • Male: 2.5 to 25 mg/mmol
  • Female: 3.5 to 35 mg/mmol

Macroalbuminuria: 

  • Male: >25 mg/mmol
  • Female: >35mg/mmol
eGFR

Normal: >60 mL/min/1.73m2

Abnormal: ≤60 mL/min/1.73m2

Liver function biomarkersALT

Normal: 

  • Male:
    • 12 years and over: ≤ 40 U/L
  • Female:
    • 12 years and over: ≤ 30 U/L

Abnormal: 

  • Male:
    • 12 years and over: > 40 U/L
  • Female:
    • 12 years and over: > 30 U/L
GGT

Normal: 

  • Male:
    • 12-14 years: ≤ 30 U/L
    • 15-17 years: ≤ 40 U/L
    • 18 years and over: ≤ 50 U/L
  • Female:
    • 12-14 years: ≤ 30 U/L
    • 15 years and over: ≤ 35 U/L

Abnormal: 

  • Male:
    • 12-14 years: > 30 U/L
    • 15-17 years: > 40 U/L
    • 18 years and over: > 50 U/L
  • Female:
    • 12-14 years: > 30 U/L
    • 15 years and over: > 35 U/L
Iron Studies and AnaemiaSerum ferritin No criteria applied. 
Soluble transferrin receptorNo criteria applied. 
C-reactive proteinNo criteria applied. 
Haemoglobin

Normal: 

  • Male:
    • 12-14 years: ≥ 120 g/L
    • 15 years and over: ≥130 g/L
  • Female:
    • Pregnant: ≥110 g/L
    • Not pregnant:  ≥120 g/L                                       

Abnormal: 

  • Male:
    • 12-14 years: <120 g/L
    • 15 years and over: <130 g/L
  • Female:
    • Pregnant: <110 g/L
    • Not pregnant:  <120 g/L                                       
FolateSerum FolateNo criteria applied. 
Vitamin BSerum vitamin B12No criteria applied.
Vitamin DSerum 25-hydroxyvitamin D [25(OH)D]

Adequate levels: ≥50 nmol/L

Mild deficiency: 30 to 49 nmol/L

Moderate/severe deficiency: <30 nmol/L

Urinary IonsIodine concentrationNo criteria applied to individual respondents. Urinary ion results are only applicable at a population level. 
Sodium concentration
Potassium concentration 

Chronic disease prevalence

Chronic disease prevalence for dyslipidaemia, diabetes and chronic kidney disease were estimated using a combination of some or all of the following;

  • biomedical test results
  • self-reported long-term health conditions
  • self-reported medication usage (at time of biomedical sample collection).
Dyslipidaemia

Dyslipidaemia refers to several different lipid disorders (that is, conditions where there are too many or too few fats in the blood). A respondent has dyslipidaemia if they had a least one of the following: 

  • abnormal test result for total cholesterol
  • abnormal test result for HDL cholesterol
  • abnormal test result for LDL cholesterol
  • abnormal test result for triglycerides
  • use of lipid-lowering medication.

Diabetes

Diabetes prevalence was derived using a combination of blood test results, self-reported diabetes and self-reported diabetes medication usage.

Respondents with diabetes were separated into those with known diabetes and those with newly diagnosed diabetes. Respondents without diabetes were separated into those at risk of developing diabetes and those with normal blood test results. The following table outlines the definition of each diabetes status.

Diabetes status definitions
Diabetes status Definition 
Has diabetesKnown diabetes
  • self-reported diabetes diagnosis and self-reported taking medications to treat diabetes
  • self-reported diabetes diagnosis and had a blood test result indicating diabetes.
Newly diagnosed diabetes
  • no self-reported diabetes diagnosis and had a blood test result indicating diabetes.
Does not have diabetesAt high risk of diabetes
  • no self-reported diabetes diagnosis and had a blood test result indicating a risk of developing diabetes
  • blood test results indicate a high risk of developing diabetes, self-reported diabetes but did not self-report taking medications to treat diabetes.
Does not have diabetes
  • blood test results were normal and no self-reported diabetes diagnosis
  • blood test results were normal, self-reported diabetes diagnosis but did not self-report taking medications to treat diabetes.

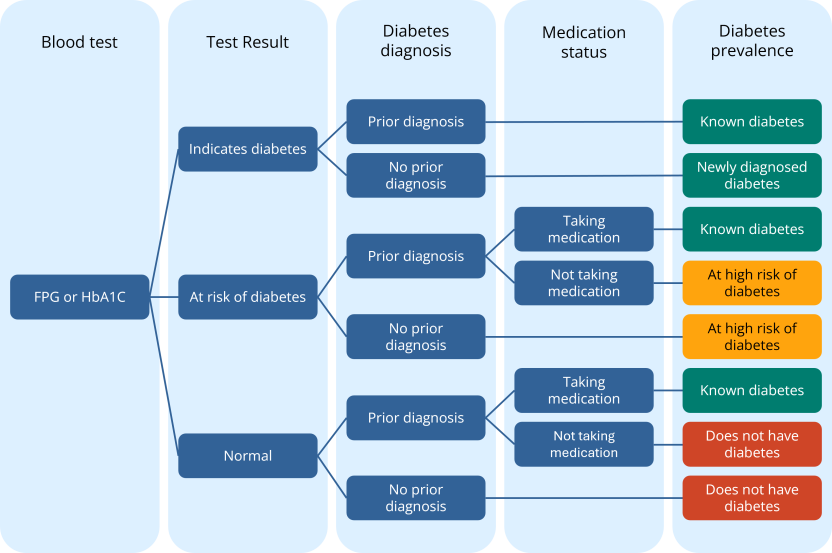
Diabetes can be diagnosed using either fasting blood glucose test results or HbA1c test results. Diabetes prevalence was determined separately for respondents with fasting blood glucose test results and HbA1c test results. Figure 1 illustrates the determination of diabetes status. 

Figure 1: Determination of diabetes status

Determination of diabetes status.

Diagram of the algorithm to determine diabetes status. 

A respondent has diabetes if they have either known diabetes or newly diagnosed diabetes. A respondent has known diabetes if they self-reported a diabetes diagnosis and self-reported taking medications to treat diabetes or if they self-reported a diabetes diagnosis and had a blood test result indicating diabetes. A respondent had newly diagnosed diabetes if the did not self-report a diabetes diagnosis and had a blood test result indicating diabetes. 

A respondent does not have diabetes if they are at high risk of diabetes or have no indicators of diabetes. A respondent was at high risk of diabetes if they did not self-report a diabetes diagnosis and had a blood test indicating a high risk of developing diabetes or the self-reported a diabetes diagnosis, did not self-report taking medications for diabetes and had a blood test result indicating a high risk of developing diabetes. A respondent does not have diabetes is they had normal blood test results and did not self-report a diabetes diagnosis or they self-report a diabetes diagnosis, did not self-report taking medications for diabetes and had a blood test result indicating normal levels.  

Chronic Kidney Disease

Chronic kidney disease (CKD) was determined using a combination of ACR and eGFR test results.  No self-reported conditions or the usage of medications were considered. Chronic kidney disease is defined in stages according to kidney function. The early stages of CKD are defined by abnormal ACR and normal eGFR test results. The later stages of CKD are defined by abnormal eGFR test results. The following table defines the criteria for CKD;

Chronic kidney disease status criteria
CKD status  ACR test resulteGFR test result
Does not have CKDNormoalbuminuriaNormal
Has CKD
 Stage 1Microalbuminuria or macroalbuminuriaNormal (≥ 90 mL/min/1.73 m2)
Stage 2Microalbuminuria or macroalbuminuriaNormal (60-89 mL/min/1.73m2)
Stage 3an/aAbnormal (45-59 mL/min/1.73m2)
Stage 3bn/aAbnormal (30-44 mL/min/1.73m2)
Stage 4-5n/aAbnormal (<30 mL/min/1.73m2)

Formal diagnosis of CKD can only be made after persistent abnormal test results over a three-month period. Results in the NHMS represent a single point in time collection.

Health conditions

Self-reported health conditions were collected in both the 2022 NHS and 2023 NNPAS. The 2023 NNPAS collected information on cardiovascular conditions, diabetes and kidney disease only. Only these conditions collected in the 2023 NNPAS were included in the 2022-24 NHMS. 

A long-term health condition was defined as a medical condition (illness, injury or disability) which was current at the time of interview and had lasted, or was expected to last, 6 months or more.

Some reported conditions are considered to be long-term including diabetes, heart attack, angina, heart failure and stroke. Diabetes, heart attack, angina, heart failure and stroke were also considered to be current. Respondents could report multiple health conditions.

Any reported health conditions that did not meet this definition were excluded from estimates, e.g. a person may have been told that they had a health condition in the past but it is no longer current or expected to last 6 months or more.  Conditions that were not considered to be current and long term can be analysed using the data item Condition Status (CONDSTAT) on the survey microdata.

The classification hierarchy is based on the 10th revision of the International Classification of Diseases (ICD). A concordance of the classification to the 2011-12 AHS and 2022 NHS classification is available.

See the Data Item List for full details of the condition classification used in the 2022-24 NHMS. 

Physical measures

Voluntary measurements of height, weight and waist circumference were collected from respondents aged two years and over (respondents who advised that they were pregnant were not measured). Voluntary blood pressure measurements were also collected from adult respondents (aged 18 years and over). These measurements provide information on overweight and obesity (using Body Mass Index (BMI)) measures, risk of developing chronic disease, and high blood pressure amongst the Australian population.

Body Mass Index (BMI)

Body Mass Index (BMI) is a simple index of weight-for-height that is commonly used to classify underweight, normal weight, overweight and obesity. It is calculated from height and weight information, using the formula weight (kg) divided by the square of height (m):

\[BMI = \frac{{kg}}{{{m^2}}}\]

To produce a measure of the prevalence of underweight, normal weight, overweight or obesity in adults, people aged 18 years and over were classified based on their BMI score as recommended by the World Health Organization’s BMI Classification. The BMI categories for children consider the age and sex of the child. For a detailed list of the cut-offs see Appendix 4 in the National Health Survey: Users’ Guide, 2017–18 (cat. no. 4363.0).

Non-response rates

Physical measurements have a relatively high rate of non-response due to their voluntary and sensitive nature. To account for the high rate of non-response, imputation of values for those that did not have measurements collected was used to achieve estimates of physical measurements for the whole population.

Imputation was performed separately in the 2022 NHS and 2023 NNPAS. Results for physical measures were pooled after imputation. Non-response rates were lower in the respondents who participated in the biomedical component then those who did not. 

Physical measurement non-response rate
  Physical Measurement non-response rate (%, unweighted)
  Respondents who participated in the biomedical component (%)Respondents who did not participate in the biomedical component (%)All respondents (%)
BMI  
 Adult (18+ years)17.448.038.7
Child (5-17 years) 28.855.650.9
Child (2-4 years)n/a56.856.8
Waist  
 Adult (18+ years)14.447.137.2
Child (5-17 years)27.456.551.4
Child (2-4 years) n/a58.258.2
Blood Pressure 
 Adult (18+) 13.542.836.0

Further information on imputation is available in the National Health Survey methodology, 2022.

Age standardisation

Age standardisation is a way of allowing comparisons between two or more populations with different age structures, in order to remove age as a factor when examining relationships between variables. For example, the age structure of the population of Australia is changing over time. As the prevalence of a particular health condition (for example, diabetes) may be related to age, any increase in the proportion of people with that health condition over time may be due to real increases in prevalence or to changes in the age structure of the population over time or to both. Age standardising removes the effect of age in assessing change over time or between different populations.

Proportions quoted in commentary in this publication are not age standardised; however, proportions presented in Tables 4, 18, 26 and 27 include age standardised rates. Data are age standardised to the 2001 Australian population.  

Related information

National Health Survey methodology, 2022: Additional information on the collection of the 2022 National Health Survey.

Intergenerational Health and Mental Health Study: Concepts, Sources and Methods: Additional information on biomedical test procedures and interpretation of results.

Back to top of the page