The Accounts
The full sequence of accounts
2.25 2008 SNA divides the accounts into two main classes: the integrated economic accounts and the other parts of the accounting structure. The integrated economic accounts use the institutional units and sectors, transactions, and assets and liabilities together with the rest of the world to form the accounts. These are the accounts presented in ASNA, but not in the same format. The other parts of the accounting structure bring in the conceptual elements of production units, products, purposes, employment and population to assist in the production of the integrated economic accounts (e.g. supply-use tables) or to present the data in different ways.
2.26 The integrated economic accounts are grouped into three categories:
- Current accounts - present production, and the generation, distribution and use of income;
- Accumulation accounts - present changes in assets and liabilities and changes in net worth (the difference between assets and liabilities for a given institutional unit or group of units); and
- Balance sheets - present stocks of assets and liabilities and net worth. Opening and closing balance sheets are included with the full sequence of accounts.
2.27 The main accounts in the ASNA are as follows:
- gross domestic product (GDP) accounts - record the value of production (i.e. production of GDP), the income from production (i.e. income from GDP) and the final expenditures on goods and services produced and net international trade in goods and services (i.e. expenditure on GDP);
- income accounts - show primary and secondary income transactions, final consumption expenditures and consumption of fixed capital;
- capital accounts - record the net accumulation of non-financial assets through transactions, and the financing of the accumulation by way of saving and capital transfers;
- financial accounts - show the net acquisition of financial assets and the net incurrence of liabilities; and
- balance sheets - record the stock of financial and non-financial assets, and financial liabilities at a particular point in time.
2.28 The ASNA accounts are based on the system of accounts outlined in 2008 SNA. Each of the accounts is produced for the economy as a whole and the set of accounts together constitute the consolidated summary accounts. The ABS produces annual income and capital accounts by institutional sector based on 2008 SNA. The quarterly sectoral accounts depict national accounts using the same concepts and definitions as the annual sector accounts. These accounts are compiled for each of the following institutional sectors and subsectors: non-financial corporations (private and public), financial corporations, general government (national and state and local), and households (including NPISH).
2.29 The national accounts also include supplementary tables which provide more detailed presentations of the individual sector accounts. Although production accounts could be constructed for the four individual institutional sectors, major interest centres instead around production on an industry basis. This cuts across the institutional sectors used in the income and capital accounts since the production units are classified by industry without regard to institutional sector.
2.30 Another account that is integral to the national accounts is the external account. This account records the transactions and financial positions of the nation with the rest of the world, from the point of view of the rest of the world. In one sense, the external account is simply another sectoral account. Because of the important role of the rest of the world sector, the account is a major focus of attention for economic analysts and international organisations.
GDP accounts
2.31 The measure of production for the economy as a whole is gross domestic product (GDP). GDP is the sum, for a particular period, of the gross value added of all resident producers (where gross value added is equal to output less intermediate consumption) and net taxes on products. This is referred to as GDP measured by the production approach (GDP(P)). GDP can also be derived as the sum of factor incomes (i.e. compensation of employees, gross operating surplus and gross mixed income) and net taxes on production and imports, or as the sum of all final expenditures by residents (final consumption expenditure and GFCF), changes in inventories and exports less imports of goods and services. These are referred to as GDP measured by the income approach (GDP(I)) and GDP measured by the expenditure approach (GDP(E)), respectively. All three approaches are presented in the ASNA publications. In Australia, the combined presentation of the three approaches is referred to as the GDP accounts. These reflect the 2008 SNA production account.
2.32 Although conceptually each measure should result in the same estimate of GDP, different estimates of GDP are obtained when the three measures are compiled independently using different data sources. However, integration of the annual Australian national accounts estimates with annual balanced supply-use tables ensures that the same estimate of GDP is obtained for all three approaches for years in which these tables are available. The supply-use tables have been compiled from 1994-95 up to the year preceding the latest completed financial year, except in the June quarter where it is the latest two years.
2.33 Prior to 1994-95, the estimates using each approach are based on independent sources and there are usually differences between the GDP I, E and P estimates. Nevertheless, for these periods, a single estimate of GDP has been compiled by taking a simple average of the I, E and P estimates.
2.34 As a result of the above methods:
- there are no statistical discrepancies in either current price or chain volume terms for annual estimates from 1994-95 up to the year prior to the latest year (and the latest two years in the June quarter); and
- statistical discrepancies exist in both current price and chain volume terms between estimates obtained from the GDP I, E and P approaches and the single estimate of GDP for years prior to 1994-95, for the latest year (and the latest two years in the June quarter), and for quarterly estimates. These discrepancies are shown in the relevant tables.
2.35 There is no institutional sector dimension to any of the GDP accounts, although the GDP(I) measure could be classified this way. GDP measured by the production approach (i.e. sum of value added) is presented by industry only. The valuation of GDP in ASNA is at purchasers' prices, so net taxes on products are added to total gross value added to obtain GDP(P).
Income account
2.36 2008 SNA splits the income account into several accounts, distinguishing between the distribution, redistribution and use of income. The distribution of income is decomposed into three main steps: primary distribution (i.e. primary income), secondary distribution (i.e. secondary income) and redistribution in kind (i.e. social transfers in kind). The balancing items at the various stages are meaningful concepts of income provided all kinds of distributive current transactions are included.
2.37 The ASNA includes all such transactions. Each stage is presented in the income account with the balancing items being gross income and gross disposable income for all sectors, and adjusted disposable income for the general government and household sectors. Australia's presentation of the income account differs from 2008 SNA in that transactions regarding the distribution and redistribution of income are presented in one table.
2.38 The sectoral income accounts are a disaggregation of the national income account, recording for each institutional sector. Their net income arising from production and transfers of other sectors, and their uses of income (disbursements). The difference between income and the use of income is net saving. This balancing item is carried forward to the capital account as saving must be used to acquire financial or non-financial assets, or to reduce liabilities.
2.39 The transactions as presented in the ASNA are:
- Primary income consists of factor incomes (e.g. compensation of employees, gross operating surplus and gross mixed income, and taxes less subsidies on production and imports) and property incomes (e.g. interest, dividends, rent on land and mineral and energy resources, and reinvested earnings of direct investors and investment funds). Gross national income is the balancing item and equals total factor incomes, plus taxes less subsidies on production and imports, plus net primary income receivable from non-residents.
- Secondary income consists of current transfers. Transfers are resources provided from one institutional unit to another for which nothing of economic value is provided in return. Current transfers include taxes on income and wealth, social contributions (e.g. for workers' compensation) and benefits (e.g. unemployment benefits), current grants between governments, and donations to non-profit institutions. Gross disposable income is the balancing item and is equal to the sum of net primary income receivable and net secondary income receivable.
- Social transfers in kind exist only in the general government and household sector. They consist of goods and services provided to households by government (or NPISHs) either free or at prices that are not economically significant. They consist of final consumption expenditure undertaken by government (and NPISHs) on behalf of households, for example, education and health services.
Capital account
2.40 The capital account is the first account in the sequence of the accumulation accounts, and records the acquisitions less disposals of non-financial assets, as well as capital transfers involving the redistribution of wealth. It shows sources of funds (receipts) for financing gross capital formation, and the use of these funds (disbursements). Sources of funds comprise consumption of fixed capital, net saving transferred from the national income account and net capital transfers receivable from non-residents. On the disbursements side are shown GFCF, changes in inventories and net acquisitions of non-produced non-financial assets. Conceptually, net lending to non-residents is the balancing item of the national capital account. However, if there are statistical discrepancies in the Expenditure on GDP account, then these discrepancies must also be taken into account before deriving the balancing item. When net lending is negative, the economy is a net borrower from non-residents. Where net lending is positive, the economy is a net lender to non-residents.
2.41 2008 SNA has an entry for acquisitions less disposals of valuables. While conceptually such transactions should be recorded in the capital account, they are currently not recorded in the ASNA due to a lack of a suitable data source. It is worth noting that household final consumption expenditure (HFCE) may include some expenditure on valuables by the household sector.
2.42 The sectoral capital accounts are a disaggregation of the national capital account and show the extent to which the sum of savings and capital transfers are used to finance the acquisition of non-financial assets. The balancing item, net lending/borrowing, reflects the net lending/borrowing of a particular sector to all other sectors. Net lending is the excess of capital finance for capital acquisition and measures the amount an institutional sector has available to finance other sectors. Net borrowing is the existence of a borrowing requirement to finance capital acquisitions due to an insufficient retention of financial resources through saving and capital transfers. Capital accounts are also compiled for selected subsectors.
2.43 As sectoral production accounts are not compiled, it is not possible to show any national statistical discrepancies by sector. Accordingly, the sectoral net lending balance implicitly includes each sector's share of the national statistical discrepancy.
Financial account
2.44 The financial account records the net acquisitions of financial assets and liabilities.
2.45 The financial account explains how net lending/borrowing is affected by changes in the holding of financial assets and liabilities. The sum of these changes, net change in financial position, is conceptually equal in magnitude to the net lending/borrowing item of the capital account. The financial account for each sector shows the financial transactions associated with the net lending transactions recorded in the capital account. These accounts, however, are compiled using different sources, giving rise to differences between the two balancing items, usually due to measurement error. These differences are recorded for each institutional sector in net errors and omissions.
2.46 In the national financial account, transactions in financial assets and liabilities with non-residents are shown. The national financial account is identical to the financial account in the balance of payments. Note that the signs are reversed between the two as the balance of payments is based on the point of view of the resident, whereas the national accounts take the view of the non-resident. Financial accounts are also compiled for each sector and for a wide range of subsectors. In these financial accounts, the transactions relate to financial assets and liabilities with other sectors/subsectors.
Other changes in the volume of assets account
2.47 The other changes in the volume of assets account records the effect of exceptional events that cause not only the value, but also the volume of assets and liabilities to change. They may be divided into three main categories:
- normal appearance and disappearance of assets other than by transactions, such as discovery and depletion of mineral and energy resources, and growth and depletion of native forests; economic recognition of produced assets such as public monuments and valuables; the initiation and cancellation of contracts, leases and licences such as patents, broadcast licences and taxi plates; changes in the value of goodwill and marketing assets; and the appearance or disappearance of financial assets;
- changes in assets and liabilities due to exceptional, unanticipated events, such as natural disasters (e.g. bushfires, floods and earthquakes), war or severe acts of crime, and uncompensated seizures of assets; and
- changes in classification and structure: in the event that the activities of an institutional unit change to the extent that the unit is reclassified from one institutional sector to another (for example, from the non-financial corporations sector to the financial corporations sector), the movements of assets and liabilities between the sectors are recorded as part of other flows in this category.
2.48 The balancing item for this account is changes in net worth due to other changes in the volume of assets. In ASNA, other changes in the volume of assets are recorded in an account that reconciles the values of assets and liabilities recorded in the opening and closing balance sheets.
Revaluation account
2.49 The revaluation account records holding gains and losses which result from changes in the prices of non-financial assets and financial assets and liabilities. Holding gains and losses accrue to the owners of assets and liabilities purely as a result of holding the assets or liabilities over time, without transforming them in any way. Holding gains and losses include not only gains/losses on capital goods (such as fixed assets, land and other natural resources) and financial assets and liabilities, but also inventories, including work-in-progress.
2.50 The balancing item for this account is changes in net worth due to nominal holding gains and losses. In ASNA, holding gains and losses are recorded in an account that reconciles the values of assets and liabilities recorded in the opening and closing balance sheets.
2.51 Holding gains and losses measured based on current prices are called nominal holding gains and losses. 2008 SNA notes that these nominal gains and losses can be further decomposed into neutral holding gains and losses, reflecting changes in the general price level, and real holding gains and losses, reflecting changes in the relative prices of assets. The ASNA shows this decomposition for the total economy and for the household sector.
Balance sheets
2.52 The national balance sheet shows, at certain points, the aggregate value of Australian residents' non-financial assets, their financial claims on non-residents, and their liabilities to non-residents. The balancing item is net worth, representing the difference between assets and liabilities. Net worth is equivalent to the present value of the stock of economic value a unit or sector holds.
2.53 Similar information is shown for each sector in the sectoral balance sheets. For financial assets and liabilities, the amounts shown are the outstanding claims on and liabilities to other sectors on the balance sheet dates. For non-financial assets, the amounts shown represent each sector's share of the Australian value as at the balance sheet dates.
2.54 The opening and closing balance sheets display assets, liabilities and net worth valued at the prices of the date for which the balance sheet is compiled. Conceptually, the entries for assets and liabilities in the closing balance sheet are equal to the entries in the opening balance sheet plus changes in the accumulation accounts; that is, the capital account; the financial account; the other changes in the volume of assets account; and the revaluation account.
2.55 2008 SNA includes entries for valuables and non-produced non-financial assets. Conceptually, these assets should be recorded in the balance sheets. However, valuables and certain non-produced non-financial assets are not recorded in the ASNA due to a lack of suitable data sources. The excluded non-produced non-financial assets are water resources, goodwill and marketing assets and contracts, leases and licences (except for spectrum licenses).
2.56 Supplementing the balance sheets are accounts that show the changes in balance sheet positions during a particular period. In these accounts, changes in balance sheets are decomposed into transactions (which are equivalent to the relevant transactions recorded in the capital and financial accounts), revaluations due to the effect of price changes, and other changes affecting the volume of assets and liabilities.
External account
2.57 The external accounts show the economy's transactions and stock positions with non-residents, from a non-resident perspective.
2.58 In ASNA, external income, capital, financial and balance sheet accounts are provided. The external income account is analogous to the balance of payments current account. As such, its balance is the same as, but opposite in sign to, the balance on the current account as recorded in the balance of payments. The balance on the external capital account (net lending) is the same as, but opposite in sign to, the sum of the current and capital account balances in the balance of payments. The external financial account includes the balance of payments financial account together with net lending of non-residents (the sum of the balance of payments current and capital account balances) and the difference between the two; that is, the balance of payments net errors and omissions item.
Integrated presentation of the Accounts
2.59 Once all elements have been produced, it is possible to present in detail the integrated accounts. The integrated accounts give a complete picture of the accounts of the total economy including balance sheets in a way that permits the principal economic relations and the main aggregates to be shown. The level of detail can vary depending on the purpose.
2.60 The following table provides a summary of the accounts, balancing items and main aggregates within the 2008 SNA and the comparison with the ASNA. The purpose of the table is to illustrate how the ASNA presentation compares with the 2008 SNA presentation.
| SNA presentation | ASNA presentation | |||
|---|---|---|---|---|
| Account | Balancing item | Main aggregate | Account | Main aggregate |
| Current accounts | ||||
| Production account | GDP accounts | |||
| Production account Goods and services account Generation of income account | Value added Operating surplus/mixed income | Domestic product | Production of GDP (GDP(P)) Expenditure on GDP (GDP(E)) Income from GDP (GDP(I)) | Gross Domestic Product |
| Distribution of income accounts | National income account | |||
| Allocation of primary income account | Balance of primary income | National income | Gross national income | |
| Secondary distribution of income account | Disposable income | National disposable income | Gross disposable income | |
| Redistribution of income in kind account | Adjusted disposable income | Adjusted disposable income | ||
| Use of income accounts | ||||
| Use of disposable income account | Saving | Use of gross disposable income Saving | ||
| Use of adjusted disposable income account | Saving | National saving | Saving | |
| Accumulation accounts | ||||
| Capital account | Net lending (+) / Net borrowing (-) | Capital account | Net lending (+) / Net borrowing (-) | |
| Financial account | Net lending (+) / Net borrowing (-) | Financial acounts | Net change in financial position | |
| Other changes in the volume of assets account | Changes in net worth due to other changes in volume of assets | Included in balance sheets | ||
| Revaluation account | Changes in net worth due to nominal holding gains and losses | Included in balance sheets | ||
| Balance sheets | Balance sheets | |||
| Opening balance sheet | Net worth | National wealth | Opening balance sheet | Net worth |
| Changes in assets and liabilities | Changes in net worth | Changes in assets and liabilities | Changes in net worth | |
| Non-financial assets | Net capital formation | |||
| Financial assets / liabilities | Financial transactions | |||
| Other changes in volume of assets | Other changes in volume | |||
| Revaluations | Revaluations | |||
| Closing balance sheets | Net worth | National wealth | Closing balance sheets | Net worth |
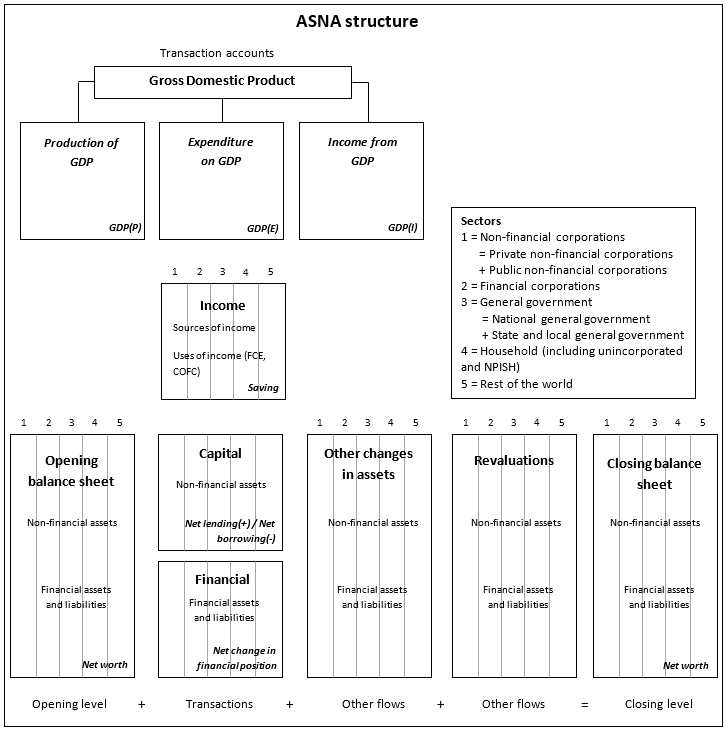
2.61 The following figure illustrates the integrated accounts as presented in the ASNA:
Figure 2.1 Illustration of the ASNA structure
Image