National Aboriginal and Torres Strait Islander Health Measures Survey methodology

Latest release
Reference period
2022-24

Overview

Scope

Includes:

  • Aboriginal and Torres Strait Islander people aged 5 years and over living in private dwellings
  • non-remote and remote areas of Australia, including discrete Indigenous communities. 

Geography

The data available includes estimates for:

  • Australia.


Source

The National Aboriginal and Torres Strait Islander Health Measures Survey conducted by the Australian Bureau of Statistics.

Collection method

Face-to-face interview with an Australian Bureau of Statistics Interviewer

Biomedical sample collection by a trained Sonic Healthcare Australia Pathology specimen collector.

Concepts, sources and methods

Descriptions of the underlying biomedical testing methods are available in IHMHS: Concepts, Sources and Methods

Health conditions are presented using a classification based on the 10th revision of the International Classification of Diseases (ICD-10).

History of changes

See Comparability with previous surveys for history of changes.

About this survey

Overview

The 2022-24 National Aboriginal and Torres Strait Islander Health Measures Survey (NATSIHMS) is a component of the wider Intergenerational Health and Mental Health Study (IHMHS) funded by the Australian government Department of Health and Aged Care.

The 2022-24 NATSIHMS was conducted from August 2022 to April 2024. Biomedical samples were collected from respondents who participated in either the 2022-23 National Aboriginal and Torres Strait Islander Health Survey (NATSIHS) or the 2023 National Aboriginal and Torres Strait Islander Nutrition and Physical Activity Survey (NATSINPAS). Biomedical samples were collected from approximately 2,500 respondents.

The survey focused on the health of Aboriginal and Torres Strait Islander people. The 2022-23 NATSIHS and 2023 NATSINPAS both collected information about respondents’ long-term health conditions and on risk factors which may affect health. Survey data was combined with the results of biomedical testing. Biomedical testing included markers of chronic disease and nutritional status, such as cholesterol, glucose, vitamin B12 and folate. 

A standard set of information about respondents including age, sex, main language, employment, education, and income was also collected.

The survey was possible thanks to the high level of cooperation from our Aboriginal and Torres Strait Islander peoples and their communities. Without their continued support of our ABS surveys, the collection of data and the wide range of information available for Aboriginal and Torres Strait Islander peoples published by the ABS would not be possible.

How the data is collected

Consultation on topics

The survey was developed following extensive consultation to identify priority data requirements and data gaps. In addition to consulting with key stakeholders from government, research and community organisations, workshops were held with Aboriginal and Torres Strait Islander community members to capture their thoughts about issues that are critical to Aboriginal and Torres Strait Islander people, their families and communities. 

  • Advisory and reference groups were established to assist the ABS in determining the content of the survey, biomedical testing and to advise on data output requirements.
  • Expert advisory panels provided advice to the ABS on selected topics. These panels comprised members from both government and non-government agencies.

As a result of consultation, NATSIHMS survey scope was expanded to include voluntary biomedical testing for Aboriginal and Torres Strait Islander people aged 5 years and over. 

Scope and coverage

The scope of the survey was all Aboriginal and Torres Strait Islander people aged 5 years and over living in private dwellings.

The following people were not included in the survey:

  • Aboriginal and Torres Strait Islander people under 5 years of age
  • non-Indigenous persons
  • visitors to private dwellings
  • people in households where all usual residents were less than 18 years of age
  • people who usually lived in non-private dwellings, such as hotels, motels, hostels, hospitals, nursing homes and short-stay caravan parks
  • students at boarding school
  • non-Australian diplomats, diplomatic staff and members of their household
  • members of non-Australian defence forces stationed in Australia and their dependents
  • overseas visitors.

Coverage exclusions apply to those people who were in scope for the survey, but who were not offered the chance to provide biomedical samples. Biomedical samples were only collected when the ABS received community support and approval from an appropriate Human Research Ethics Committee (HREC).

Ethics approval was not granted in northern Western Australia. Aboriginal and Torres Strait Islander people living in the South Headland, West Kimberley, Kununurra and Broome Indigenous Regions (IREG 2021) were not asked to provide biomedical samples in the NATSIHMS.  

The overall coverage of the 2022–24 NATSIHMS was approximately 7.3% of Aboriginal and Torres Strait Islander persons in Australia. The final sample has been weighted to population benchmarks which align with the scope of the survey. For more information, see the How the data is processed section. 

Sample design 

Aboriginal and Torres Strait Islander people aged 5 years and over who completed the 2022-23 NATSIHS or the 2023 NATSINPAS were asked to provide biomedical samples for the 2022-24 NATSIHMS. 

The 2022-23 NATSIHS and 2023 NATSINPAS were designed to produce reliable estimates for the whole of Australia. Each survey sample had two parts:

  • a community sample, made up of discrete Indigenous communities, including any outstations associated with them
  • a non-community sample, made up of private dwellings in areas outside of discrete Indigenous communities. 

Within each Aboriginal and Torres Strait Islander household in both the community and non-community sample:

  • up to two adults (aged 18 years and over) and two children (aged 0-17 years in the 2022-23 NATSIHS, aged 2-17 years in the 2023 NATSINPAS) were randomly selected in non-remote areas
  • up to one adult (aged 18 years and over) and one child aged 0-17 years in the 2022-23 NATSIHS, aged 2-17 years in the 2023 NATSINPAS) were randomly selected in remote areas. 

Households could not be selected in both surveys. Respondents aged 5-11 years were invited to provide a urine sample. Respondents aged 12 years and over were invited to provide blood and urine samples. Participation in the NATSIHMS was voluntary. 

More information on sample design in the 2022-23 NATSIHS, see the National Aboriginal and Torres Strait Islander Health Survey methodology.

Response rates

There were 9,599 Aboriginal and Torres Strait Islander people in scope across the 2022-23 NATSIHS and the 2023 NATSINPAS. Of those people in scope, 2,527 provided biomedical samples, a response rate of 26.3%. 

NATSIHMS response rates
  Numbers of persons (no.)Proportion of persons (%)
5 years and overPersons in NATSIHS and NATSINPAS9,599100.0
 Participated in biomedical component2,52426.3
 Urine sample provided2,25823.5
 Did not participate in biomedical component7,07573.7
12 years and overPersons in NATSIHS and NATSINPAS8,003100.0
 Participated in biomedical component2,16827.1
 Blood sample provided  
 Fasting sample7579.4
   Non fasting sample1,29516.1
 Did not participate in biomedical component5,83672.9

Not all biomedical respondents aged 12 years and over provided fasting blood and urine samples. Some respondents chose to only provide a blood sample or a urine sample. The sample types provided by biomedical respondents for different age groups are provided in the table below. 

Sample types provided by biomedical respondents 
Age GroupParticipated in biomedical component (no.)Provided blood sample (%)Provided fasting blood sample (%)Provided urine sample (%)Provided blood and urine sample (%)
12-1724376.126.383.559.7
18-3454095.733.185.481.1
35-4433897.632.890.888.5
45-5436597.538.488.586.0
55+68297.438.689.186.5
Total 2,16894.634.987.782.4

Data collection procedures

Interviewer training

Information was collected by trained ABS interviewers using a computer-based questionnaire. Prior to enumeration, interviewers:

  • participated in cultural awareness training which described cultural considerations and sensitivities around conducting surveys with the Aboriginal and Torres Strait Islander population
  • completed classroom training and exercises to gain an understanding of the survey content and procedures.

Face-to-face interviews

Interviewers conducted face-to-face interviews in all selected households in the 2022-23 NATSIHS and 2023 NATSINPAS. 

A person aged 18 years or over was asked to provide basic information for all usual residents of the household, including Indigenous status, age, sex and relationships. A usual resident of the household aged 18 years or over, known as the household spokesperson, then answered financial and housing questions, such as income, tenure arrangements, household facilities and food security.

Personal interviews were then conducted with selected Aboriginal and Torres Strait Islander persons aged 15 years and over. Some people were unable to be interviewed because:

  • of injury or illness (a proxy interview may have been arranged)
  • of cultural considerations, such as mourning the death of a family member (sorry business)
  • an interpreter was required and unable to be arranged.

For selected persons aged 15–17 years:

  • a personal interview was conducted if a parent or guardian provided consent, or
  • their interview was completed by proxy (that is, by a parent or guardian). 

A parent or guardian was required to be present for any personal interviews conducted with persons aged 15–17 years.

An adult was asked to respond on behalf of children aged less than 15 years.

At the end of the personal interview, the interviewer explained the biomedical collection and provided an information pack to respondents who agreed to participate. Informed consent was gained from the respondent, or guardian of participants less than 18 years old, prior to sample collection.

Biomedical sample collection

Ethics approval was sought from Human Research Ethics Committees (HREC) prior to conducting the NATSIHMS. 

Ethics approval was gained from the following HREC:

  • Aboriginal Health and Medical Research Council (AH&MRC) HREC in New South Wales (ref. 1970/22)
  • Aboriginal Health Research Ethics Committee (AHREC) in South Australia (ref. 04-22-999)
  • Western Australian Aboriginal Health Ethics Committee (WAAHEC) in Western Australia (ref. HREC1157)
  • Human Research Ethics Committee of NT Health and Menzies School of Health Research (NT HREC) in the Northern Territory (ref. NTHREC 2022-4241)

Approval for biomedical collection in Western Australia was not agreed for Aboriginal and Torres Strait Islander people living in the the South Headland, West Kimberley, Kununurra and Broome Indigenous Regions (IREG 2021).

In non-remote areas, biomedical samples were collected at Sonic Healthcare Australia Pathology collection clinics, their subsidiaries or via a home visit using standard operating procedures for phlebotomy collection. 

In remote areas and discrete Indigenous communities, alternative pathology collection services were arranged. ABS Aboriginal and Torres Strait Islander engagement staff worked with communities to identify suitable locations for visiting pathology collection. Where possible, the ABS worked with established Aboriginal Medical Services. Sonic Healthcare Australia Pathology collection staff traveled to remote locations and collected biomedical samples over a multi-day period. Respondents in remote areas and discrete Indigenous communities had a limited window to provide biomedical samples. 

All blood and urine samples were sent to a central laboratory, Douglass Hanly Moir Pathology (DHM) in Sydney, Australia. Most of the biomedical testing was performed at DHM on machines accredited by the National Association of Testing Authorities (NATA). Iodine testing was performed by Sullivan Nicolaides Pathology in Queensland. All samples were tested on the same machines for the duration of the study. Machines were subject to ongoing internal and external quality control/assurance processes. No quality issues were flagged during the study.  

Respondents could elect to have a pathology report of their results returned via post and/or email. Respondents could also nominate for their results to be sent to their regular doctor. When a test result required medical follow-up, a representative from Sonic Healthcare Australia Pathology contacted the respondent’s nominated doctor. If no doctor was nominated, the respondent was contacted by a qualified health professional and was advised of appropriate action. 

To cover expenses for travel, child-care or time off work, respondents were provided a reimbursement of $75, paid via gift card.

Use of local Aboriginal and Torres Strait advisors

In communities and in some regional areas, interviewers were accompanied, where possible, by local Aboriginal and Torres Strait Islander community advisors who assisted in conducting interviews. The advisors:

  • explained the purpose of the survey
  • introduced the interviewers
  • assisted in identifying usual residents of a household.

Variations in data collection and survey questions

To take account of language and cultural differences, the collection method and survey questions sometimes varied in remote areas.

This means some data items are not available for the total Aboriginal and Torres Strait Islander population. Further information on the availability of data items can be found in the Data Item List, available in the Data downloads section.

Content

Only content included in both the 2022-23 NATSIHS and 2023 NATSINPAS surveys was included in the 2022-24 NATSIHMS. The surveys collected the following content:

  • demographics – age, sex, language, social marital status
  • household details – type, size, household composition, tenure, Socio-Economic Indexes for Areas (SEIFA), geography
  • food security
  • labour force status
  • educational attainment
  • personal and household income
  • self-assessed health status
  • self-reported height and weight
  • long-term health conditions such as diabetes, hypertension, kidney disease, mental and behavioural conditions
  • health risk factors such as smoking, fruit and vegetable consumption, physical activity
  • physical measurements – blood pressure, height, weight, and waist circumference.

Chronic disease and nutrient biomarkers were measured in the provided blood and/or urine samples. The biomarkers are presented in the table below.

Summary of chronic disease and nutrient biomarkers
  AgeSample typeFasting
Cardiovascular disease biomarkersTotal cholesterol12+BloodNo
High-density lipoprotein (HDL) cholesterol12+BloodNo
Low-density lipoprotein (LDL) cholesterol12+BloodYes
Triglycerides12+BloodYes
Diabetes biomarkersFasting plasma glucose12+BloodYes
Glycated haemoglobin (HbA1c)12+BloodNo
Chronic kidney disease biomarkersUrine albumin5+UrineNo
Urine creatinine5+UrineNo
Albumin creatinine ratio (ACR)5+UrineNo
Serum creatinine12+BloodNo
Estimated glomerular filtration rate (eGFR)18+BloodNo
Liver function biomarkersAlanine aminotransferase (ALT)12+BloodNo
Gamma glutamyl transferase (GGT)12+BloodNo
Iron studies and anaemiaSerum ferritin12+BloodNo
Soluble transferrin receptor12+BloodNo
C-reactive protein (CRP)12+BloodNo
Haemoglobin (Hb)12+BloodNo
FolateSerum folate12+BloodNo
Vitamin BSerum vitamin B1212+BloodNo
Vitamin DSerum 25-hydroxyvitamin D [25(OH)D]12+BloodNo
IodineIodine concentration5+UrineNo
SodiumSodium concentration5+UrineNo
PotassiumPotassium concentration5+UrineNo

The 2022-2024 NATSIHMS uses the Standard for Sex, Gender, Variations of Sex Characteristics and Sexual Orientation Variables, 2020. Data in this publication are presented using the Sex at birth variable. When a small number of responses are recorded in any output category, outputs may be suppressed or combined into other categories due to confidentiality and statistical issues. A small number of people in the study reported having a term other than male or female recorded as their sex at birth. Estimates for people whose sex at birth is neither male or female are not able to be output as a separate category but they are included in the estimates for total Persons. 

See the IHMHS: Concepts, Sources and Methods for full details on laboratory testing methods.

For a full list of content collected, see the Data Item List in the Data downloads section.

How the data is processed

Estimation methods

As only a sample of people in Australia provided biomedical samples, results were converted into estimates for the population. This was done through a process called weighting:

  • Each person is given a number (known as a weight) to reflect how many people they represent in the whole population
  • A person’s initial weight is based on their probability of being selected in the sample. For example, if the probability of being selected in the survey was one in 45, then the person would have an initial weight of 45 (that is, they would represent 45 people).

The person weights are then calibrated to align with independent estimates of the in-scope population, referred to as ‘benchmarks’. The benchmarks use additional information about the population to ensure that:

  • people in the sample represent people who are similar to them, and
  • the survey estimates reflect the distribution of the whole population, not the sample.

For this survey, person weights were simultaneously calibrated to the following population benchmarks:

  • age by sex
  • remoteness area by age
  • Torres Strait Islander status by Torres Strait Islander region by adult/child status
  • state/territory by discrete Indigenous community.

A single person level weight was created for the 2022-24 NATSIHMS for persons who provided biomedical samples. The survey was benchmarked to the estimated Aboriginal and Torres Strait Islander resident population aged 5 years and over living in private dwellings at 30 June 2023 which was 883,302 persons. As people in non-private dwellings (for example, hotels) are excluded from the scope of the survey, they were also excluded from the survey benchmarks. The 2022–24 estimates do not, and are not intended to, match estimates for the total resident Aboriginal and Torres Strait Islander population obtained from other sources. 

Sample count and weighted estimates, by age and sex
 Persons in sampleWeighted estimate
Age groups (years)Males (no.)Females (no.)Persons (no.)Males (‘000)Females (‘000)Persons (‘000)
5-1119516135687.573.7161.2
12-1711512824356.162.2118.3
18-34214326540133.8135.4269.2
35-4413720133850.255.2105.4
45-5416619936544.849.794.5
55+31636668262.971.7134.6
Total 114313812524435.4447.9883.3
Sample count and weighted estimates, by remoteness and sex
 Persons in sampleWeighted estimate
AreaMales (no.)Females (no.)Persons (no.)Males (‘000)Females (‘000)Persons (‘000)
Non-remote412454866367.3370.6738.0
Remote731927165868.077.3145.3
Total 114313812524435.4447.9883.3

Undercoverage is a source of non-sampling error. It is the shortfall between the population represented by the achieved sample and the in-scope population. It can introduce bias into the survey estimates; however, the extent of any bias depends on the size of the undercoverage as well as the difference in the characteristics of those people in the coverage population and those of the in-scope population. There are large levels of undercoverage in the 2022-24 NATSIHMS compared to the 2022-23 NATSIHS, 2023 NATSINPAS and other ABS surveys; caution is recommended when using these estimates.  

Undercoverage rates can be estimated by calculating the difference between the sum of the initial weights of the sample and the population count. If a survey has no undercoverage, then the sum of the initial weights of the sample would equal the population count (ignoring small variations due to sampling error).

In the 2022–24 NATSIHMS, the undercoverage rate was approximately 92.7% of the in-scope population at the national level. Undercoverage in non-community areas was 94.9% and for community areas was 72.6%. The undercoverage rate varied across remoteness areas.

Undercoverage rate, by remoteness area
 Major CitiesInner RegionalOuter RegionalRemoteVery RemoteAustralia
Undercoverage rate (%)95.792.494.890.777.392.7

Undercoverage also varied across age and sex. Females (92.0%) had lower undercoverage compared to males (93.4%). Undercoverage was highest in young adults (18-24 years, 96.0%) and improved with increasing age (55 years and over, 87.6%). 

Undercoverage rate, by age and sex
Age groups (years)Males (%)Females (%)Persons (%)
5-1793.794.093.9
18-2496.995.196.0
25-3494.593.994.2
35-4494.392.393.3
45-5491.487.289.2
55+88.287.087.6
Total 93.492.092.7

Non-response adjustments may be used during the weighting process to improve the accuracy of estimates. This is achieved by comparing the characteristics of those who participated in the biomedical collection against those who did not.

Differences were noted in the characteristics of people who participated in the NATSIHMS and people who participated in the 2022 NATSIHS. These differences were greater in non-remote areas compared to remote areas. 

Characteristics of respondents aged 18 years and over in the 2022-24 NATSIHMS and 2023 NATSIHS
 Proportion of persons (%)
 Non-RemoteRemote
 NATSIHMSNATSIHSNATSIHMSNATSIHS
Married51.945.042.143.5
Has a non-school qualification72.561.634.835.1
In the Labour Force67.065.449.451.8
Self-reported diabetes13.110.521.419.5
Self-reported high cholesterol13.29.68.17.5
Excellent or Very Good self-assessed health34.038.038.541.5
Current daily smoker21.227.851.548.9
Overweight/obese76.072.861.662.8
Has hypertension38.432.636.235.1

Besides benchmarking to population estimates, no further adjustments have been made in the 2022-24 NATSIHMS for undercoverage relative to the 2022-23 NATSIHS. Whilst the inclusion of adjustments may have improved the accuracy of biomedical test estimates, they would have also increased the measure of sampling error and would not adequately correct for all bias introduced by high undercoverage. 

In addition to the observed differences in those who participated in the biomedical collection, there are differences in the characteristics of those who fasted prior to their blood test. The difference in characteristics should be considered when interpreting fasting blood test. 

Characteristics of respondents aged 18 years and over who provided blood samples in NATSIHMS, by fasting status
 Proportion of persons (%)
 Fasted for blood sample Did not fast for blood sampleProvided a blood sample 
Married53.048.150.9
Has a non-school qualification70.859.566.3
In the Labour Force68.460.054.6
Self-reported diabetes12.617.314.9
Self-reported high cholesterol14.510.312.6
Excellent or Very Good self-assessed health33.936.134.8
Current daily smoker20.633.526.7
Overweight/obese74.672.973.8
Has hypertension39.537.338.7

Accuracy

Show all

Content changes

The following table summarises content changes applied to the 2022-2024 NATSIHMS compared with the previous 2012-13 Australian Aboriginal and Torres Strait Islander Health Survey (AATSIHS). For full details of data items, refer to the Data Item List.

2022-24 NATSIHMS content changes (changes between 2022-24 NATSIHMS and 2012-13 AATSIHS)
TopicChanges
Overall
  • Instrument design and layout changes introduced to improve usability.
Food security 
  • New question module and associated outputs.
Main language spoken at home
  • Question and sequencing updates to improve comparability across other household surveys. 
Education (educational attainment and current study)
  • Question and sequencing updates to improve comparability across other household surveys. 
Employment
  • Question and sequencing updates to improve comparability across other household surveys. 
Income
  • The short personal income module was utilised. The short personal income module asked respondents to provide one total amount for all their income. 
Fruit and vegetable intake
  • Question and sequencing updates to improve comparability across other household surveys. 
Smoker status
  • Question and sequencing updates to improve comparability across other household surveys. 
Physical activity 
  • New physical activity module was utilised to improve collection of data. This module was introduced in the 2022-23 NATSIHS. 
Self-reported physical measurements
  • New question module and associated outputs. Respondents asked module prior to actual physical measurements being collected. 
Smoking
  • Question and sequencing updates to improve comparability across other household surveys. 
Physical measures
  • Due to COVID-19, the procedures for collecting physical measurements have been adapted to account for increased hygiene and social distancing measures, including a move to collection via self-measurements only (rather than via ABS Interviewers) and use of single use waist measurement tape.
  • New scales allowed for weight measurement up to 200kg.
Disability
  • Specific populations have been added to question module.
  • Question and sequencing updates to improve comparability across other household surveys
Health conditions
  • Conditions coder updated.
  • Minor changes to question wording and sequencing across all condition modules to improve user experience and data quality.
  • A new module on mental health and behavioural conditions was included. This module was introduced in the 2018-19 NATSIHS.

Several data items available in the 2012-13 AATSIHS were not able to be pooled for the 2022-24 NATSIHMS. Data items not available in the 2022-24 NATSIHMS may be available in the 2022-23 NATSIHS or the 2023 NATSINPAS. The following table summarises the items not available in the 2022-24 NATSIHMS.

Summary of content unavailable in the 2022-24 NATSIHMS (concepts removed between 2022-24 NATSIHMS and 2012-13 AATSIHS)
Survey LevelTopics removed
Selected Person
  • Salt use
  • Child sleep behaviour (in non-remote areas)
  • Child screen behaviour (in non-remote areas)
  • Self-perceived body mass, satisfaction with weight
  • Measured hip circumference
Biomedical
  • Continine (a measure of recent nicotine exposure)
  • Red blood cells folate (a measure of folate content in red blood cells, no longer preferred test)
  • Apoliprotein B (used in the assessment of cardiovascular risk)

Comparability with previous surveys

Topics from the 2022-24 NATSIHMS are broadly comparable with the previous 2012-13 AATSIHS aside from the exceptions below. 

The following factors should be considered when making comparisons: 

  • Results from ALT and soluble transferrin receptor testing should not be compared with the previous survey due to changes in test methodology. See the Intergenerational Health and Mental Health: Concepts, Source and Methods for more information on the time series comparability of biomedical tests.
  • Participation in the biomedical testing component of the survey is voluntary. Respondents could choose to provide blood and/or urine samples. Consideration should be given to the characteristics of respondents providing specific samples when performing analysis.
  • Based on Census data, between 2011 and 2021, the Aboriginal and Torres Strait Islander population increased by 46.8% or 313,800 people. When comparing estimates from the 2022-24 NATSIHMS with other surveys, users should be aware of the large increase in the Aboriginal and Torres Strait Islander population and consider the impact this may have when interpreting change over time.
  • Imputation was performed for physical measurement data to account for non-response. Imputation was not performed in the 2012-13 AATSIHS. Proportions should be used for comparisons.
  • 'Heart, stroke and vascular disease' has been redefined to include persons who reported having ischaemic heart diseases and cerebrovascular diseases that were not current and long-term at the time of interview. Data released for the 2012-13 AATSIHS does not include those people who reported those conditions as not current and long-term at the time of interview.
  • Standard classifications used in the NATSIHMS have been updated since the 2012-13 AATSIHS. These include: the Australian and New Zealand Standard Industrial Classification (ANZSIC), the Australian and New Zealand Classification of Occupations and the Australian Standard Classification of Education (ASCED). More information of ABS standard classifications can be found on the website.

How the data is released

Release strategy

This release presents estimates of selected chronic disease and nutrition biomarkers for 2022-24. Commentary presents analysis by age groups, sex, remoteness area and selected population characteristics. 

Data cubes (spreadsheets) in this release present tables of estimates, proportions, means, quartiles and their associated measures of error. A data item list and concordance between the 2022-24 NATSIHMS conditions output classification and that of the 2012-13 AATSIHS and 2022-23 NATSIHS is also available. 

The ABS supports a strengths-based approach when disseminating data about the Aboriginal and Torres Strait Islander population. No comparisons with the non-Indigenous population are included in this release. For advice on making comparisons, see the Non-Indigenous comparisons section.

Detailed microdata is available on Datalab for users who want to undertake interactive (real time) complex analysis of microdata in the secure ABS environment. 

Confidentiality

The Census and Statistics Act 1905 authorises the ABS to collect statistical information and requires that information is not published in a way that could identify a particular person or organisation. The ABS must make sure that information about individual respondents cannot be derived from published data.

To minimise the risk of identifying individuals in aggregate statistics, a technique called perturbation is used to randomly adjust cell values. Perturbation involves small random adjustment of the statistics. This has a negligible impact on the underlying pattern. This is considered the most satisfactory technique for avoiding the release of identifiable data while maximising the range of information that can be released. After perturbation, a given published cell value will be consistent across all tables. However, adding up cell values in Data Cubes to derive a total may give a slightly different result to the published totals.

Assessing health risk factors

Fruit and vegetable consumption

Fruit and vegetable consumption was assessed using the National Health and Medical Research Council’s (NHMRC) 2013 Australian Dietary Guidelines. The guidelines recommend consumption of a minimum number of serves of fruit and vegetables each day, depending on a person's age and sex. Consumption was assessed using a respondent's reported usual daily intake in serves of fruit and vegetables. All drinks, beverages and juices were excluded. 

A serve of fruit is approximately 150 grams of fresh fruit or 30 grams of dried fruit. A serve of vegetables is approximately half a cup of cooked vegetables (including legumes) or one cup of salad vegetables – equivalent to approximately 75 grams. Tomatoes were included as vegetables.

Physical activity (non-remote)

In this survey, physical activity undertaken by people living in non-remote areas has been assessed based on an interpretation of the 2014 Australia's Physical Activity and Sedentary Behaviour Guidelines.

Guidelines for people aged 15–17 years

People aged 15–17 years were considered to have met the guidelines if, in the last week, they did:

  • one or more of the following for at least 60 minutes every day: walking for exercise, recreation or sport for 10 minutes or more, walking to get to places for 10 minutes or more, moderate physical activity, or vigorous physical activity, and
  • at least one minute of vigorous physical activity as part of their total activity in the last week, and
  • strength or toning activities during moderate or vigorous physical activity (excluding activity in the workplace) on at least 3 days. 
Guidelines for people aged 18–64 years

People aged 18–64 years were considered to have met the guidelines if, in the last week, they:

  • did one or more of the following on at least 5 days: walking for exercise, recreation or sport for 10 minutes or more, walking to get to places for 10 minutes or more, moderate physical activity, or vigorous physical activity, and
  • accumulated at least 150 minutes of any combination of the above (for this age group, every minute spent on vigorous physical activity is counted as 2 minutes for the purpose of determining whether the person met this component), and
  • did strength or toning activities during moderate or vigorous physical activity (excluding activity in the workplace) on at least 2 days.
Guidelines for people aged 65 years and over

People aged 65 years and over were considered to have met the guidelines if, in the last week, they did:

  • one or more of the following every day: walking for exercise, recreation or sport for 10 minutes or more, walking to get to places for 10 minutes or more, moderate physical activity, or vigorous physical activity, and
  • any combination of the above for at least 30 minutes on at least 5 days.

Health Conditions

Self-reported health conditions were collected in both the 2022-23 NATSIHS and 2023 NATSINPAS. The 2023 NATSINPAS collected information on cardiovascular conditions, diabetes, kidney disease and mental health conditions. Only the conditions collected in the 2022-23 NATSINPAS were included in the 2022-24 NATSIHMS. 

A long-term health condition is defined as a medical condition (illness, injury or disability) that was current at the time of the interview and has lasted, or is expected to last, for 6 months or more.

Information on specific health conditions was collected in individual modules. Questions varied to take into account differences between non-remote and remote populations and demographic characteristics. Respondents could report multiple health conditions.

Some reported conditions were assumed to be long-term, including diabetes mellitus, rheumatic heart disease, heart attack, angina, heart failure and stroke. Diabetes mellitus, rheumatic heart disease, heart attack, angina, heart failure and stroke were also assumed to be current.

The classification hierarchy is based on the 10th revision of the International Classification of Diseases (ICD). A concordance of the classification to the 2012-13 AATSIHS and 2022-23 NATSIHS classification is available. 

See the Data Item List for full details of the condition classification used in the 2022-24 NATSIHMS. 

Biomedical test ranges

Biomedical tests were ranged according to established cut-offs. The following table defines the criteria applied to each biomedical test. 

Biomedical test outcome criteria
Test Criteria
Cardiovascular disease biomarkersTotal cholesterol

Normal: <5.5 mmol/L 

Abnormal: ≥5.5 mmol/L

HDL cholesterol

Normal:      

  • Male: ≥1.0 mmol/L
  • Female: ≥1.3 mmol/L

Abnormal: 

  • Male: <1.0 mmol/L
  • Female: <1.3 mmol/L
LDL cholesterol

Normal: <3.5 mmol/L

Abnormal: ≥3.5 mmol/L

Trigylcerides

Normal: <2.0 mmol/L

Abnormal: ≥2.0 mmol/L

Diabetes biomarkersFasting plasma glucose

Normal: <6.1 mmol/L

At risk of diabetes: 6.1 to <7.0 mmol/L

Indicates diabetes: ≥7.0 mmol/L

HbA1c

NGSP units

  • Normal: <6.0%
  • At risk of diabetes: 6.0 to 6.4%
  • Indicates diabetes: ≥6.5 %

SI units

  • Normal: <42 mmol/mol Hb
  • At risk of diabetes: 42 to 47 mmol/mol Hb
  • Indicates diabetes:  ≥48 mmol/mol Hb
Chronic kidney disease biomarkersUrine albuminNo criteria applied.
Urine creatinineNo criteria applied. 
ACR

Normoalbuminuria: 

  • Male: <2.5 mg/mmol
  • Female: <3.5 mg/mmol

Microalbuminuria: 

  • Male: 2.5 to 25 mg/mmol
  • Female: 3.5 to 35 mg/mmol

Macroalbuminuria: 

  • Male: >25 mg/mmol
  • Female >35mg/mmol
eGFR

Normal: >60 mL/min/1.73m2

Abnormal: 60 mL/min/1.73m2

Liver function biomarkersALT

Normal: 

  • Male: ≤40 U/L
  • Female: ≤30 U/L

Abnormal: 

  • Male: >40 U/L
  • Female: >30 U/L
GGT

Normal: 

  • Male:
    • 12-14 years: ≤30 U/L
    • 15-17 years: ≤40 U/L
    • 18 years and over: ≤50 U/L
  • Female:
    • 12-14 years: ≤30 U/L
    • 15 years and over: ≤35 U/L

Abnormal: 

  • Male:
    • 12-14 years: >30 U/L
    • 15-17 years: >40 U/L
    • 18 years and over: >50 U/L
  • Female:
    • 12-14 years: >30 U/L
    • 15 years and over: >35 U/L
Iron studies and anaemiaSerum ferritin No criteria applied. 
Soluble transferrin receptorNo criteria applied. 
C-reactive proteinNo criteria applied. 
Haemoglobin

Normal: 

  • Male:
    • 12-14 years: ≥120 g/L
    • 15 years and over: ≥130 g/L
  • Female:
    • Pregnant: ≥110 g/L
    • Not pregnant:  ≥120 g/L                                       

Abnormal: 

  • Male:
    • 12-14 years: <120 g/L
    • 15 years and over: <130 g/L
  • Female:
    • Pregnant: <110 g/L
    • Not pregnant:  <120 g/L                                       
FolateSerum FolateNo criteria applied. 
Vitamin BSerum vitamin B12No criteria applied.
Vitamin DSerum 25-hydroxyvitamin D [25(OH)D]

Adequate levels: ≥50 nmol/L

Mild deficiency: 30 to 49 nmol/L

Moderate/severe deficiency: <30 nmol/L

Urinary IonsIodine concentrationNo criteria applied to individual respondents. Urinary ions results are only applicable at a population level. 
Sodium concentration
Potassium concentration

Chronic disease prevalence

Chronic disease prevalence for dyslipidaemia, diabetes and chronic kidney disease were estimated using a combination of some or all of the following:

  • biomedical test results
  • self-reported long-term health conditions
  • self-reported medication usage (at time of biomedical sample collection).

Dyslipidaemia

Dyslipidaemia refers to several different lipid disorders (that is, conditions where there are too many or too few fats in the blood). A respondent has dyslipidaemia if they had a least one of the following: 

  • abnormal test result for total cholesterol
  • abnormal test result for HDL cholesterol
  • abnormal test result for LDL cholesterol
  • abnormal test result for triglycerides
  • use of lipid-lowering medication. 

Diabetes

Diabetes prevalence was derived using a combination of blood test results, self-reported diabetes and self-reported diabetes medication usage. 

Respondents with diabetes were separated into those with known diabetes and those with newly diagnosed diabetes. Respondents without diabetes were separated into those at risk of developing diabetes and those with normal blood test results. The following table outlines the definition of each diabetes status. 

Diabetes status definitions
Diabetes status Definition 
Has diabetesKnown diabetes
  • self-reported diabetes diagnosis and self-reported taking medications to treat diabetes
  • self-reported diabetes diagnosis and had a blood test result indicating diabetes.
Newly diagnosed diabetes
  • no self-reported diabetes diagnosis and had a blood test result indicating diabetes.
Does not have diabetesAt high risk of diabetes
  • no self-reported diabetes diagnosis and had a blood test result indicating a risk of developing diabetes.
Does not have diabetes
  • blood test results were normal and no self-reported diabetes diagnosis
  • blood test results were normal, self-reported diabetes diagnosis but did not self-report taking medications to treat diabetes.

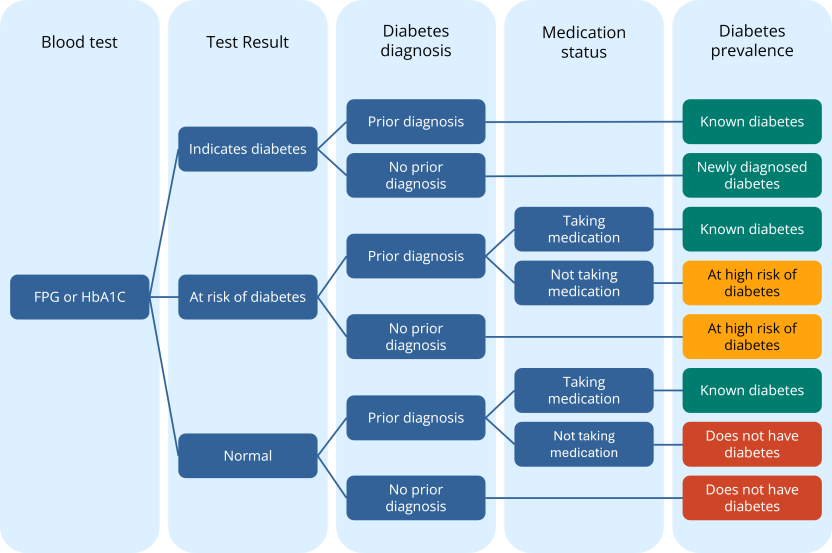
Diabetes can be diagnosed using either fasting blood glucose test results or HbA1c test results. Diabetes prevalence was determined separately for respondents with fasting blood glucose test results and HbA1c test results. Figure 1 illustrates the determination of diabetes status. 

Figure 1: Determination of diabetes status

Determination of diabetes status

Diagram of the algorithm to determine diabetes status. 

A respondent has diabetes if they have either known diabetes or newly diagnosed diabetes. A respondent has known diabetes if they self-reported a diabetes diagnosis and self-reported taking medications to treat diabetes or if they self-reported a diabetes diagnosis and had a blood test result indicating diabetes. A respondent had newly diagnosed diabetes if the did not self-report a diabetes diagnosis and had a blood test result indicating diabetes. 

A respondent does not have diabetes if they are at high risk of diabetes or have no indicators of diabetes. A respondent was at high risk of diabetes if they did not self-report a diabetes diagnosis and had a blood test indicating a high risk of developing diabetes or the self-reported a diabetes diagnosis, did not self-report taking medications for diabetes and had a blood test result indicating a high risk of developing diabetes. A respondent does not have diabetes is they had normal blood test results and did not self-report a diabetes diagnosis or they self-report a diabetes diagnosis, did not self-report taking medications for diabetes and had a blood test result indicating normal levels.  

Chronic Kidney Disease

Chronic kidney disease (CKD) was determined using a combination of ACR and eGFR test results. No self-reported conditions or the usage of medications were considered. Chronic kidney disease is defined in stages according to kidney function. The early stages of CKD are defined by abnormal ACR and normal eGFR test results. The later stages of CKD are defined by abnormal eGFR test results. The following table defines the criteria for CKD.

Chronic kidney disease status criteria
CKD status  ACR test resulteGFR test result
Does not have CKDNormoalbuminuriaNormal
Has CKD 
 Stage 1Microalbuminuria or macroalbuminuriaNormal (≥ 90 mL/min/1.73 m2)
Stage 2Microalbuminuria or macroalbuminuriaNormal (60-89 mL/min/1.73m2)
Stage 3an/aAbnormal (45-59 mL/min/1.73m2)
Stage 3bn/aAbnormal (30-44 mL/min/1.73m2)
Stage 4-5n/aAbnormal (<30 mL/min/1.73m2)

Formal diagnosis of CKD can only be made after persistent abnormal test results over a three-month period. Results in the NHMS represent a single point in time collection.

Physical measurements

Measurements of height, weight and waist circumference were voluntarily provided by respondents, whilst blood pressure measurements were also voluntarily provided by respondents aged 18 years and over. Measurements were not provided by respondents who advised they were pregnant. These measurements provide information on overweight and obesity (using Body Mass Index (BMI)), risk of developing chronic disease, and high blood pressure amongst the Aboriginal and Torres Strait Islander population.

Body Mass Index (BMI)

Body Mass Index (BMI) is a simple index of weight-for-height that is commonly used to classify a person as underweight, normal weight, overweight or obese. It is calculated from height and weight information, using the formula weight (in kilograms) divided by the square of height (in metres):

\[BMI=kg/m^2\]

People aged 18 years and over were classified as underweight, normal weight, overweight or obese based on their BMI score as recommended by the World Health Organization's BMI Classifications.

  • Underweight Class 3 – 15.99 or less
  • Underweight Class 2 – 16.00–16.99
  • Underweight Class 1 – 17.00–18.49
  • Normal weight – 18.50–24.99
  • Overweight – 25.00–29.99
  • Obese Class 1 – 30.00–34.99
  • Obese Class 2 – 35.00–39.99
  • Obese Class 3 – 40.00 or more. 

The BMI categories for children take into account the age and sex of the child. For a detailed list of the cut-offs see Appendix 4 in the National Health Survey: Users’ Guide, 2017–18.

Blood pressure (measured)

People aged 18 years and over were asked to provide a blood pressure reading, voluntarily collected at the time of interview. Readings were categorised as:

  • normal — less than 120/80 mmHg (millimetres of mercury)
  • normal-high — from 120/80 mmHg to less than 140/90 mmHg
  • high — from 140/90 mmHg to less than 160/100 mmHg
  • very high — from 160/100 mmHg to less than 180/110 mmHg
  • severe — from 180/110 mmHg.

People were placed in the highest of the categories that either the systolic or diastolic reading fell into.

A reading of 140/90 mmHg or higher does not necessarily indicate a person has hypertension. In this survey, hypertension is defined as a condition that has lasted, or which the respondent expects to last, for 6 months or more.

The reading also does not take into account whether a person might have had a high blood pressure reading if they were not managing it through the use of medication.

Waist circumference

Waist circumference is a measurement, in centimetres (cm), of a person’s waist. Measurements were voluntarily provided by people aged 2 years and over at the time of interview. Respondents took their own measurements using a tape measure (maximum 150cm). People who advised they were pregnant were not asked to provide measurements.

The waist circumferences of people aged 18 years and over were classified by level of risk of developing chronic disease as recommended by the World Health Organization’s 2008 Waist Circumference and Waist-Hip Ratio: Report of a WHO Consultation.

Waist circumference – level of risk of developing chronic disease, by sex
 Lowered riskIncreased riskSubstantially increased risk
MalesLess than 94cm94cm to less than 102cm102cm or more
FemalesLess than 80cm80cm to less than 88cm88cm or more

Non-response

Physical measurements have a relatively high rate of non-response due to their voluntary and sensitive nature. To correct for the high rate of non-response, values were imputed for those that did not provide measurements to achieve estimates of physical measurements for the whole population.

Imputation was performed separately in the 2022-23 NATSIHS and 2023 NATSINPAS. Non-response rates were lower in the respondents who provided biomedical samples than those who did not. 

Physical measurement non-response rates
  2022-24 NATSIHMS (%)2022-23 NATSIHS (%)
Height and/or weight    Children (5-17 years)35.961.3
   Adults (18 years and over)28.347.5
Waist circumference   Children (5-17 years)36.962.1
   Adults (18 years and over)27.747.0
Blood pressure   Adults (18 years and over)27.445.8

Further information on imputation is available in the National Aboriginal and Torres Strait Islander Health Survey Methodology, 2022-23.

Non-Indigenous comparisons

The ABS supports a strengths-based approach when disseminating data about the Aboriginal and Torres Strait Islander population. No comparisons with the non-Indigenous population are included in this release.

However, the ABS acknowledges some users may want to compare the NATSIHMS data for the Aboriginal and Torres Strait Islander population with data for the non-Indigenous population from other surveys, such as the National Health Measures Survey.

The Aboriginal and Torres Strait Islander population has a younger age structure than the non-Indigenous population. Age is strongly related to many population characteristics, such as long-term health conditions and employment patterns. To account for this, the ABS uses a technique called age standardisation to produce proportions that can be used for comparison purposes. Age standardised estimates of prevalence are those rates that ‘would have occurred’ should both the Aboriginal and Torres Strait Islander and non-Indigenous populations have the same age composition.

The ABS recommends any comparisons between the Aboriginal and Torres Strait Islander population and the non-Indigenous population for characteristics which are associated with age are done using age standardised estimates. Age standardised estimates are not required when making comparisons by age group (for example, 18–24 years).

Age standardised estimates may be produced on request by the ABS as a paid consultancy – see Consultancy request form for more information.

Related Information

National Aboriginal and Torres Strait Islander Health Survey methodology, 2022-23: Additional information on the collection of the 2022-23 National Aboriginal and Torres Strait Islander Health Survey. 

Intergenerational Health and Mental Health Study: Concepts, Sources and Methods: Additional information on biomedical test procedures and interpretation of results.

Back to top of the page