Summation options for continuous variables
How to use summation options and ranges for continuous variables
Summation options
Understanding what is being counted
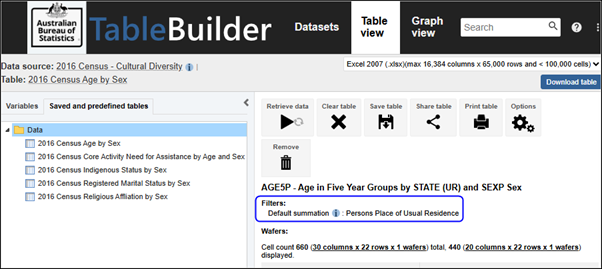
When you open a dataset and build a table, most datasets display the default summation above the table. This tells you what you are counting in your table. For example, your table may be counting persons, families, households, or motor vehicles. Some datasets also allow you to choose a summation option where you can vary what the table is counting. For example, a dataset may include options for counting number of drinks of alcohol consumed or number of kilometres travelled.
The i link next to the default summation provides further information about what is being counted for the default summation.
For tables that do not use the default summation, an annotation displays below the table indicating what is being counted.
Categorical and continuous variables
Some datasets include categorical variables only while other datasets also include continuous variables.
Categorical variables have limited discrete responses, such as State/Territory or Marital status.
Continuous variables can take any numerical value and can be measured. In TableBuilder continuous variables may have options to calculate sum, median, mean or ranges.
In TableBuilder, some variables may be included as both categorical or continuous. For example:
- Age may be categorical, where you can select specific ages to include in your table, and continuous, where you can calculate the median age for a population.
- Income may be provided as a categorical variable in set ranges, such as $0-$499, $500-$999 etc, and may also be provided as a continuous variable, where you can create your own custom ranges, including decimal places.
Please note that both Census TableBuilder Basic and Census TableBuilder Pro do not include continuous variables.
Calculations for median, mean and sum cannot be applied to variables in these datasets within TableBuilder.
Summation options functions
Datasets that include continuous variable functions have a Summation options folder at the top of the variable list panel on the left of the Table view. Summation options control what is being measured in the table. If a summation option is not added to the table or if there is no summations options folder, TableBuilder automatically adds the default summation option for that dataset.
Summation options allow you to calculate the following functions for continuous variables:
- sum - add all responses, such as total number of drinks consumed for a population
- median - the midpoint of the frequency distribution
- mean - average
- ranges - create your own custom intervals
For example, instead of counting the number of males and females who consume alcohol, you can display the total number of standard drinks consumed by males and females. For survey data, this is weighted based on population estimates.
A table that includes a sum, median or mean for a continuous variable only includes those records in the dataset that have a valid value. For example, records with responses for the continuous variable such as 'N/A' or 'Did not respond' are excluded. The records that have valid responses for a variable are determined for each individual cell of the table, including total cells. For further information about valid values, see Interpreting sums, means and medians.
Add a sum, median or mean to a table
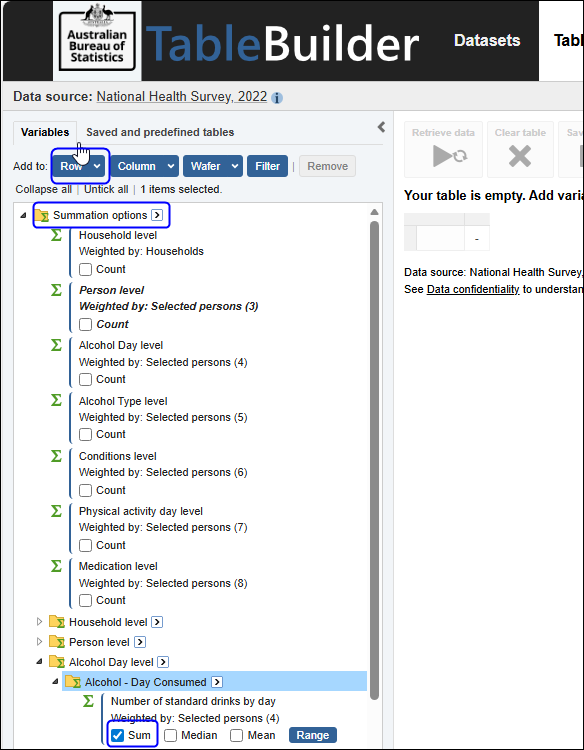
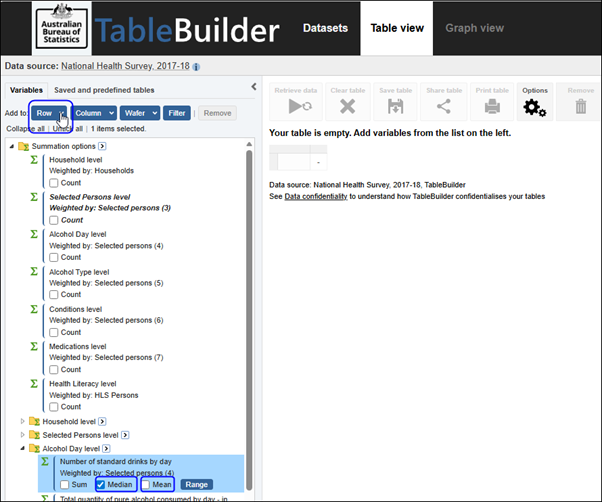
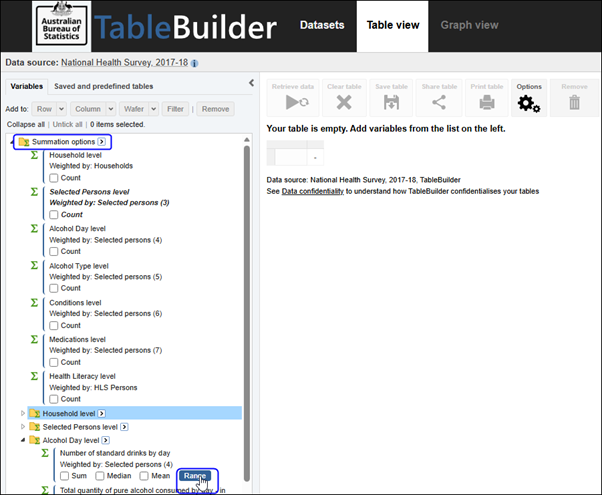
1. Click on Summation options at the top of the left panel in Table view. Summation options are only visible for datasets that include continuous variables.
2. Select one of the sum, median or mean tick boxes and Add to row, column or wafer. In this example, the Sum of Number of standard drinks by day has been added to row.
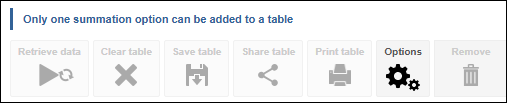
3. Only one sum, median or mean can be added to a table at a time:
- If you try to add a second sum, median or mean to a table that already includes one, TableBuilder automatically removes the existing one and adds the new one.
- If you try to add more than one summation at the same time by ticking more than one of sum, median or mean, TableBuilder displays a error message "Only one summation option can be added to a table"
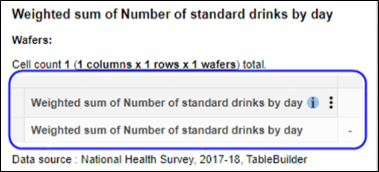
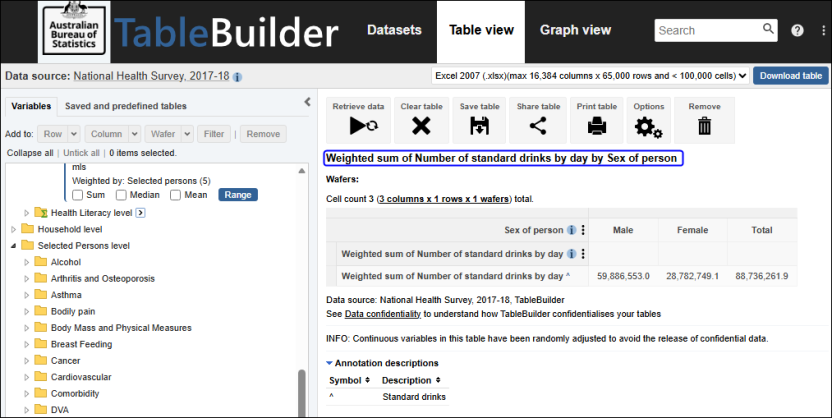
4. The Weighted sum of Number of standard drinks by day has been added to the row.
5. Other variables can be added to the table. The variable Sex is added to column, and the data is retrieved. This table displays the Weighted sum of Number of standard drinks by day, which is 59 million standard drinks for all males in Australia and 28 million for all females.
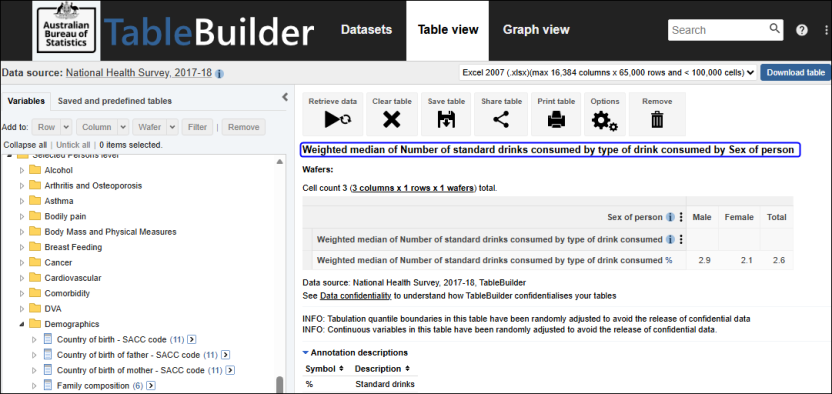
6. To display the median or mean Number of standard drinks consumed instead of the sum, select the new option from the summation options on the left, and Add to row again. This automatically replaces the summation option currently in the table.
7. After retrieving the data, the Weighted median Number of standard drinks by day was 2.9 drinks for Males, 2.1 drinks for Females and 2.6 drinks for all persons.
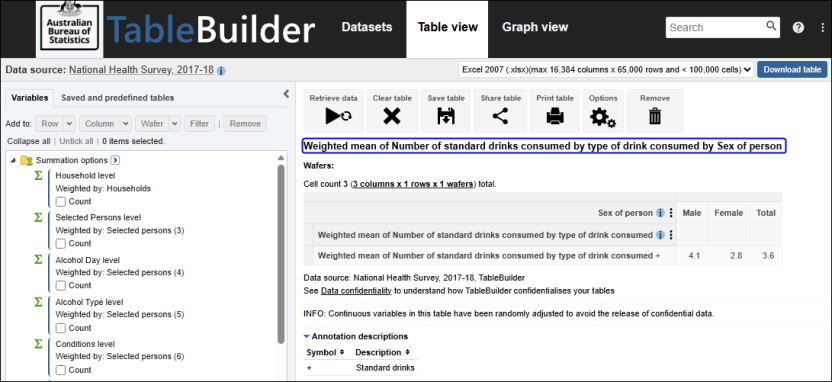
8. Similarly, when the Weighted mean Number of standard drinks by day is added to the row, it automatically replaces the median. The Weighted mean of Number of standard drinks by day was 4.1 drinks for Males, 2.8 drinks for Females and 3.6 drinks for all persons. The mean is calculated based on the population of people who have a valid response, and does not include people who do not drink or children. See Interpreting sums, means and medians for more information about valid responses for continuous variables.
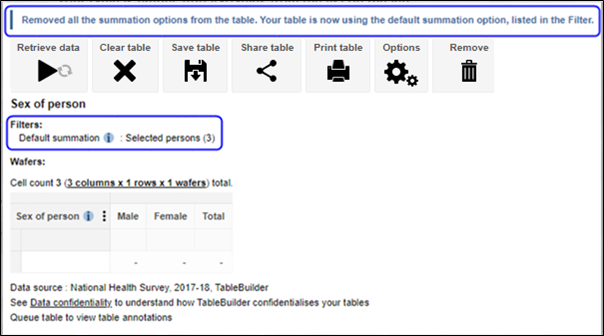
9. If all Summation Options are removed from the table, TableBuilder automatically adds in the Default summation option back into the table. If the weighted mean is removed from the above table, by dragging it into Remove, TableBuilder confirms that 'Removed all the summation options from the table. Your table is now using the default summation option, listed in the Filter'. In this case, the table has reverted to counting Selected persons.
Interpreting sums, means and medians
Estimates of sums, medians, means and ranges for continuous variables must be interpreted carefully. You should read the entry for the continuous variable in the data item list for the dataset, checking the population and the 'special response' categories.
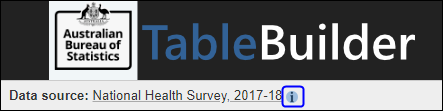
A continuous variable on a dataset has an associated range of 'valid value' responses, and also may have various categories of response that are 'special', for example a special response may be 'Not applicable' or 'Not stated'. These special responses may occur for a variety of reasons, such as the relevant question does not apply to certain records, or the information is unable to be determined. Read the dataset documentation and data item list for detailed information. To open the website dataset information, click the i link at the top left next to the dataset name when in Table view. This opens in a new tab so you can continue working in TableBuilder.
Whenever a sum or mean is included in a table for a continuous variable, the statistic is estimated for the variable's reference population with a valid response.
A continuous variable that does have possible special responses appears in two different sections of the variables list panel:
- as a selectable summation option (continuous variable)
- as a categorical variable under the relevant grouping
The version that appears as a categorical variable contains categories for each of the special response types, and one for 'valid' responses. You can use this variable for population estimates of the various special response types (such as 'No Response'). It is highly recommended when interpreting a table of means or sums of a variable that the corresponding categorical variable be used in separate tabulations of population counts.
When interpreting a table of median estimates, it is also important to understand the population for which the estimate applies, and the valid responses. If there are a small number of records making up a cell's reference population with a valid response, the cell may be suppressed, showing a value of '0' or 'np'. The suppression occurs to prevent the release of disclosive information. The relative standard error (RSE) for each median estimate is estimated using the Woodruff method, which is a replicate weight method. Further information is available in the Relative standard error section.
1. When working with sum, median and mean, check the data item list for the dataset to see the population to which the variable applies.
- Access the data item list via the i link next to the dataset name in the Table view.
- You can also access data item lists via the relevant publication on the Topics page.
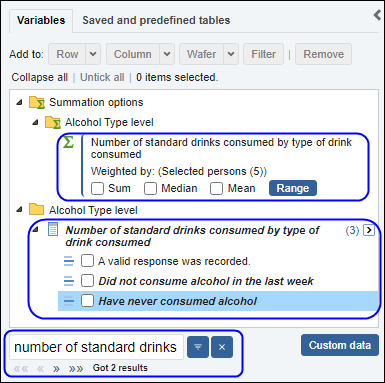
2. Using the earlier example, open the National Health Survey, 2017-18 dataset and search for Number of standard drinks consumed using the search box in the lower left corner. This finds two results in the variables list.
- a continuous variable (summation option)
- a categorical variable that can be used to find the number of records that recorded a valid response, and that were used to calculate the mean.
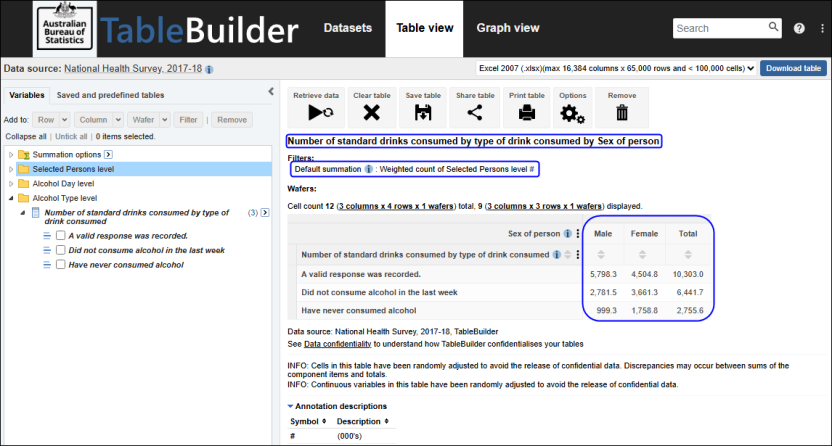
3. If a table is created using Sex and the categorical version of Number of standard drinks consumed, the weighted number of persons whose responses contributed to the sum and mean are displayed. This table is now counting persons in thousands (000's). The categorical variable for Number of standard drinks consumed provides estimates of the size of the population to which the above sum, median and mean are calculated. It also provides the sizes of the populations to which it does not apply, for example, the category 'Have never consumed alcohol', which also includes people under the age of 15 years.
There were weighted counts of 5.7 million males and 4.5 million females whose responses were included in the sum and mean. An incorrect result would have occurred for mean if the persons who did not consume any alcohol were recorded as consuming a valid value of 0 standard drinks.
Ranges
Continuous variables on a dataset usually allow you to create ranges to include in your table. Ranges allow you to create groups of a consistent size that can summarise your data. For example, Age ranges can be created from Age in single years to create 10 year groupings.
Categorical variables can also be grouped using Custom data, where you can create groups of a consistent size, such as 10 year groupings, or groups that suit your analysis, such as 15-17 years, 18-29 years, 30-49 years and 50+.
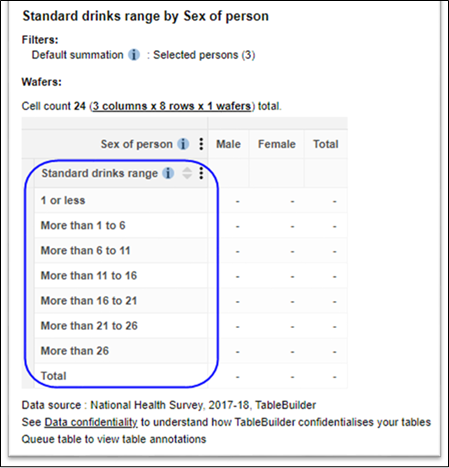
When using a ranges variable in a table, the ranges span all valid values for that variable. The table does not include records which did not provide a valid response for that variable. Even if all the categories within a ranges variable are added to a table, the grand total of the table may therefore be less than the total population due to records without a valid value being excluded. See Interpreting sums, means and medians for more information about valid responses for continuous variables. You should also read the entry for the continuous variable in the data item list for the dataset and check the population, and the 'special response' categories. Information about each variable's population is available in the dataset's data item list on the ABS website. To open the website dataset information, click the i link at the top left next to the dataset name when in Table view. This opens in a new tab so you can continue working in TableBuilder.
Creating ranges
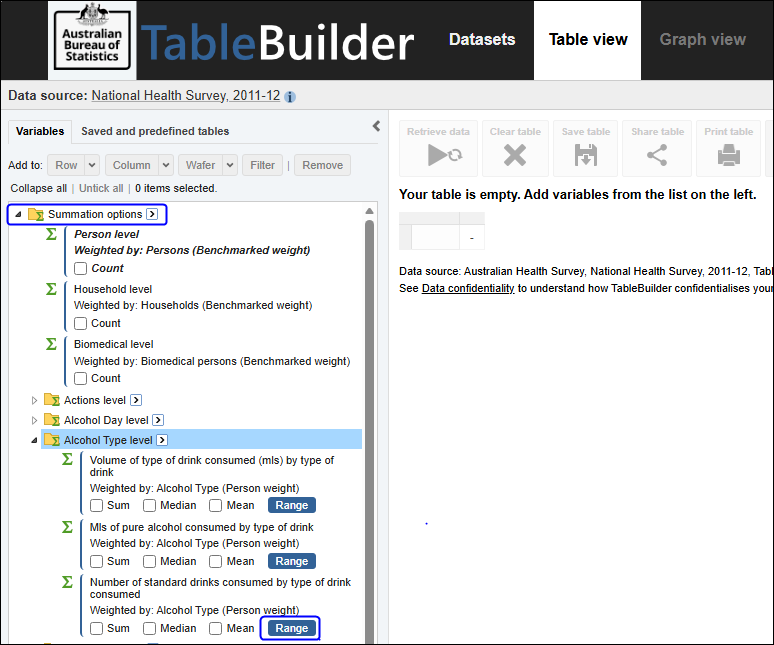
1. In the left panel, open the Summation options folder to select the continuous variable to be put into ranges. Click on the Range button.
2. The Ranges screen appears.
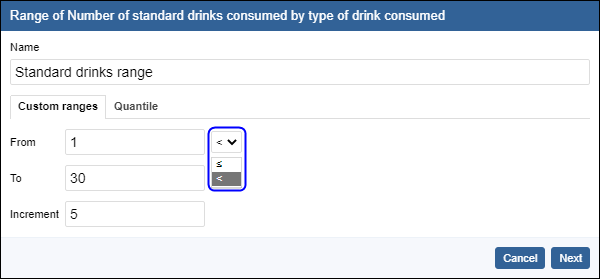
- Enter a name for the range (no longer than 25 characters).
- Enter the minimum and maximum values for your range in To and From.
- When selecting the From and To values, select less than \(<\) or less than or equal to \(\le\) in the drop-down menu to choose whether to include the lower boundary or upper boundary in each range.
- Enter an increment for each range - this is the size of each range category that will be created.
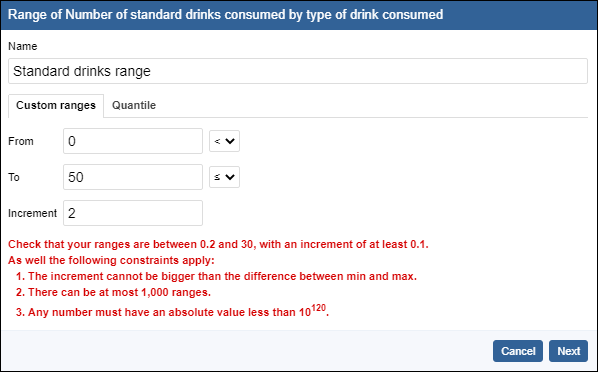
3. If values are selected outside the allowable range values, TableBuilder displays information about the minimums and maximums you can select. You can use this information to help you decide on appropriate range parameters. Click Next.
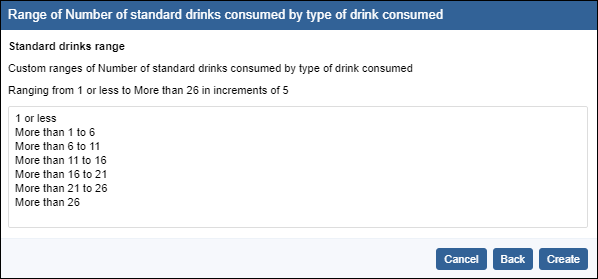
4. The ranges to be included are displayed. Edit by clicking Back or continue by clicking Create.
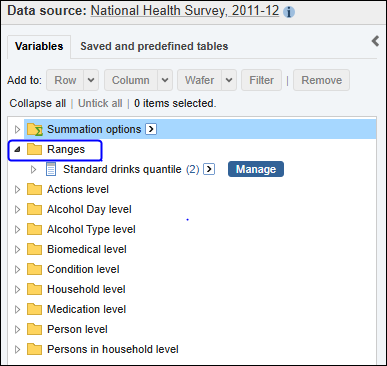
5. This creates your range, and adds it to a new Ranges folder in the variables list panel in the Table View below the Summation options folder. Click on the Ranges folder to view your range. The Ranges variable is now saved and can be used to a table now or for future tables using this dataset.
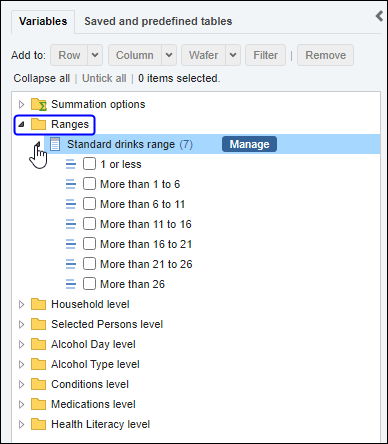
6. Custom ranges can be added to a table like any other variable, by dragging and dropping, or using the Add buttons at the top of the left panel.
Copy and delete ranges
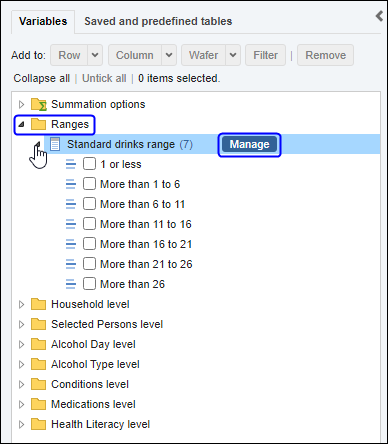
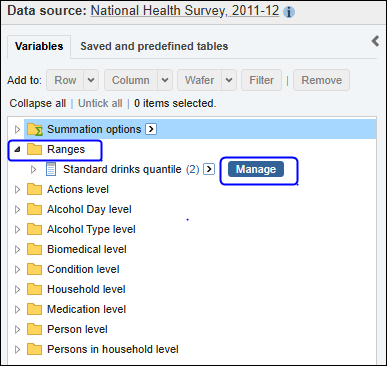
1. To copy or delete a ranges variable, open the Ranges folder below the Summation options folder in the left hand panel. Click the Manage button next to your variable.
2. The Ranges management screen opens.
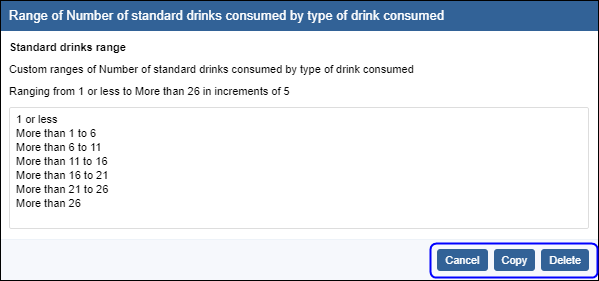
3. To copy a range, click the Copy button. The Ranges screen opens with the parameter values for the existing Ranges variable entered. Change the parameters and rename the range, then clicking the Next button to continue to create the new range.
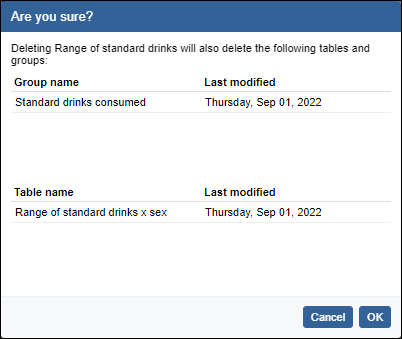
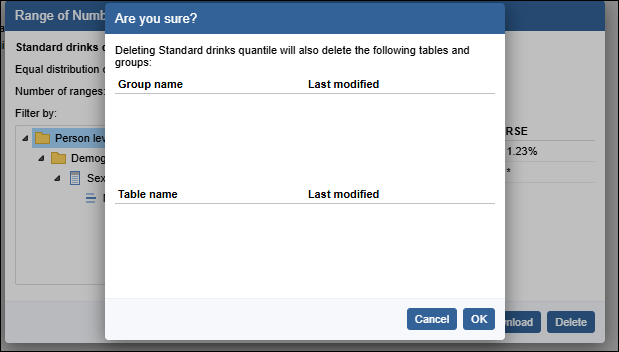
4. To delete a range permanently, click Delete. A confirmation screen opens showing items that you have created using this range:
- any groups you have created (using Custom data)
- any tables you have saved
Clicking OK deletes these groups and tables as well as the ranges variable.
Quantiles
Quantiles can be created for each continuous variable on the dataset. Quantiles are ranges that have an equal number of records in each range, such as Deciles (10 ranges), quintiles (5 ranges), quartiles (4 ranges) and the median (2 ranges). Quantiles can be applied to the whole population or to a sub-population by using a filter. Quantiles can also be saved as a Quantile Ranges variable and can then be used in tabulations.
All variables in Census TableBuilder datasets are categorical. Categorical variables can also be grouped. See the Custom data section for further information.
Generating Quantile boundaries and ranges
In the left panel, open the Summation Options to select the variable to be put into ranges. Click on the Range button.
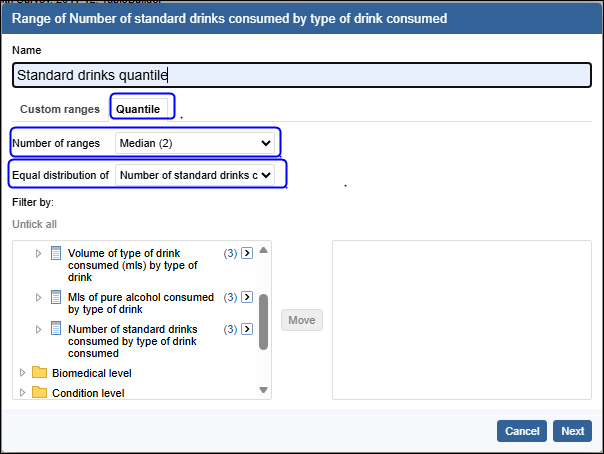
The Range and Quantile dialogue box appears, open at the Custom Ranges tab.
- Select the Quantile tab
- Enter a name for the Quantile (no longer than 25 characters)
- Click the drop-down menu for the Number of Ranges to choose from Median, Quartile, Quintile, and Decile options
- Click the drop-down menu next to Equal distribution of and choose the Distribution variable. For an ordinary quantile, ensure that the appropriate level is chosen as the Distribution variable, and do not choose a continuous variable here
Choose the subpopulation for which quantiles will be generated by using the Filter By section. Navigate the left panel to the categories to be included in the filter. Click the tick boxes next to the variables to be included in the filter, for example Sex of person ‘Male’. Then click the Move button. The window on the right displays the filter, is updated to include the variables and categories moved. Leave the filter empty if the quantile is to be applied to the whole population.
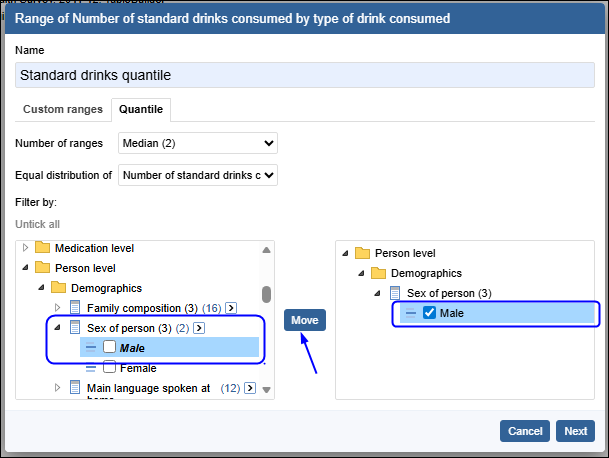
More variables and categories can be selected using the same process. Variables and categories can also be removed from the filter by selecting tick boxes in the window on the right and then clicking the Move button.
Click the Next button. The window updates to show the estimated quantile boundaries along with their RSEs.
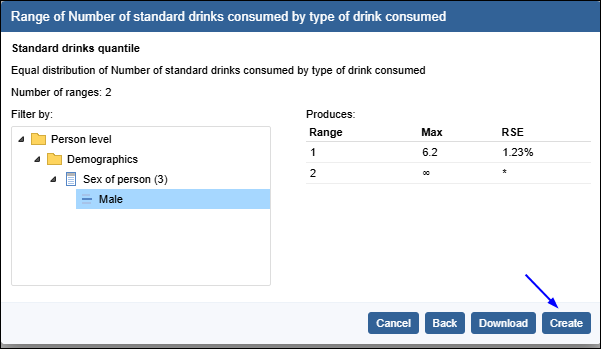
Users may choose to:
- cancel by clicking Cancel
- make further changes to the quantile by clicking Back
- download the displayed table in csv format by clicking the Download button, or
- create a Quantile Ranges variable by clicking the Create button.
By clicking Create, the boundaries are used to create a new Quantile variable with the name you entered. The Quantile variable can be accessed from the Ranges folder in the left panel of the Table View.
Clone, download and delete Quantile ranges
To clone or delete a Quantile ranges variable, find the Quantile range in the left panel in the Ranges folder. Click the Manage button next to the variable.
The Quantile Ranges Management dialogue box opens.
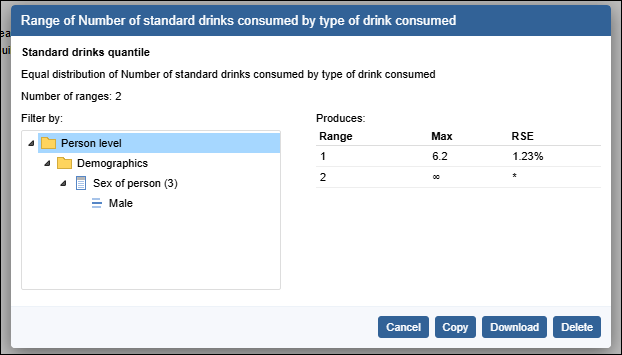
To Copy a quantile range, click the Copy button. The Ranges and Quantiles dialogue box opens with the parameter values of the existing Quantile Ranges variable entered. These parameter can be edited, and the name can be changed before clicking the Next button and continuing the creation process. Quantile Ranges variable names must be unique.
To Download a quantile range in csv format, click the Download button.
To Delete a quantile range, click Delete to permanently delete the Quantile Ranges variable. A confirmation dialogue box opens showing any Groups (created from Custom data) and any tables you have saved that use this Quantile Ranges variable. Clicking OK will delete these groups or tables along with the Quantile Ranges variable. Once deleted, that Quantile Ranges variable no longer appears in the variables list panel.
Interpreting Quantiles
When using a Quantile Ranges variable in a table, the ranges span all valid values for that variable. The table will not include units which did not provide a ‘valid’ response for that variable. Even if all categories within a Quantile Ranges variable are added to a table, the grand total of the table may be reduced due to units without a valid value being excluded. See Interpreting sums, means and medians for more information about valid responses for continuous variables. Users should also read the entry for the continuous variable in the Data Item List for the dataset and examine the Population, and the 'special response' categories. Information about each variable's population is available in the dataset's Data Item List on the Downloads tab via the i link.
In the example, the estimates are quartiles of the variable standard drinks consumed by type of drink consumed weighted by Selected Persons level, for the subpopulation of persons with Sex being Male. The window on the right displays the quantiles, where the Range column shows the number of the quantile, the Max column shows the value of the quantile and the RSE column the estimate’s RSE.
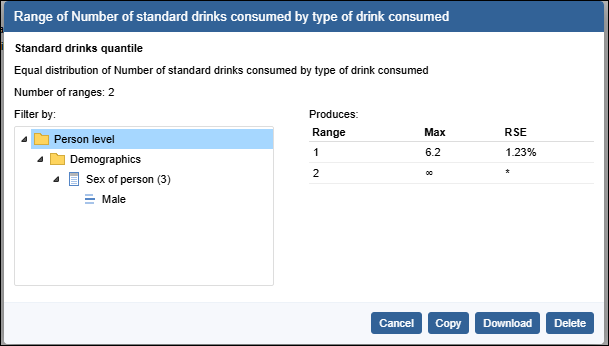
In some situations, it is possible that an estimate of a quantile may be displayed, but the estimate of the RSE is displayed as *. This occurs when the RSE cannot be calculated reliably and the estimate should be treated with caution. When a Quantile Ranges variable is created by clicking the Create button, the first range has no minimum value and the last range has no maximum value. This is why the value of Max for the last entry is displayed as infinity with an RSE of *.
It is possible to use variables from different levels of the data in a filter. For example, it is possible to use a filter of State or Territory being NSW, a Household level variable, when requesting quantiles of a Person level variable such as Age of Person. If this is the case, the population is filtered by restricting to the appropriate collection of units. The population over which quantiles are estimated would be those persons belonging to a household in NSW.
Once the Quantile Range variable has been created and is used in a table, it applies to the entire population, and not to the subpopulation that the quantile refers to.
Equal distribution Quantiles
In addition to ordinary quantiles as described above, Equal Distribution Quantiles can also be generated. By selecting a continuous variable as the Equal Distribution by variable, groups are created that contribute the same proportion of the total of that variable, rather than groups that have the same proportion of the total number of records.
For example, select the variable Average daily intake over week (in mls) is selected as the continuous variable (by clicking on the Range button next to this variable). Choose deciles and set a filter for Sex is Male. For the Equal Distribution of variable:
- If Persons is selected as the Equal Distribution of variable, then the deciles of Average daily intake over week (in mls) is created. These deciles can be interpreted as equally distributing the number of persons into ten groups. Each group has an equal share of the number of persons: 10%.
- If Average daily intake over week (in mls) is chosen as the Equal distribution of variable, then the deciles created do not equally distribute the number of persons into ten groups. Instead, it is Average daily intake over week (in mls) that is equally distributed amongst the ten groups, so that each of the ten groups created represents a 10% share of the total of Average daily intake over week (in mls) within the subpopulation of all Males.
It is important when generating ordinary quantiles, that the Equal distribution of variable is the appropriate weight, and is not a continuous variable.
The Equal distribution of variable cannot contain negative values.