Dwelling stock growth areas

Areas with the largest growth in dwelling stock over 2021-22

Released
31/10/2022

This article presents areas with the largest net growth in dwellings according to estimated dwelling stock for the 2021-22 financial year. Areas refer to Statistical Area Level 2 (see ASGS Edition 3).

Net dwelling stock growth is given by:

\(\text{ net growth}= \text{additions to stock}-\text{removals from stock}\)

where additions to stock are construction of dwellings and removals from stock are dwelling demolitions. For more information, see Estimated dwelling stock methodology.

Australia's dwelling stock grew by 1.4% (146,931 dwellings) during the 2021-22 financial year. Growth in houses accounted for 61.7% of total dwelling stock growth, whilst apartments and townhouses accounted for 23.0% and 15.3% respectively. During the 2021-22 financial year, there was a total of 174,147 additions to Australia's dwelling stock and 27,216 removals. 
Largest growth areas - Australia

During the 2021-22 financial year, Rockbank - Mount Cottrell in Melbourne's outer west had the largest growth (2,056 dwellings) in houses, Edmondson Park in Sydney's south-west had the largest growth (238 dwellings) in townhouses, and Melbourne CBD - North had the largest growth (1,624 dwellings) in apartments. The largest growth areas were predominantly found in Victoria, New South Wales, and Queensland.

Houses
SA2StateHouses at 30 June 2022Net growth 2021-22 (no.)Growth rate 2021-22 (%)
Rockbank - Mount CottrellVictoria7,1012,05640.8
Mickleham - YurokeVictoria8,9001,52020.6
Fraser Rise - PlumptonVictoria4,2561,33245.6
Box Hill - NelsonNew South Wales4,2081,19939.8
Clyde North - SouthVictoria5,5851,06023.4
Marsden Park - Shanes ParkNew South Wales5,5941,05723.3
Werribee - WestVictoria8,5161,03513.8
Tarneit (West) - Mount CottrellVictoria4,11999031.6
Leppington - Catherine FieldNew South Wales4,74480520.4
WollertVictoria7,64880111.7


Townhouses
SA2StateTownhouses at 30 June 2022Net growth 2021-22 (no.)Growth rate 2021-22 (%)
Edmondson ParkNew South Wales51423886.2
KallangurQueensland2,32221210.0
Boronia Heights - Park RidgeQueensland1,25721120.2
Denman ProspectAustralian Capital Territory344211158.6
Chambers Flat - Logan ReserveQueensland386204112.1
RiverstoneNew South Wales317191151.6
WollertVictoria1,03918822.1
Burwood EastVictoria97516119.8
TaylorAustralian Capital Territory275148116.5
Springfield LakesQueensland43614348.8


Apartments
SA2StateApartments at 30 June 2022Net growth 2021-22 (no.)Growth rate 2021-22 (%)
Melbourne CBD - NorthVictoria14,0471,62413.1
Melbourne CBD - WestVictoria13,3281,35111.3
FootscrayVictoria5,82279115.7
Mermaid Beach - BroadbeachQueensland8,8977699.5
Schofields - EastNew South Wales2,89469831.8
Parramatta - NorthNew South Wales6,6295939.8
NorthmeadNew South Wales5,74955610.7
Kellyville - WestNew South Wales1,45954058.8
WoolloongabbaQueensland3,42953418.4
Ermington - RydalmereNew South Wales2,26452930.5


Highest growth rate areas - Australia

During the 2021-22 financial year, the areas with the highest growth rate were in the outer ACT suburbs of Strathnairn (62.9%) and Taylor (62.4%), followed by Reid (57.3%) in inner-city Canberra. 

 
SA2StateStock at 30 June 2022Growth rate 2021-22 (%)Net growth 2021-22 (no.)
StrathnairnAustralian Capital Territory50062.9193
TaylorAustralian Capital Territory1,18162.4454
ReidAustralian Capital Territory1,43057.3521
Fraser Rise - PlumptonVictoria4,52444.91,401
Denman ProspectAustralian Capital Territory1,42744.9442
Rockbank - Mount CottrellVictoria7,28541.52,138
Box Hill - NelsonNew South Wales4,37739.31,234
Tarneit - NorthVictoria3,03533.5762
Tarneit (West) - Mount CottrellVictoria4,16531.81,006
DicksonAustralian Capital Territory2,13231.4510

a. Excludes SA2s with less than 250 dwellings at 30 June 2021

Largest stock removal areas - Australia

In 2021-22, the areas with the largest number of removals from dwelling stock were Seaton-Grange (128 removals) and Plympton (119 removals) in South Australia, followed by Glen Waverley - East (115 removals) in Victoria. The areas with the largest number of removals from dwelling stock are established suburban areas with infill development (i.e. knock-down rebuilds).

 
SA2StateRemovals 2021-22 (no.)Additions 2021-22 (no.)Stock at June 30 2022
Seaton - GrangeSouth Australia128977,977
PlymptonSouth Australia11920612,182
Glen Waverley - EastVictoria115828,041
Point NepeanVictoria11213920,501
Enfield - Blair AtholSouth Australia10726510,722
Balwyn NorthVictoria106917,840
Ermington - RydalmereNew South Wales1046459,890
Ryde - NorthNew South Wales104938,665
Bonnyrigg Heights - BonnyriggNew South Wales100625,243
Glen Waverley - WestVictoria100848,446


States and territories

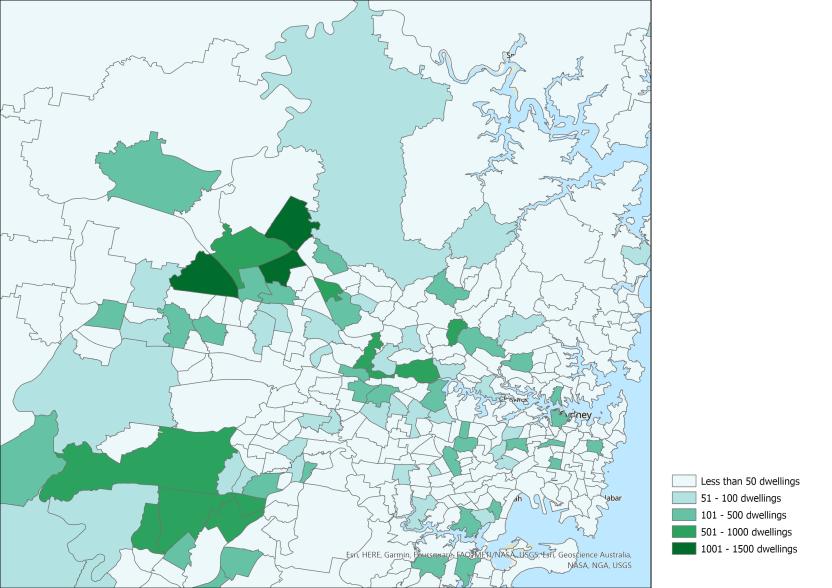
New South Wales

The areas with the largest growth were all in Sydney's outer north-west:

  • Schofields - East (1,405 dwellings)
  • Box Hill - Nelson (1,234 dwellings)
  • Marsden Park - Shanes Park (1,159 dwellings)


The areas with the highest growth rates were:

  • Box Hill - Nelson (39.3%)
  • Marsden Park - Shanes Park (24.9%)
  • Leppington - Catherine Field (21.1%) in Sydney's outer south-west

Figure 1: Net dwelling stock growth, New South Wales SA2s, 2021-22

Dwelling stock growth (number of dwellings), New South Wales SA2s, 2021-22

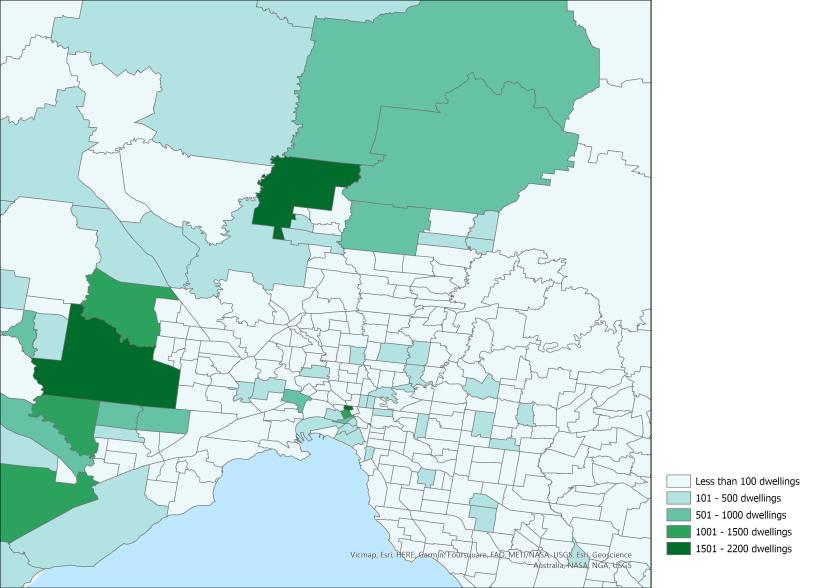
Victoria

The areas with the largest growth were:

  • Rockbank - Mount Cottrell (2,138 dwellings) in Melbourne's outer west
  • Melbourne CBD - North (1,624 dwellings)
  • Mickleham - Yuroke (1,553 dwellings) in Melbourne's outer north

The areas with the highest growth rates were:

  • Fraser Rise - Plumpton (44.9%) in Melbourne's outer north-west
  • Rockbank - Mount Cottrell (41.5%)
  • Tarneit - North (33.5%) in Melbourne's outer west

Figure 2: Net dwelling stock growth, Victoria SA2s, 2021-22

Image of map highlighting areas with the largest dwelling stock growth (number of dwellings), Victoria SA2s, 2021-22

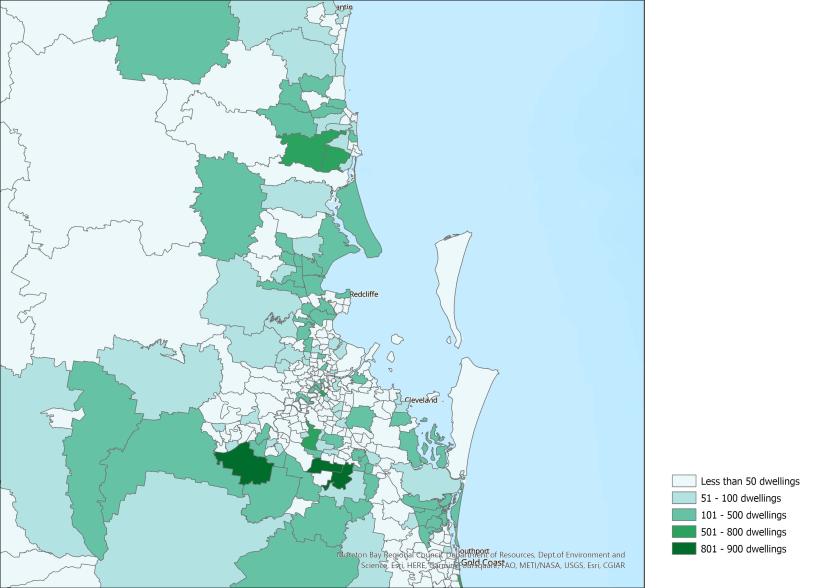
Queensland

The areas with the largest growth were: 

  • Boronia Heights - Park Ridge (872 dwellings) in Brisbane's outer south
  • Chambers Flat - Logan Reserve (830 dwellings) in Brisbane's outer south
  • Ripley (812 dwellings), a suburb of Ipswich

The areas with the highest growth rates were:

  • Chambers Flat - Logan Reserve (27.1%)
  • Pallara - Willawong (19.8%) in Brisbane's south
  • Ripley (17.6%)

Figure 3: Net dwelling stock growth, Queensland SA2s, 2021-22

Image of map highlighting areas with the largest dwelling stock growth (number of dwellings), Queensland SA2s, 2021-22

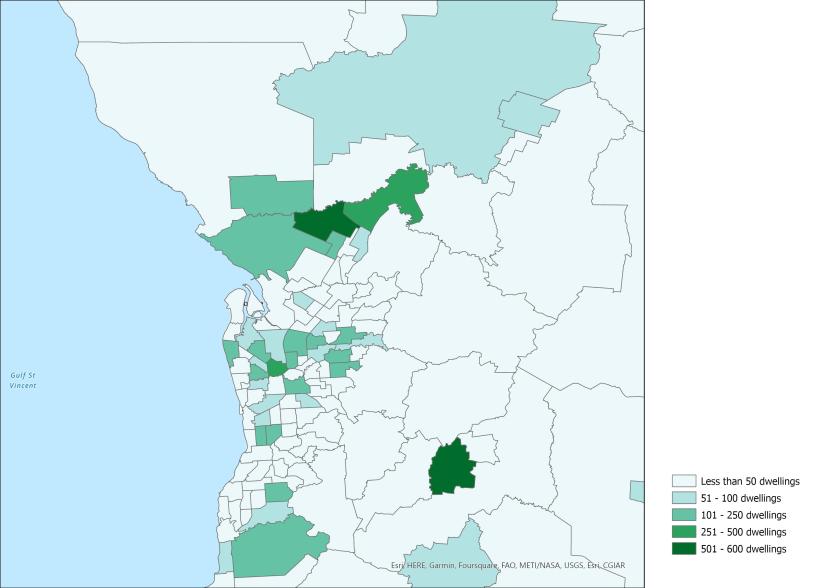
South Australia

The areas with the largest growth were: 

  • Munno Para West - Angle Vale (600 dwellings) in Adelaide's outer north
  • Mount Barker (515 dwellings) in the Adelaide Hills
  • Gawler - South (311 dwellings) in Adelaide's outer north

The areas with the highest growth rates were all in Adelaide's outer north:

  • Munno Para West - Angle Vale (10.2%)
  • Lewiston - Two Wells (7.9%)
  • Virginia - Waterloo Corner (7.9%)

Figure 4: Net dwelling stock growth, South Australia SA2s, 2021-22

Image of map highlighting areas with the largest dwelling stock growth (number of dwellings), South Australia SA2s, 2021-22

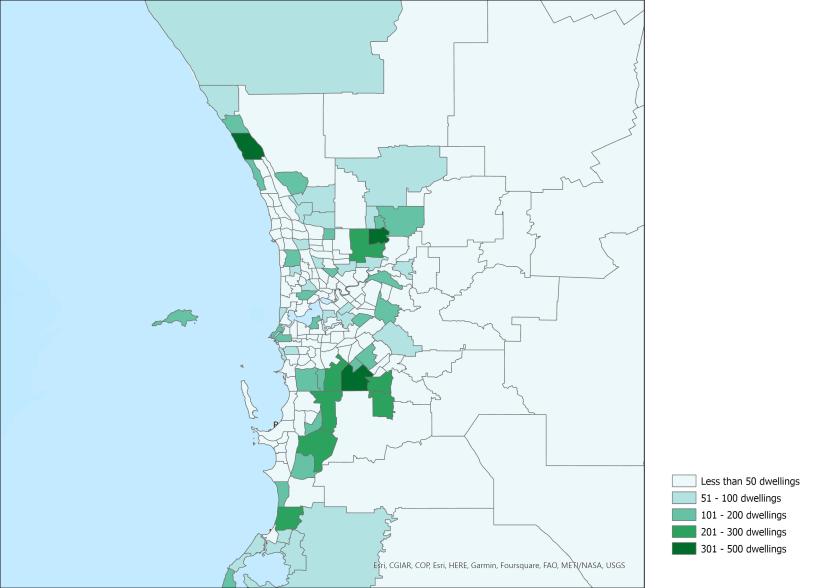
Western Australia

The areas with the largest growth were:

  • Alkimos - Eglinton (477 dwellings) in Perth's outer north-west
  • Brabham - Henley Brook (361 dwellings) in Perth's outer north-east
  • Piara Waters - Forrestdale (312 dwellings) in Perth's south-east

The areas with the highest growth rates were:

  • Brabham - Henley Brook (9.4%)
  • Casuarina - Wandi (9.2%) in Perth's outer south
  • Alkimos - Eglinton (9.1%) 

Figure 5: Net dwelling stock growth, Western Australia SA2s, 2021-22

Image of map highlighting areas with the largest dwelling stock growth (number of dwellings), Western Australia SA2s, 2021-22

Tasmania

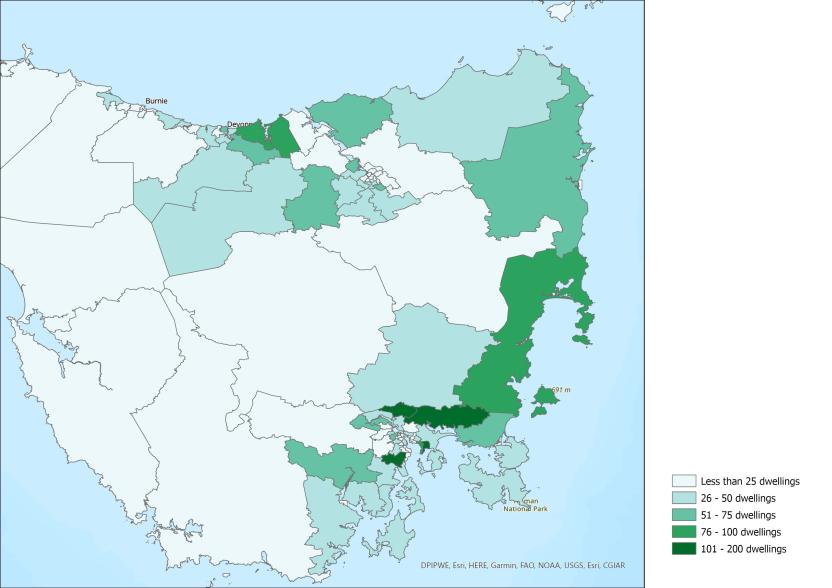
The areas with the largest growth were:

  • Rokeby (200 dwellings) on the eastern shore of the Derwent River
  • Sorell - Richmond (147 dwellings) in Hobart's north-east
  • Kingston - Huntingfield (126 dwellings) in Hobart's outer south

The areas with the highest growth rates were:

  • Rokeby (6.2%)
  • Brighton - Pontville (4.5%) in Hobart's outer north
  • Legana (4.0%), an outer suburb of Launceston

Figure 6: Net dwelling stock growth, Tasmania SA2s, 2021-22

Image of map highlighting areas with the largest dwelling stock growth (number of dwellings), Tasmania SA2s, 2021-22

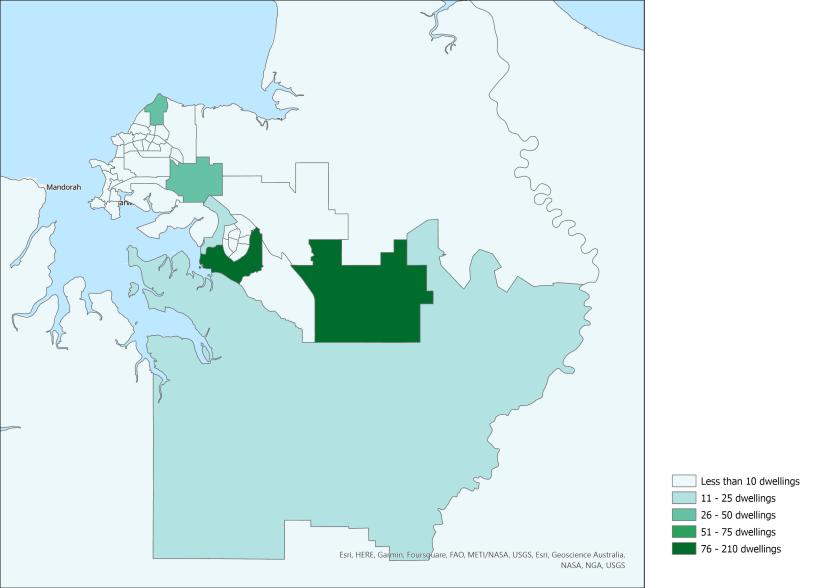
Northern Territory

The areas with the largest growth were:

  • Palmerston - South (208 dwellings) in Darwin's south-east
  • Humpty Doo (85 dwellings) in Darwin's outer south-east
  • Berrimah (45 dwellings) in Darwin's east

The areas with the highest growth rates were the same areas:

  • Berrimah (9.4%)
  • Palmerston - South (9.0%)
  • Humpty Doo (2.6%)

Figure 7: Net dwelling stock growth, Northern Territory SA2s, 2021-22

Image of map highlighting areas with the largest dwelling stock growth (number of dwellings), Northern Territory SA2s, 2021-22

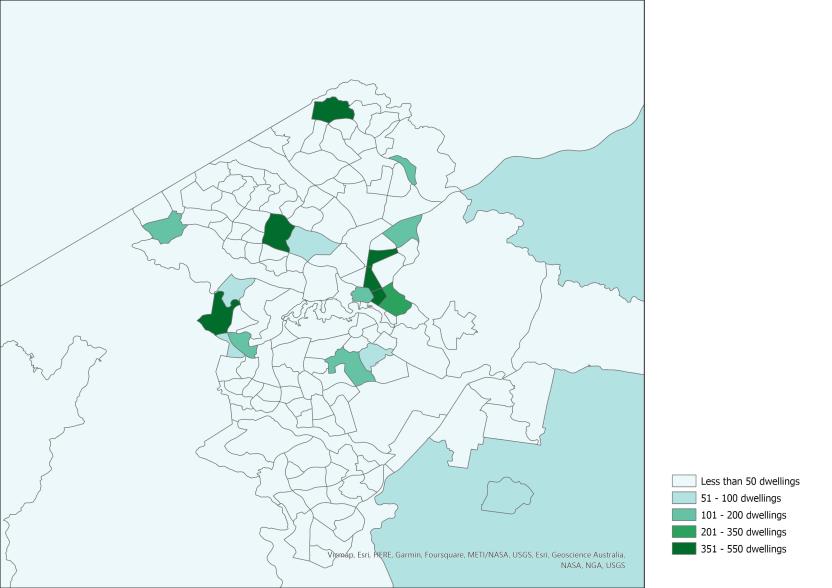
Australian Capital Territory

The areas with the largest growth were:

  • Reid (521 dwellings), an inner-city suburb of Canberra
  • Belconnen (511 dwellings) in Canberra's north-west
  • Dickson (510 dwellings) in Canberra's inner north

The areas with the highest growth rates were:

  • Molonglo Corridor (100%) in Canberra's west
  • Strathnairn (62.9%) in Canberra's outer north-west
  • Taylor (62.4%) in Canberra's outer north

Figure 8: Net dwelling stock growth, Australian Capital Territory SA2s, 2021-22

Image of map highlighting areas with the largest dwelling stock growth (number of dwellings), Australian Capital Territory SA2s, 2021-22
Back to top of the page