ABS Monthly Business Turnover Indicator and quarterly Business Indicators – A comparison

Released
10/12/2021

Introduction

The ABS recently released the Monthly Business Turnover Indicator (MBTI), which uses Australian Taxation Office (ATO) Business Activity Statement (BAS) data to provide timely and more frequent insights into changes in economic activity. 

The MBTI is one measure of changes in sales or business turnover produced by the ABS. Another measure currently produced is ‘Sales of goods and services’ from the quarterly Business Indicators survey (QBIS). The outputs from QBIS include a range of statistics relating to private sector businesses including company profits, the book value of inventories, and wages and salaries. Sales data from QBIS is used as an indicator of output for most industries in the quarterly National Accounts.

This article compares the MBTI with QBIS sales across three dimensions (scope and coverage, conceptual alignment, and timeliness) to provide users with some of the key advantages and differences between the two series.

Table 1: Key characteristics of MBTI and QBIS sales outputs
 MBTIQBIS sales
FrequencyMonthlyQuarterly 
TimelinessReleased approximately six weeks after the end of the reference monthReleased approximately 8 weeks after the end of the reference quarter
Inclusion of public corporationsYesNo – private sector only in scope
CoverageMonthly BAS remittersExcludes micro non-employing businesses
Alignment with concept of output from the Australian System of National AccountsLess aligned as the source data is not created for statistical purposesBetter - The survey allows data collected to be aligned with ASNA concepts
Industry data13 of the 18 ANZSIC industry divisions15 of the 18 ANZSIC industry divisions
State dimensionNoYes
Range of measures availableMBTI index and monthly movement onlyRange of measures including sales, wages, profits and inventories
PublicationMonthly Business Turnover IndicatorBusiness Indicators, Australia

Scope and coverage

The scope of QBIS is private sector businesses, while the MBTI includes both private businesses and public corporations. This difference in scope should be considered when comparing the two series. General government (for example, courts, government departments, future wealth funds and non-profit institutions controlled by government) are excluded from both series. 

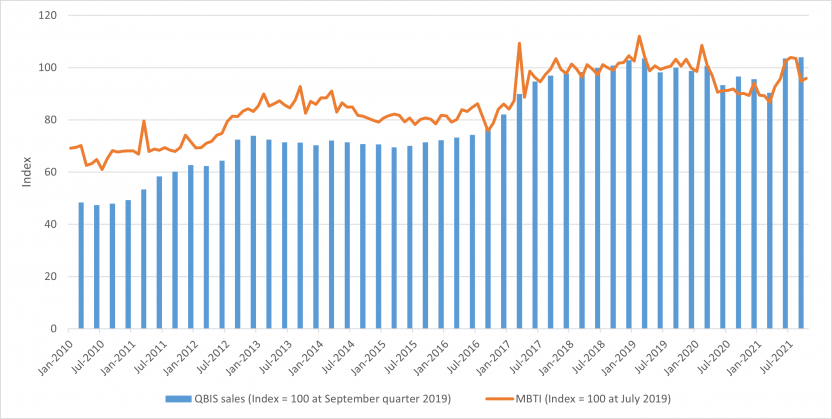
One example where the difference in scope of the two series impacts on industry estimates is in the Electricity, gas, water and waste services industry. The MBTI for this industry has increased by 39% from January 2010 to October 2021 (seasonally adjusted). In contrast, sales estimates from the quarterly survey more than doubled over the same period. As the scope of QBIS is private sector only, privatisation of assets will increase QBIS sales estimates as it adds to the activity in scope of the survey. In addition, public sector corporations and private businesses have different attributes and changes in turnover will differ over time as a result. In the 2020-21 financial year, more than a third of the business turnover in Electricity, gas, water and waste services in scope of the MBTI was contributed by public sector corporations. 

Figure 1: Electricity, gas, water and waste services - QBIS sales and MBTI, seasonally adjusted

Chart comparing the MBTI index numbers with indexed QBIS sales data for the Electricity, gas, water and waste services industry.
This chart compares the MBTI index for the Electricity, gas, water and waste services industry with indexed QBIS sales data for the same industry, from January 2010 onwards. QBIS has shown more growth than the MBTI over this timeframe, particularly in the first half of the time series.

The quarterly Business Indicators survey excludes micro non-employing businesses. It is not expected these businesses would contribute significantly to the estimates, although the impact would vary from industry to industry.

The coverage of the MBTI consists of businesses that remit BAS to the ATO on a monthly frequency. Quarterly and annual BAS remitters are excluded. Monthly BAS reporting covers businesses with GST annual turnover of $20 million or more, and a proportion of smaller businesses that report BAS monthly on a voluntary basis. The proportion of monthly remitters and their shares of business turnover vary considerably by industry, as shown in Figure 2 below.

The industry movements produced in the MBTI from monthly remitters may not always reflect changes in business turnover experienced by all businesses (that is, including quarterly and annually remitters). Some drivers for this include:

  • Any sudden changes in the number monthly remitters (such as a sudden change in remission frequency by many businesses) may distort month-to-month movements
  • Both the population size and turnover of monthly remitters may not grow at the same rate over time as the whole population, influencing long-term trends
  • Monthly remitters may respond to or be affected differently by changes in economic conditions when compared to quarterly or annual remitters.

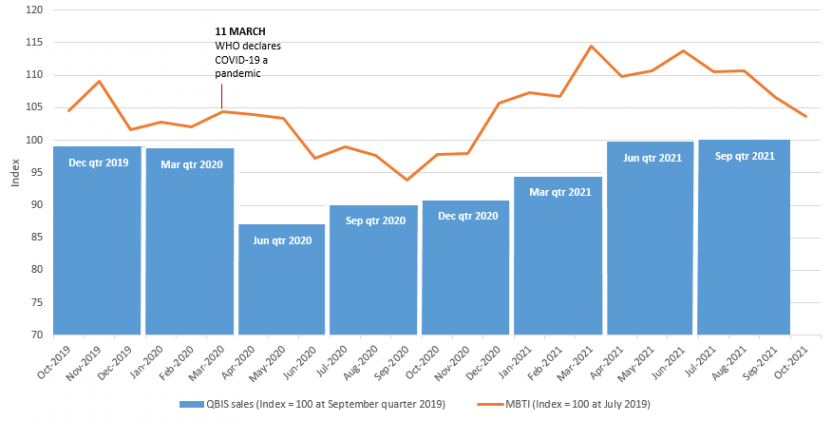
As seen in Figure 3 below, QBIS sales for the Construction industry fell substantially following the commencement of the COVID-19 pandemic, recording a 11.9% fall in the June quarter 2020. In contrast, the MBTI saw a smaller impact, remaining fairly flat through April and May 2020, before a fall in the final month of the quarter.

Figure 3: Construction - QBIS sales and MBTI, seasonally adjusted

Chart comparing the MBTI index numbers with indexed QBIS sales data for the Construction industry.
This chart compares the MBTI index for the Construction industry with indexed QBIS sales data for the same industry, from October 2019 onwards. On 11 March 2020, WHO declared COVID-19 a pandemic. Following this, in the June quarter 2020 QBIS sales showed a substantial fall, while the MBTI showed little change until the final month of the quarter. During the graphed period from October 2019 to October 2021, QBIS sales recorded the lowest estimate in June quarter 2020, while the MBTI's lowest index was recorded in September 2020.

Large businesses undertaking big construction projects often experienced a lag before the COVID-19 restrictions affected reported business turnover in the MBTI, whereas smaller businesses are unlikely to remit BAS on a monthly basis. This may have impacted on the MBTI monthly estimates for the Construction industry during the initial wave of COVID-19 lockdowns and restrictions in 2020.   

Conceptual alignment

BAS turnover and QBIS sales data both measure goods or services sold and supplied by businesses, the sale or lease of land and buildings, as well as the income from providing goods or services for sponsorship. Dividend income is excluded from both QBIS and BAS. Despite the similarities, there are some conceptual differences. For example, QBIS sales exclude interest income and the sale of business assets, whereas these are included in BAS turnover.

To improve alignment with National Accounts concepts of output, some business asset sales are excluded from the BAS data used to produce the MBTI. Most business asset sales cannot be easily identified, nor their size reliably quantified in the BAS data. As part of the transformation of BAS data to create the indicator, data is reviewed for large anomalies that impact its use as a monthly indicator of change in economic activity. Where anomalies such as large business asset sales can be identified that significantly impact the data, these are clerically removed.  

There are differences in the basis of QBIS and BAS reporting. QBIS is typically reported on a Profit and Loss (P&L) statement basis. In contrast BAS is reported on a Goods and Services Tax (GST) liabilities and credits basis. This means that BAS turnover relates to cash flows where the business is acting as an 'agent', with related income and expenses not appearing on the P&L statement. This difference between BAS turnover and QBIS sales can lead to significant differences for industries that include a high proportion of commission-based activity. For this reason, industries with a large proportion of commission-based activity (e.g. Financial and insurance services industry, and Rental, hiring and real estate industry) are excluded from the MBTI.

Timeliness

The release of the Monthly Business Turnover Indicator ahead of the release quarterly estimates from the Business Indicators survey allows a more timely read on economic activity. 

As illustrated below, an economic event occurring in October will be reflected in QBIS in the December quarter, which is published at the end of February. In contrast, data for the month of October will be available from the MBTI in early December, and a further two months (ie. November and December) of MBTI data will be available before the QBIS December quarter data becomes available.

Timeline comparing when data reflecting an economic event in October would be released from MBTI versus QBIS.
This infographic is a timeline showing an economic impact in October being reflected in the MBTI October release, published in December. Two further MBTI monthly releases are then also published before the October economic event is reflected in QBIS December quarter data, released in late February.

Conclusion

The MBTI measures change in business turnover and is aimed at providing a more frequent and timely read on economic activity. While the series is broadly coherent with QBIS sales data, differences in sources, scope, coverage and methods will result in some differences between the two series. Caution needs to be exercised when comparing the two series, or in using the MBTI as a leading indicator for QBIS sales or National Accounts outputs. Users need to consider the purpose and type of analysis to be undertaken when deciding which data source to use.

Back to top of the page