Measures of spread
Definition
Measures of spread describe how similar or varied the set of observed values are for a particular variable (data item). Measures of spread include the range, quartiles and the interquartile range, variance and standard deviation.
When spread can be measured
The spread of the values can be measured for quantitative data, as the variables are numeric and can be arranged into a logical order with a low end value and a high end value.
Reasons to measure spread
Summarising the dataset can help us understand the data, especially when the dataset is large. As discussed in the Measures of central tendency page, the mode, median, and mean summarise the data into a single value that is typical or representative of all the values in the dataset, but this is only part of the 'picture' that summarises a dataset. Measures of spread summarise the data in a way that shows how scattered the values are and how much they differ from the mean value.
| Dataset A | Dataset B |
|---|---|
| 4, 5, 5, 5, 6, 6, 6, 6, 7, 7, 7, 8 | 1, 2, 3, 4, 5, 6, 6, 7, 8, 9, 10, 11 |
The mode (most frequent value), median (middle value*) and mean (arithmetic average) of both datasets is 6.
(*note, the median of an even numbered data set is calculated by taking the mean of the middle two observations).
If we just looked at the measures of central tendency, we may assume that the datasets are the same.
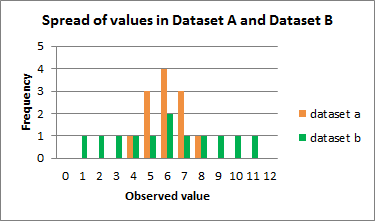
However, if we look at the spread of the values in the following graph, we can see that Dataset B is more dispersed than Dataset A. Used together, the measures of central tendency and measures of spread help us to better understand the data.
Spread of values in Dataset A and Dataset B
Image
Description
Column graph comparing the frequency of observed values from dataset A and dataset B.
- 0 - Dataset A = 0, Dataset B = 0
- 1 - Dataset A = 0, Dataset B = 1
- 2 - Dataset A = 0, Dataset B = 1
- 3 - Dataset A = 0, Dataset B = 1
- 4 - Dataset A = 1, Dataset B = 1
- 5 - Dataset A = 3, Dataset B = 1
- 6 - Dataset A = 4, Dataset B = 2
- 7 - Dataset A = 3, Dataset B = 1
- 8 - Dataset A = 1, Dataset B = 1
- 9 - Dataset A = 0, Dataset B = 1
- 10 - Dataset A = 0, Dataset B = 1
- 11 - Dataset A = 0, Dataset B = 1
- 12 - Dataset A = 0, Dataset B = 0
What each measure of spread can tell us
Range
The range is the difference between the smallest value and the largest value in a dataset.
Calculating the range
| 4, 5, 5, 5, 6, 6, 6, 6, 7, 7, 7, 8 |
The range is 4, the difference between the highest value (8) and the lowest value (4).
| 1, 2, 3, 4, 5, 6, 6, 7, 8, 9, 10, 11 |
The range is 10, the difference between the highest value (11) and the lowest value (1).
| Dataset A | |||||||||||||
|---|---|---|---|---|---|---|---|---|---|---|---|---|---|
| 4 | 5 | 6 | 7 | 8 | |||||||||
| Dataset B | |||||||||||||
| 1 | 2 | 3 | 4 | 5 | 6 | 7 | 8 | 9 | 10 | 11 | |||
On a number line, you can see that the range of values for Dataset B is larger than Dataset A.
Quartiles
Quartiles divide an ordered dataset into four equal parts, and refer to the values of the point between the quarters. A dataset may also be divided into quintiles (five equal parts) or deciles (ten equal parts).
| 25% of values | Quartile 1 (Q1) | 25% of values | Quartile 2 (Q2) | 25% of values | Quartile 3 (Q3) | 25% of values |
The lower quartile (Q1) is the point between the lowest 25% of values and the highest 75% of values. It is also called the 25th percentile.
The second quartile (Q2) is the middle of the data set. It is also called the 50th percentile, or the median.
The upper quartile (Q3) is the point between the lowest 75% and highest 25% of values. It is also called the 75th percentile.
Calculating quartiles
| 4 | 5 | 5 | Q1 | 5 | 6 | 6 | Q2 | 6 | 6 | 7 | Q3 | 7 | 7 | 8 |
As the quartile point falls between two values, the mean (average) of those values is the quartile value:
Q1 = (5+5) / 2 = 5
Q2 = (6+6) / 2 = 6
Q3 = (7+7) / 2 = 7
| 1 | 2 | 3 | Q1 | 4 | 5 | 6 | Q2 | 6 | 7 | 8 | Q3 | 9 | 10 | 11 |
As the quartile point falls between two values, the mean (average) of those values is the quartile value:
Q1 = (3+4) / 2 = 3.5
Q2 = (6+6) / 2 = 6
Q3 = (8+9) / 2 = 8.5
Interquartile range
The interquartile range (IQR) is the difference between the upper (Q3) and lower (Q1) quartiles, and describes the middle 50% of values when ordered from lowest to highest. The IQR is often seen as a better measure of spread than the range as it is not affected by outliers.
| 25% of values | Quartile 1 (Q1) | 25% of values | Quartile 2 (Q2) | 25% of values | Quartile 3 (Q3) | 25% of values |
Calculating the interquartile range
The interquartile range for Dataset A is = 2
Interquartile range = Q3 - Q1
= 7 - 5
= 2
The interquartile range for Dataset B is = 5
Interquartile range = Q3 - Q1
= 8.5 - 3.5
= 5
Variance and standard deviation
The variance and the standard deviation are measures of the spread of the data around the mean. They summarise how close each observed data value is to the mean value.
In datasets with a small spread all values are very close to the mean, resulting in a small variance and standard deviation. Where a dataset is more dispersed, values are spread further away from the mean, leading to a larger variance and standard deviation.
The smaller the variance and standard deviation, the more the mean value is indicative of the whole dataset. Therefore, if all values of a dataset are the same, the standard deviation and variance are zero.
The standard deviation of a normal distribution enables us to calculate confidence intervals. In a normal distribution, about 68% of the values are within one standard deviation either side of the mean and about 95% of the scores are within two standard deviations of the mean.
The population variance \(\sigma^2\) (pronounced sigma squared) of a discrete set of numbers is expressed by the following formula:
\(\sigma^2 = \frac{\displaystyle\sum_{i=1}^{N} (X_i-\mu)^2}{N}\)
where:
\(X_i\) represents the ith unit, starting from the first observation to the last
\(\mu\) represents the population mean
\(N\) represents the number of units in the population
The variance of a sample \(s^2\) (pronounced s squared) is expressed by a slightly different formula:
\(s^2 = \frac{\displaystyle\sum_{i=1}^{n} (x_i-\bar{x})^2}{n-1}\)
where:
\(x_i\) represents the ith unit, starting from the first observation to the last
\(\bar{x}\) represents the sample mean
\(n\) represents the number of units in the sample
The standard deviation is the square root of the variance. The standard deviation for a population is represented by \(\sigma\), and the standard deviation for a sample is represented by \(s\).
Calculating the population variance \(\sigma^2\) and standard deviation \(\sigma\)
Dataset A
Calculate the population mean \((\mu)\) of Dataset A.
(4 + 5 + 5 + 5 + 6 + 6 + 6 + 6 + 7 + 7 + 7 + 8) / 12
mean \((\mu)\) = 6
Calculate the deviation of the individual values from the mean by subtracting the mean from each value in the dataset
\(X_i - \mu\) = -2, -1, -1, -1, 0, 0, 0, 0, 1, 1, 1, 2
Square each individual deviation value
\((X_i - \mu)^2\) = 4, 1, 1, 1, 0, 0, 0, 0, 1,1,1, 4
Calculate the mean of the squared deviation values
\(\frac{\displaystyle\sum_{i=1}^{N} (X_i-\mu)^2}{N}\) =
(4 + 1 +1 +1 + 0 + 0 + 0 + 0 +1 +1 +1 + 4) / 12
Variance \(\sigma^2\)= 1.17
Calculate the square root of the variance
Standard deviation \(\sigma\) = 1.08
Dataset B
Calculate the population mean \((\mu)\) of Dataset B.
(1 + 2 + 3 + 4 + 5 + 6 + 6 + 7 + 8 + 9 + 10 + 11) / 12
mean \((\mu)\) = 6
Calculate the deviation of the individual values from the mean by subtracting the mean from each value in the dataset
\(X_i - \mu\) = -5, -4, -3, -2, -1, 0, 0, 1, 2, 3, 4, 5,
Square each individual deviation value
\((X_i - \mu)^2\) = 25, 16, 9, 4, 1, 0, 0, 1, 4, 9, 16, 25
Calculate the mean of the squared deviation values
\(\frac{\displaystyle\sum_{i=1}^{N} (X_i-\mu)^2}{N}\) =
(25 + 16 + 9 + 4 + 1 + 0 + 0 + 1 + 4 + 9 + 16 + 25) / 12
Variance \(\sigma^2\) = 9.17
Calculate the square root of the variance
Standard deviation \(\sigma\) = 3.03
The larger variance and standard deviation in Dataset B further demonstrates that Dataset B is more dispersed than Dataset A.