Methodological News, September Quarter 2023

Features important work and developments in ABS methodologies

Released
4/10/2023

This issue contains four articles:

  • Improving the ABS’ engagement strategy for household surveys

  • Methods to produce Monthly Employee Earnings Indicator using Single Touch Payroll data

  • A guide on machine learning quality in the ABS

  • Prototype machine learning anomaly detection dashboard

Improving the ABS’ engagement strategy for household surveys

Household statistics produced by the Australian Bureau of Statistics (ABS) play a critical role in informing the nation’s most important decisions. To produce high quality and timely statistics, the ABS must effectively engage with households from across the country that have been selected to participate in a household survey. The purpose of this project was to take a human-centred design approach to improve the ABS’ engagement strategy with households selected for ABS surveys.

The project comprised three phases – Discovery, Prototype, and Test. As part of the Discovery phase, the project team conducted a ‘sludge audit’ (Sunstein, 2021), involving mapping out the current ABS respondent journey for a household survey and identifying key pain points in the process based on feedback from previous survey respondents.

The project team also conducted a literature review of ABS and wider academic research to understand the barriers different demographic groups typically have when interacting with government services. This review also identified several best practice engagement strategies to overcome these barriers. For example, complex language can pose a significant barrier to engagement for groups with lower levels of English literacy, such as Culturally and Linguistically Diverse (CALD) groups or those with disabilities that affect literacy. Therefore, using simple language with a clear call to action would benefit multiple demographic groups.

From the Discovery phase, the following principles for designing an effective engagement strategy emerged:

  • give clear and transparent call to action
  • use simple language
  • clearly define the survey scope and purpose
  • include clear compulsion messaging
  • offer multiple modes of survey completion (for example, online and phone)
  • reduce the amount of postal mail where possible.

In the Prototype phase, these principles were used to develop a new suite of engagement materials. These prototypes were iteratively improved across two rounds of cognitive interviews with members of the public to optimise level of engagement and understanding. Receiving feedback on the design from members of the public was critical to the success of the project.

The new materials were trialled as part of the Test phase, using a randomised controlled trial (RCT) within the Monthly Population Survey (MPS). The RCT was done to ensure that the new strategy did not inadvertently have a negative impact on response rates. The combined findings from the cognitive interviews and the RCT demonstrated that despite the reduction in the number of materials sent to respondents, the new suite of materials was engaging for respondents and had no significant impact on response rates. Achieving the same response rates by sending fewer materials means that we can reduce costs for the ABS and reduce cognitive burden on respondents without compromising data quality.

As a result of the project findings, the updated materials now form the basis for the standard suite of approach letters used for ABS household surveys. So far, we have implemented this new suite into the MPS and the 2023-24 Survey of Income and Housing.

For more information, please contact Yvette Kezilas.

Reference:

Sunstein, C. (2021). Sludge: Bureaucratic Burdens and Why We Should Eliminate Them. MIT Press LTD. USA.
Methods to produce Monthly Employee Earnings Indicator using Single Touch Payroll data

The Australian Bureau of Statistics (ABS) has recently issued the Monthly Employee Earnings Indicator (MEEI) that releases a set of new statistics on employee earnings using Single Touch Payroll (STP) data, as part of the ABS’ Big Data, Timely Insights initiative. A cluster of statistical methods, including STP data transformation, statistical units mapping, weighting and estimation adjustments, were developed as part of the MEEI production process to enable the estimation of wages and salaries for all employing businesses and organisations in the Australian economy.

STP data transformation

The STP data are received in the form of millions of transactions of employer payments to employees. The ABS applies a series of transformations to this data to facilitate its use for statistical purposes.

The initial step is to convert transactions to daily pay events for individual employees through a “calendarisation” method. This method breaks down all records to a common period (daily), which then allows the data to be aggregated to a longer period (e.g., calendar month).

To account for incomplete reporting by an employer during the reference period, imputation is applied when an employer has reported for only a subset of employees or just part of the reference month.

To ensure STP data quality, an auto correct scheme is applied to edit three aspects of data anomalies, including abnormally large values (i.e. outliers), large values when an individual changes jobs and negative values.

Once data transformation is completed, the employee level data for the reference period is aggregated to employer, i.e., ABN level data.  

Statistical unit mapping

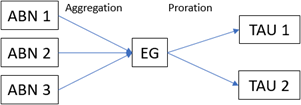
The ABN level data are transformed to statistical unit level, i.e., type-of-activity (TAU) level data through a process called ABN-TAU mapping, to align with the ABS’ economic units model on the Australian Bureau of Statistics Business Register (ABSBR). This ABN-TAU mapping process as represented in the following diagram (the process being the same for more or fewer ABNs or TAUs) essentially involves aggregating ABN level data to the associated enterprise group (EG) level and then prorating the data back down to the TAU level.


Graph

Weighting and estimation adjustments

The scope of the MEEI is active employing businesses and organisations in the Australian economy. When employing businesses do not report to STP during the reference period (i.e., full non-response), a non-response adjustment (weighting) is applied to the data received from responding businesses to fully account for the employee earnings of the target population (all employing businesses).

Due to inherent limitations of the STP data, a couple of adjustments are applied to improve the quality of MEEI estimates. To remove the effect of the fringe benefits tax (FBT) lumpy reporting arrangements, the ABS creates an adjustment factor to accrue the FBT amounts across all months over the relevant financial year. In addition, to improve the comparability of estimates between calendar months, a calendar adjustment has been applied to account for the differing number of days in each month.

For more detailed information on the methods, please refer to the Monthly Employee Earnings Indicator Methodology.

For more information, please contact Summer Wang.

A guide on machine learning quality in the ABS

The ABS has been exploring machine learning methods for the past decade as part of our research to improve our statistical methodologies and processes, as well as to expand our offering of statistical products. We have developed expertise in a variety of machine learning methods, including supervised learning and unsupervised learning approaches in topic areas like regression, classification, cluster analysis, novelty detection, and dimension reduction. Given the ABS’s increasing research activity in this space, we have developed a machine learning quality guide to assist with:

  • ensuring the quality of ABS machine learning outputs,
  • promoting more consistency in our use of machine learning across the ABS,
  • building machine learning capability in the ABS, and
  • generating appropriate inputs to privacy and ethics assessments.

The machine learning quality guide draws on ideas from similar research that has been done by various National Statistics Offices and other organisations that produce official statistics. Where necessary, it adapts and builds on those ideas to better suit the ABS context. It also uses many ideas from the statistical and machine learning literature, and delves into some of the technical detail presented therein. The guide gives practical advice on five key dimensions of machine learning quality: accuracy, interpretability and explainability, representativeness of data, reproducibility, and timeliness. It primarily focuses on supervised learning, but also considers ideas and recommendations that are applicable to a broader range of machine learning models.

The machine learning quality guide is currently in the early stages of peer review and distribution within the ABS. We will be seeking feedback from internal stakeholders while promoting the dimensions of machine learning quality. This process will also identify any key gaps in the guide that need to be addressed in future editions, which may include further dimensions of machine learning quality, more discussion about unsupervised learning, and additional topic areas.

For more information, please contact Edwin Lu or Nelson Chua.

Prototype machine learning anomaly detection dashboard

The ABS is assessing the use of machine learning to identify anomalous data for data sources with different types of characteristics, such as large, frequent or evolving data. Initial work focussed on business administrative datasets.

A prototype RShiny dashboard has been built to enable a validation team to utilise machine learning for identifying anomalies. The dashboard provides a shortlist of the most influential anomalies to the human decision-maker, along with contextual information such as time-series plots, with the aim of streamlining and focussing human effort.

The methods, Isolation Forest and Local Outlier Factor, were chosen because they identify different types of anomalies, are quick to train and easy to explain. The models and dashboard were designed to suit the nature of the dataset, how the validation team operates, and for ease of maintenance. Variables and hyperparameters were selected for performance and robustness. It was found that a relatively small number of appropriately defined variables captured much of the important parameter space. This helps with anomaly detection performance, speed and explainability. The preprocessing and dashboard were designed to manage the size of the data.

A validation team could use the dashboard to:

  • view time-series for aggregated data
  • drill down to specific industries, states, or time frames
  • view tabular and graphical information about anomalous units
  • compare with previously reported data
  • aggregate data to a higher-level unit
  • provide commentary and save/view reports on key findings to share with their team.

The dashboard app is hosted in a cloud environment alongside the data. The solution hosting the dashboard app is also a prototype, and was developed as part of the R PRoduction Environment Project (RPREP), which was a collaboration between methodologists, IT staff and cloud provider partners. The dashboard code was developed using RStudio and incorporates both R and Python code and packages.

Future work includes exploring broader applications for this approach, and investigating the use of machine learning to automate anomaly treatment, including for less-influential units where explainability and human oversight will continue to be important.

For more information please contact Jenny Pocknee.

Contact us

Please email methodology@abs.gov.au to:

  • contact authors for further information
  • provide comments or feedback
  • be added to or removed from our electronic mailing list

Alternatively, you can post to:

Methodological News Editor
Methodology Division
Australian Bureau of Statistics
Locked Bag No. 10
Belconnen ACT 2617

The ABS Privacy Policy outlines how the ABS will handle any personal information that you provide to us.

Previous releases

Releases from June 2021 onwards can be accessed under research.

Releases up to March 2021 can be accessed under past releases.

Back to top of the page