Assessing administrative data quality to enhance the 2021 Census

Comparing counts from administrative data with official ABS population counts

Released
23/10/2020

Introduction

The ABS has identified three uses for administrative data to enhance the 2021 Census. They are to:

  1. maximise Census response by identifying areas where people may need extra support to complete the Census;
  2. improve the Census count by refining our methods to estimate the number of households unoccupied on Census night; and
  3. prepare for any unexpected events that could impact the Census response (e.g. natural disasters).

These three uses of administrative data to enhance the 2021 Census have been assessed and supported from a Privacy perspective (refer ABS Privacy Impact Assessments). In this article we assess administrative data from a quality perspective.

For administrative data to be of most use in the 2021 Census, we need to know how accurately it represents Australia’s population. One important way of making this assessment is by comparing population counts created from the administrative data with the ABS’s official population counts at the time of the 2016 Census.

Overall, our research shows administrative data represents the Australian population very well. Looking back at the Census in 2016, the difference between a measure of Australia’s population from administrative data and the official ABS population estimate for Australia is only about 8,000 people, or 0.03% of the population.  The national age profile is very similar, and differences for the states and territories are also very small.

However, bigger differences start to become apparent as we ‘zoom in’ on smaller geographic regions and population groups across the country. For example, younger Australians in their twenties appear to be under-represented by the administrative data, particularly some specific groups like international students in Melbourne.

The remainder of this article is organised as follows. Section 2 describes our approach to combine administrative datasets to represent Australia’s population. Section 3 provides the results and answers the question ‘How accurately do counts from the combined administrative data compare with official ABS counts?’ at the national level, for states and territories, and for smaller geographic regions. Section 4 outlines further research.

Combining administrative data to represent Australia's population

There is no single administrative dataset that covers Australia’s entire population. Instead, the best coverage is achieved by bringing together a number of different administrative datasets.

The three largest and most important of these are the Medicare Consumer Directory, Social Security (Centrelink) registrations and the Australian Taxation Office client register.

Many Australians are present in more than one of these administrative datasets, so to avoid double counting they are combined using data linkage techniques. Refer to How is MADIP data linked for further information about the different sources, how they are brought together, and how it is done in such a way that maintains the confidentiality of any personal information.

Once these data are combined, they need to be narrowed down to represent the Australian population at a point in time.  To support the upcoming Census, for example, we need them to represent the Australian population in August 2021.

We call this process ‘scoping’ the administrative data to represent the population.  In particular, we try to remove records that represent people who:

  • died or left the country before the date of interest
  • were born or arrived in the country after the date of interest

Births, Deaths and overseas migration data are key sources for ‘scoping’, and we can also use information on the administrative datasets such as how recently a record was added or updated.

Results

To examine how well our administrative data represents the population, we’ve compared it to the official ABS population count, referred to as Estimated Resident Population (ERP).

In contrast to population counts from administrative data, ERP is based primarily on the Census count with an adjustment factor for people who were missed in the Census. 

For more detailed information on how ERP is calculated refer to National, state and territory population methodology.

So far our research has focused on how well administrative data would have compared to ERP around the time of the last Census, in 2016.  This gives us some indication of how well it is likely to perform at the time of the 2021 Census.

The analysis in this paper examines differences between the two counts at a national level, for states and territories, and for smaller geographic regions.

National results

The national head count from administrative data is virtually the same as ERP for June 2016 (24,198,959 people from administrative data compared with 24,190,907 people in ERP).  The difference between the two is only 8,052 people, a very small fraction (0.03%) of the population.

Figure 1 compares the age profile of the two populations.  It shows that administrative data counts track very closely to ERP for most age groups.

Figure 2 shows the percentage difference between the two age profiles with a further breakdown by sex, to help us zoom in on the differences more closely.

This graph shows that the main discrepancies are for people in their 20s, who appear to be under-represented in the administrative data, and people over 60, who appear to be over-represented in the administrative data.

The coloured band shows the range of possible error that is present in ERP.  This uncertainty is introduced when we apply the sample-based adjustment factor for undercounting in the Census.  Where the percentage difference stays within the band, it is not clear whether the administrative count or ERP is closer to the true population.  Notably, the differences are within the margin of error for the majority of age groups.

State and territory results

Figure 3 shows the percentage difference between administrative population counts and ERP for the states and territories. The differences are all within 2%.  Victoria has an administrative count around 1.5% or 90,000 persons lower than ERP, and Tasmania’s administrative count difference is 8,000 persons or 1.6% higher than ERP.  These are the only states or territories with differences outside the margin of error.

Bigger differences start to appear when we look specifically at the capital cities and for the remainder of each state.

It shows that the larger difference for Victoria is driven by undercounting in Melbourne, where the administrative data is 2.5% or 115,000 persons lower than ERP.  Differences for the remainder of Victoria are within the margin of error.

Figures 4 and 5 help us further understand what could be driving this undercounting in Melbourne.  First, the age profile shows that people in their 20s are particularly under-represented in the administrative data.

Secondly, figure 5 shows this undercounting is particularly pronounced in the inner city areas around the Melbourne CBD and Carlton, and Clayton south-east of the CBD.  These areas have administrative counts around 75% lower than ERP for people aged 15-24 years.

The young age profile and the proximity of low-count areas to Melbourne universities points to an absence of international students in the administrative data being a likely cause.

Figure 5: Percentage difference between administrative counts and ERP for Greater Melbourne, June 2016

Map of Greater Melbourne showing percentage difference between administrative counts and ERP for each SA2.
Map of Greater Melbourne showing percentage difference between administrative counts and ERP for each SA2. The majority are within a 5% difference, with SA2s near Melbourne CBD, Kingsbury (north east of the CBD) and Clayton (south east of the CBD) highlighted as they have administrative counts more than 25% lower than ERP. Map data available in the Data Downloads section.

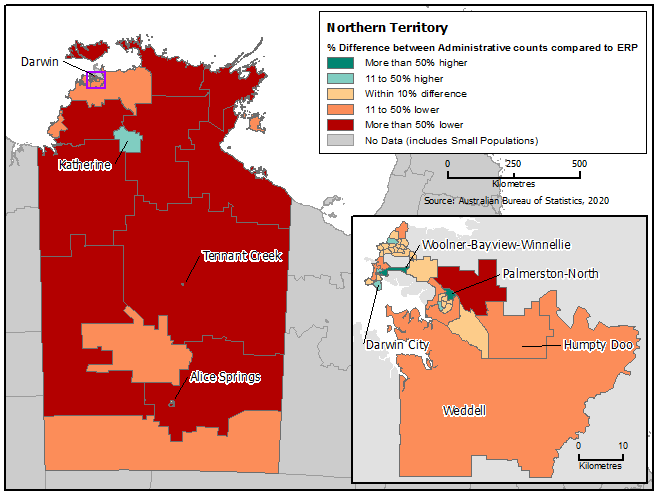
The other capital city that stands out with significant differences is Darwin in the Northern Territory.  Although the counts are similar for the Territory overall, the difference for Darwin is quite large at 4.4% greater than ERP.  This is offset by an even greater difference for the rest of the Northern Territory, where the count is more than 10% lower than ERP.

Analysing differences for the regions surrounding Darwin shows this is brought about by the administrative data placing people, particularly from remote communities, at their PO box location in Darwin, rather than at the place where they live.

This same issue is also occurring near Katherine and Alice Springs, the other major population centres in the Northern Territory.

Regional results

Given Census’ critical role to provide small area counts, it is important to understand how well the administrative data aligns with ERP at a fine geographic level.  Furthermore, if an event such as a natural disaster impacts Census response, administrative data may need to be used to provide basic Census counts for the affected area. 

Statistical Areas Level 2 (SA2s) are the smallest area at which ERP is released, and typically have a population range between 3,000 and 25,000 persons, with an average population of about 10,000 persons.  There are approximately 2,300 SA2s which cover all of Australia, designed to reflect communities that interact together socially and economically.

Figure 6 shows the percentage difference between administrative counts and ERP across SA2 regions.  There is good alignment for the majority of regions, especially given that we expect there to be greater errors in the counts from both sources at this level.

Note: excludes 105 regions with ERP counts of less than 1000 persons

Nine in every ten of the regions have differences within 10%, representing 94% of the overall population.  Of these regions, more than 85% have differences within 5%.  The remaining regions with more pronounced under or over counts are scattered throughout Australia, but with pockets in certain regions. 

Table 1 shows a capital city and remainder of state breakdown for the differences in regional counts, also showing the proportion of the population represented by each category.

There are 24 regions where differences between administrative counts and ERP are greater than 50%.  The majority of these are in the Northern Territory, reflecting the previously discussed PO box location issue present in the administrative data for remote community areas.

The map in Figure 7 illustrates this issue, showing the differences across the Northern Territory with counts incorrectly inflated for the urban centres of Darwin, Katherine and Alice Springs.  Table 1 reflects similar issues for the other states with large numbers of remote communities: Queensland, Western Australia, and South Australia.

The shortfall in areas of Melbourne discussed earlier, likely to be driven by University students, is also apparent in table 1 where about 5% of the population is located in areas that are more than 10% lower than ERP.  A similar issue may also be present in Sydney and Canberra.

Table 1:  Regional differences between administrative counts and ERP, June 2016
 

More than 50% lower

10-50% lowerWithin 10%10-50% higherMore than 50% higher


No. of SA2s

% of ERP

No. of SA2s

% of ERP

No. of SA2s

% of ERP

No. of SA2s

% of ERP

No. of SA2s

% of ERP

Greater Sydney

0

-

9

3.9

285

95.8

1

0.3

0

-

Rest of NSW

0

-

6

1.3

245

97.0

5

1.7

0

-

Greater Melbourne

0

-

15

4.9

282

95.1

0

-

0

-

Rest of Vic

0

-

4

1.6

143

98.4

0

-

0

-

Greater Brisbane

0

-

9

3.8

208

93.9

6

2.3

0

-

Rest of Qld

0

-

17

4.4

245

89.8

17

5.5

2

0.3

Greater Adelaide

0

-

1

0.6

101

99.4

0

-

0

-

Rest of SA

1

0.7

11

12.5

39

76.8

6

10.1

0

-

Greater Perth

0

-

6

3.1

143

94.8

2

2.1

0

-

Rest of WA

4

5.1

6

4.6

58

78.7

7

11.6

0

-

Greater Hobart

0

-

1

1.5

31

98.5

0

-

0

-

Rest of Tas

0

-

0

-

59

96.9

2

3.1

0

-

Greater Darwin

0

-

8

27.7

24

55.1

4

12.0

2

5.1

Rest of NT

11

42.5

6

19.8

3

15.5

2

14.1

2

8.0

ACT

2

1.0

6

7.2

86

89.9

2

2.0

0

-

Australia

18

0.3

105

3.8

1952

94.0

54

1.8

6

0.1

Note:  excludes 105 regions with ERP counts of less than 1000 persons

Figure 7: Percentage difference between administrative counts and ERP for Northern Territory, June 2016

Map of the Northern Territory with Greater Darwin inset, showing percentage difference between administrative counts and ERP for each SA2.
Map of the Northern Territory with Greater Darwin inset, showing percentage difference between administrative counts and ERP for each SA2. The majority of SA2s outside of the Greater Darwin area have administrative counts more than 50% lower than ERP, with Katherine, Tennant Creek and Alice Springs highlighted as they have administrative data counts higher than ERP. Darwin City, Woolner-Bayview-Winnellie and Palmerston North in Greater Darwin also have administrative counts higher than ERP. Map data available in the Data Downloads section.

Further research to improve population counts from administrative data

Our research so far gives us strong confidence that the 2021 Census will be able to use administrative data that is highly representative of the population, at least for large geographic areas and for many smaller geographic areas, down to SA2 level.

As we approach the Census, we are continuing our research to better understand its limitations and to improve representation where possible.

Particular areas of focus, guided by the analysis to-date, include:

  • Increase representation of the younger population, particularly for people in the 20-30 years age range
  • The addition of data sources known to represent international students
  • Better understand whether older Australians are over-represented in the administrative data at the time of the Census, and if so, what information can be used to remove them
  • Improving regional location information, particularly for people living in remote communities, including whether it is possible to accurately adjust administrative data to reflect where people actually live.

For further information, please contact census.futures@abs.gov.au

Data downloads

Map data for Figure 5 and Figure 7

Back to top of the page