Care usually attended
Image

Description
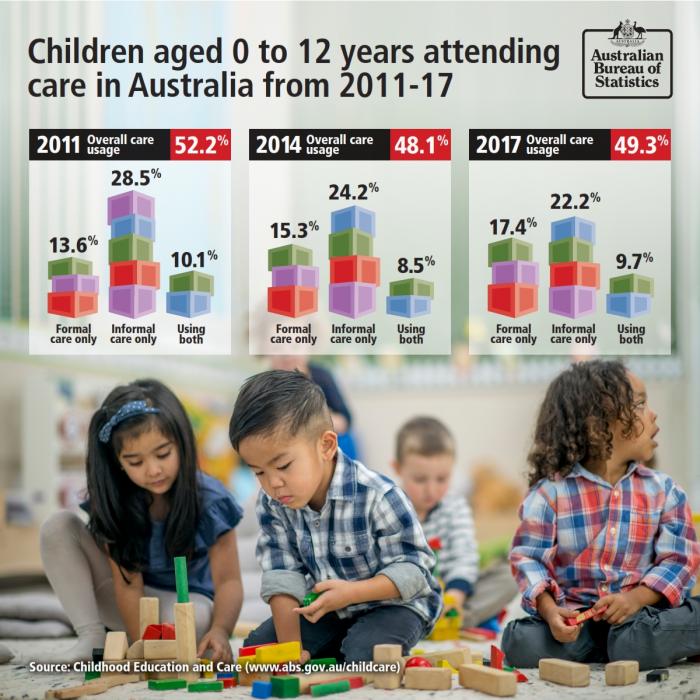
The proportion of children aged 0 to 12 years who usually attended formal and/or informal care decreased from 2011 (52.2%) to 2014 (48.1%) and was about the same in 2017 (49.3%). Breaking this down into the various care arrangements:
- Use of Formal care only (e.g. Long day care) increased slowly from 13.6% in 2011 to 15.3% in 2014, then to 17.4% in 2017.
- Use of Informal care only (e.g. grandparents) decreased slightly from 28.5% in 2011 to 24.5% in 2014, to 22.2% in 2017.
- The proportion of children using a combination of both formal and informal care changed little from 10.1% in 2011, dipping to 8.5% in 2014, then rebounding to 9.7% in 2017.
Care attended last week
ABS data on the use of care back to 1996 shows little change in the use of care in the week before the survey (Endnote A) by children aged 0 to 11 years (Endnote B). The proportion of children in care in 1996 was 45% while it was 47% in 2017.
Over this longer time period, some interesting trends include:
- The proportion of children in formal care increased gradually from 9% in 1996 to 19% in 2017.
- The proportion of children in informal care decreased gradually from 31% in 1996 to 19% in 2017.
- The proportion of children using a package of both formal and informal care increased slightly from 6% in 1996 to 9% in 2017.
Costs and hours of care
Image

Description
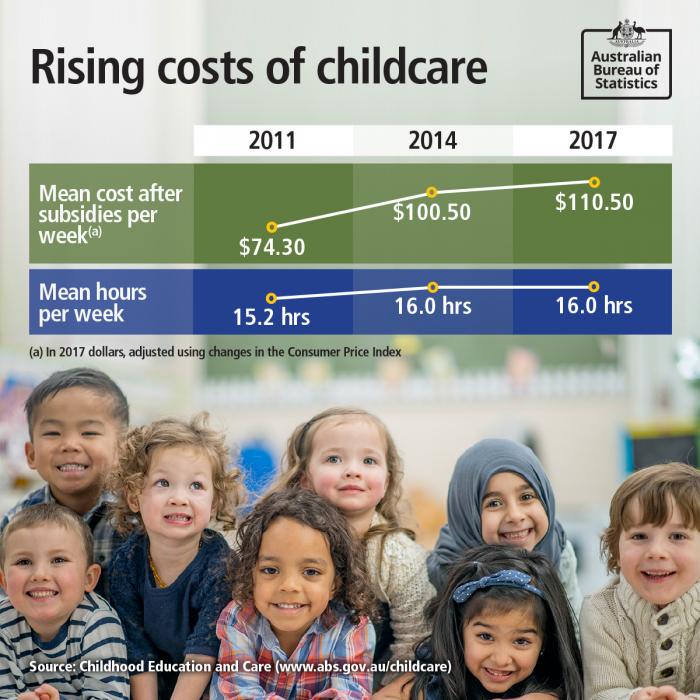
After adjusting for inflation, the average usual weekly cost of formal care (after subsidies) (Endnote C) increased from $74.30 in 2011 to $110.50 in 2017, however the average usual weekly hours were about the same over the period. (Tables 6 & 8)