Payments quadrant
The Labour Payments quadrant accounts for the costs incurred by enterprises in employing labour and the income received by people from its provision.
Payments quadrant
Image
Description
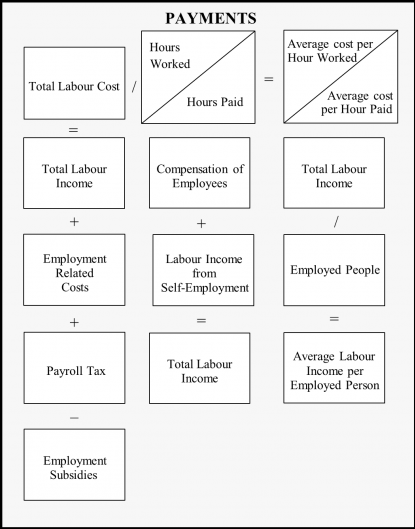
The diagram shows that: Total Labour cost divided by Hours worked equals Average cost per hour worked. Total Labour cost divided by Hours paid equals Average cost per hour paid. Total Labour cost equals Total labour income plus Employment related costs plus Payroll tax less Employment subsidies. Compensation of employees plus Labour income from self-employment equals Total labour income. Total labour income divided by Employed people equals Average labour income per employed person.
Payment concepts
The conceptual framework for statistical measures of employee remuneration in Australia (in the context of the broader concept of labour costs) are discussed in the Earnings chapter. The narrowest concept outlined in the international guidelines is that of 'Earnings'. Concepts of 'Wages and salaries', 'Employee income', 'Compensation of Employees' and 'Labour costs' all include and extend upon the concept of 'Earnings'.
The statistical measure of labour costs is based on the concept of labour as a cost to the employer and relates to:
- all cash and in-kind payments of wage and salaries to employees;
- all contributions by employers in respect of their employees to social security, private pension, casualty insurance, life insurance and similar schemes; and
- all other costs borne by employers in the employment of labour that are not related to employee compensation (such as costs of training, welfare services to employees, payroll taxes etc.).
Measures of labour costs should be net of any subsidies, rebates or allowances from governments for wage and salary payments to employees, or for other labour costs borne by employers.
The definition of labour costs from the 1966 International Conference of Labour Statisticians, paragraph 39 is ‘...remuneration for work performed, payments in respect of time paid for but not worked, bonuses and gratuities, the cost of food, drink and other payments in kind, cost of workers' housing borne by employers, employers' social security expenditures, cost to the employer for vocational training, welfare services and miscellaneous items, such as transport of workers, work clothes and recruitment together with taxes...’.
Payments sources
Labour payments data are primarily sourced from underlying data from the Australian National Accounts (see Chapter 11 of the Australian System of National Accounts: Concepts, Sources and Methods for details on how data are compiled for National Accounts).
Data components of other labour related costs to employers are sourced from the Australian National Accounts: Input-Output Tables, Product Details and underlying information from ABS Supply-Use tables.
The table below summarises data sources used in compiling quarterly estimates in the Labour Payments quadrant.
| Source data | Use in compiling quarterly data |
|---|---|
| Australian National Accounts | Used to estimate compensation of employees, labour income from self-employment, payroll taxes, training and recruitment costs. |
| Australian National Accounts Supply-Use tables | Used to allocate estimate of compensation of employees, labour income from self-employment, training and recruitment costs and employment subsidies to industry subdivision. |
| Government Finance Statistics | Used to estimate employment subsidies. |
| Job Vacancies Survey | Used to apportion annual estimates of recruitment costs into quarters. |
| Labour Force Survey | Used to backcast and forecast Linked Employer-Employee Dataset demographic (sex and age group) proportions. |
| Linked Employer-Employee Dataset | Used to estimate demographic (sex and age group) proportions. |
| Quarterly Business Indicator Survey | Used to apportion annual estimates of training costs into quarters. |
Payments methods
Total labour income
Total labour income is the sum of:
- Compensation of employees; and
- Labour income from self-employment.
Total labour costs
Total labour costs is the sum of:
- Total labour income; and
- Other employment related costs.
Compensation of employees
Estimates of Compensation of employees at a total economy and industry division level are derived from underlying Australian National Accounts data. Division level data from the Australian National Accounts is further disaggregated to industry subdivision in each quarter using Compensation of employees information from the ABS Supply-Use tables for most industries. For some industries, the Supply-Use industries are more aggregated than industry subdivision. For these industries, information from the annual Economic Activity Survey or the proportion of filled jobs from business sources is used to disaggregate data to industry subdivision. One exception is Division S (Other Services), which uses information relating to earnings in all jobs from the household Characteristics of Employment Survey to disaggregate data to industry subdivision, as subdivision 96 (Private Households Employing Staff) is out of scope of all business collections.
Quarterly Compensation of Employees data are not available prior to September 2002. For earlier time periods, data at industry division level are backcast by applying movement in gross earnings from Wage and Salary Earners, Australia to the September 2002 level. These data relate to both the public and private sectors for each industry division except for Division A (Agriculture, Forestry and Fishing), which is limited to the public sector only. As the data are also on a historical industry classification basis, conversion factors (based on annual Australian National Accounts Compensation of Employees benchmark data) are also applied to approximate the current industry classification. These backcast quarterly data are then benchmarked to published annual levels.
Labour income from self-employment
Labour income from self-employment is an estimate of the share of Gross Mixed Income (GMI) attributable to the provision of labour. GMI is the surplus or deficit accruing from production by unincorporated enterprises that includes both the return on labour and return on capital.
The calculation of the labour share of GMI on an annual basis for each industry follows the method described in compiling Productivity Statistics outlined in Chapter 19 (Productivity Measures) of the Australian System of National Accounts: Concepts, Sources and Methods. This method assumes that self-employed proprietors receive the same average compensation per hour as wage and salary earners, and can be summarised as comprising the following steps:
- Average hourly income of wage and salary earners in each industry is calculated by dividing Compensation of Employees by the estimated number of hours worked in all jobs by employees in the industry (excluding the self-employed).
- This hourly rate is then multiplied by the estimated number of hours worked by self-employed people (OMUEs) whose main job is classified to the industry. This information is derived by expanding the average number of hours worked in the reference weeks recorded in the Labour Force Survey by the number of weeks in the quarter and aggregating for the year.
- This estimate is then multiplied by a scaling factor, to constrain to total industry GMI reported in the National Accounts. The scaling factor represents the ratio of the sum of the independently calculated labour and capital shares of GMI, for each industry, to the independently calculated estimate of total industry GMI reported in the National Accounts. This difference can arise from the use of different sources and methods to derive estimates of returns to labour and capital, to the method used by national accounts in calculating total GMI.
- As productivity statistics are not compiled for industries with significant “non-market” components, no GMI scaling factor is applied to estimated self-employed labour income for Division P (Education and Training) and Division Q (Health Care and Social Assistance).
- No GMI is estimated for Division D (Electricity, Gas, Water and Waste Services), Division K (Financial and Insurance Services) and Division O (Public Administration and Safety), as there are no owner managed unincorporated enterprises (OMUEs) classified to these industries.
The Australian Labour Account calculates quarterly labour income from self-employment for each industry division by taking the scaled labour share of GMI from underlying Australian National Accounts productivity data, as calculated using the steps described above, and applying this share to the total level of quarterly GMI for each industry division. This approach ensures consistency between Australian Labour Account estimates of labour income from self-employment and Australian National Accounts GMI data.
As productivity statistics are not compiled for Division P (Education and Training) and Division Q (Health Care and Social Assistance), the scaled labour share of GMI for Division M (Professional, Scientific and Technical Services) is applied to total quarterly GMI for these industries. In addition, the scaled labour share of GMI for Division I (Transport, Postal and Warehousing) is used to represent Division A (Agriculture, Forestry and Fishing).
As industry productivity statistics are only compiled annually, the same annual scaled labour share of GMI is applied to each quarterly GMI measure for the financial year.
To disaggregate quarterly estimates of labour income from self-employment for each industry division to subdivision level, Gross Operating Surplus information from the ABS Supply-Use tables is used for most industries. For some industries, the Supply-Use industries are more aggregated than industry subdivision. For these industries, information from the annual Economic Activity Survey is used.
Quarterly GMI data are not available prior to September 2001. For earlier time periods, data at the industry division level are backcast by applying movements in original Gross Value Added (chain volumes) to the September 2001 level. These backcast data are then benchmarked to annual scaled GMI. For Division P (Education and Training) and Division Q (Health Care and Social Assistance), labour income from self-employment is backcast directly by applying movements in Gross Value Added (chain volumes).
Other employment costs
Other employment costs are the sum of
- Employers payroll taxes;
- Payment for recruitment services;
- Training costs; less
- Employment subsidies.
Employers payroll taxes
Estimates for employers’ payroll taxes at industry division level are taken from underlying Australian National Accounts estimates. Division level data from the Australian National Accounts is further disaggregated to industry subdivision in each quarter using Compensation of Employees information from the ABS Supply-Use tables for most industries. For some industries, the Supply-Use industries are more aggregated than industry subdivision. For these industries, information from the annual Economic Activity Survey is used.
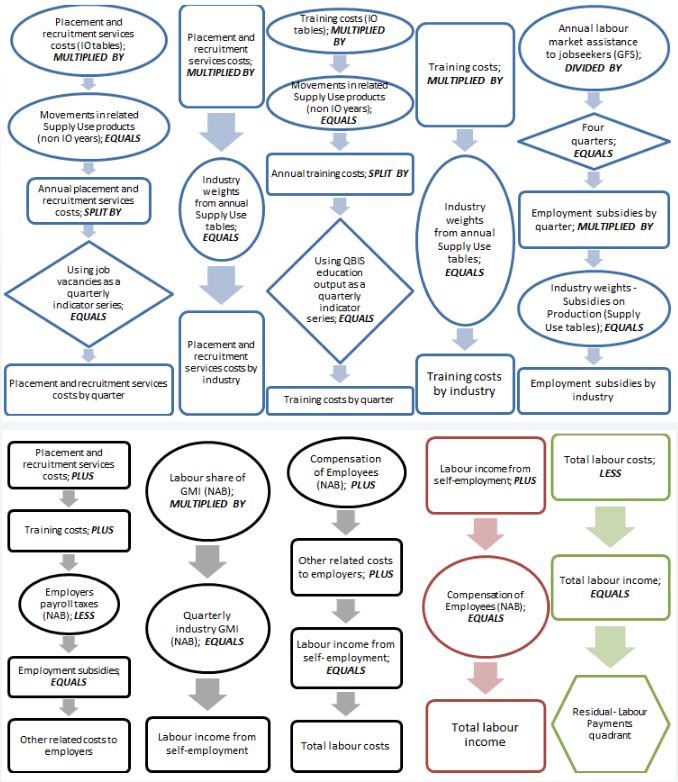
Payment for Recruitment services and Training costs
Estimates of annual total expenditure on recruitment services are calculated as the sum of Intermediate Use (purchase price) and Government Final Consumption Expenditure sourced from the Australian National Accounts: Input-Output Tables, Product Details for Input-Output Product Classification (IOPC) 72110010 (Employment placement and recruitment services). Total quarterly job vacancies from the Job Vacancy Survey are used as a quarterly indicator series to distribute this annual total across the four financial year quarters.
Training Costs are similarly derived and sourced from the Input-Output tables, using the following IOPC codes:
- IOPC 81010010 Technical, vocational and other non-tertiary education services;
- IOPC 81020010 Tertiary higher education services (including undergraduate and postgraduate);
- IOPC 82120010 Arts education services (excluding vocational);
- IOPC 82190011 Adult, community and other education services; and
- IOPC 82200010 Education support services.
Total wages and salaries for Division P (Education and Training) from Business Indicators, Australia are used as a quarterly indicator series to distribute this annual total across the four financial year quarters. As these data are not available prior to March 2001, data for earlier time periods are backcast by applying movements in private sector gross earnings from Wage and Salary Earners, Australia to the March 2001 level.
As Input-Output tables are only available infrequently for earlier periods and with a significant time lag for more recent periods, estimates of total annual expenditure on recruitment services and training costs for the intervening and out years are compiled using underlying data from the Supply-Use tables, based on applying movements in the following Supply-Use Product Classification (SUPC) codes:
- SUPC 72005 Employment placement and recruitment services;
- SUPC 80205 Technical, vocational and tertiary education services; and
- SUPC 80310 Arts, adult and other education services.
Supply-Use tables also provide proportions used to allocate total quarterly expenditure on recruitment services and training costs to industry subdivision. These proportions are based on total intermediate use of these products for each Supply-Use industry, with information from the Economic Activity Survey used for those industries where Supply-Use industries are more aggregated than industry subdivision.
Employment subsidies
Employment subsidies are payments made by government, typically to employers. They may be based on the size of the total workforce, the employment of particular types of people such as those who are physically handicapped or who have been unemployed for long periods. These subsidies may also be intended to cover some or all of the costs of training schemes organised or financed by employers.
Information on employment subsidies is sourced from data provided by the Department of Finance to compile estimates for the publication Government Finance Statistics, Australia – specifically, data relating to “labour market assistance to jobseekers”. As data for the current year employment subsidies estimate is not available at the time of publication of the Australian Labour Account, annual data for the current year are modelled based on previous years’ movements.
Typically, only annual data are available for estimates of employment subsidies. Therefore, quarterly estimates of employment subsidies are derived by evenly distributing the annual estimate across the four quarters. However, additional subsidies payable for a specific purpose may be added in targeted quarters to specific industries.
Employment subsidies data from Government Finance Statistics, Australia are not available prior to 2010-11. Estimates for earlier time periods are modelled based on movements in a similar GFS data item, namely “Commonwealth subsidies paid to other”, where “other” refers to other than public trading enterprises.
To allocate employment subsidies to industry subdivision, data from the Supply-Use tables for subsidies on production by Supply-Use industry are used to derive industry proportions, with information from the Economic Activity Survey used for those industries where Supply-Use industries are more aggregated than industry subdivision.
Payments quadrant demographic model
Payments quadrant estimates are split into sex and age groups using data sourced from the Linked Employer-Employee Dataset (LEED) and Labour Force Survey. Modelled demographic proportions are applied to Labour Account totals to apportion data by sex and age group. LEED data does not cover the entire time period of Labour Account data, which commences at September 1994. To account for this, LEED proportions before 2011-12 and in the most recent two years are adjusted with Labour Force Survey data.
Payments quadrant calculations
Payments quadrant sources and calculations
Image