Census of Population and Housing Destination Zones methodology

Latest release
Reference period
August 2016
Released
14/12/2016
Next release Unknown
First release

Metadata for digital boundaries files

Census of Population and Housing Destination Zones, August 2016 (cat. no. 8000.0)

Date of Publication/ Date Stamp: 14 December 2016

Presentation Format: Digital boundaries

Custodian

Custodian: Australian Bureau of Statistics/State and Territory Transport authorities

Description

Abstract:

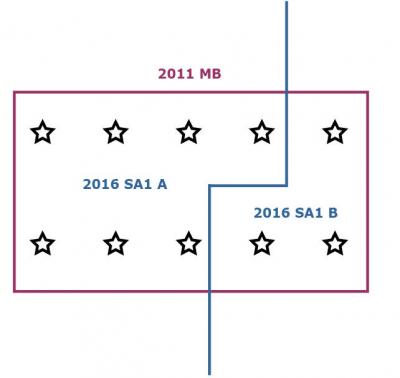
The 2016 Destination Zones (DZN) are based on the 2011 Destination Zones. The 2011 Destination Zones were designed individually by each State or Territory Transport authorities. The Destination Zones are used by the States and Territories and other users for the analysis of Census Place of Work data, commuting patterns and the development of transport policy.

The 2016 Destination Zones are built out of the 2016 Mesh Blocks (MB) and align with the 2016 Statistical Area Level 2 (SA2). They do not align with the Statistical Area Level 1 (SA1)

File structure

File nomenclature:

File names have the format DZN_2016_AUST where:


Within the files, the States and Territories (S/T) are identified by unique one digit codes, as in the table below.

CodeS/T
1New South Wales
2Victoria
3Queensland
4South Australia
5Western Australia
6Tasmania
7Northern Territory
8Australian Capital Territory
9Other Territories

File attributes:

All tables show file type, file name, spatial unit field and the data type.

File Type: Destination Zone (DZN)

File Name: DZN_2016_AUST

CountField (mid/mif, TAB and GeoPackage)Field (ESRI shp)Data TypeLength
1DZN_CODE_2016DZN_CODE16Character9
2SA2_MAINCODE_2016SA2_MAIN16Character11
3SA2_5DIGITCODE_2016SA2_5DIG16Character5
4SA2_NAME_2016SA2_NAME16Character50
5STATE_CODE_2016STE_CODE16Character1
6STATE_NAME_2016STE_NAME16Character50
7AREA_ALBERS_SQKMAREASQKM16Float(a) 

a. Data type for ESRI Shp is Double
 

XML metadata file

The Destination Zone compressed download files include geospatial metadata data in Extensible Markup Language (XML) format. The geospatial metadata conforms to International Organization for Standardization (ISO) geospatial metadata standard, ISO 19115:2003, and the associated XML implementation schema specified by ISO 19139:2012.

Data currency

Date of Effect: 9 August 2016

Dataset status

Progress: Completed dataset

Maintenance and update frequency:

No further update for these boundaries are planned. The Destination Zones will be revised for the 2021 Census of Population and Housing.

Access

Stored data format:

Digital as separate files for the 2016 Destination Zones.

Available format:

The digital boundary files are in MapInfo TAB format (.TAB), MapInfo Interchange Format (.MID .MIF), Geopackage and ESRI Shapefile (.shp) format.

Spatial representation type:

Vector

Access constraints:

Copyright Commonwealth of Australia administered by the ABS. Unless otherwise noted, content is licensed under a Creative Commons Attribution 2.5 Australia licence.

Datum:

Geocentric Datum of Australia 1994 (GDA94)

The digital boundary files have the datum specified as 116 (GDA94). Users of MapInfo 6.0 or later are able to load data sets based on GDA94 directly, without transformation. Earlier versions of MapInfo cannot interpret GDA94 correctly and there may be alignment problems between data sets based on this datum and other earlier datums.

Projection:

Geographical (i.e. Latitudes and Longitudes)

Geographic extent:

Geographic Australia

Extent - Geographic bounding box:

North Bounding Latitude: -8
South Bounding Latitude: -45
West Bounding Latitude: 96
East Bounding Latitude: 169

Data quality

Lineage:

Mesh Block boundaries were created using various sources including the PSMA digital datasets and ABS boundaries, zoning information from State and Territory planning agencies and imagery.

Positional accuracy:

Positional accuracy is an assessment of the closeness of the location of the spatial objects in relation to their true positions on the earth's surface.

The positional accuracy includes:

  • a horizontal accuracy assessment
  • a vertical accuracy assessment
     

Positional accuracy for ABS boundaries is dependent on the accuracy of the features they have been aligned to. ABS boundaries are aligned to a number of layers supplied by PSMA with an accuracy of +/-50 mm.

PSMA layers and their positional accuracy are as follows:

  • Transport and Topography
    +/- 2 meters in urban areas and +/- 10 meters in rural and remote areas
     
  • CadLite
    +/- 2 meters in urban areas and +/- 10 meters in rural and remote areas
     
  • Administrative Boundaries
    Derived from the cadastre data from each Australian State and Territory jurisdiction
     
  • Greenspace and Hydrology
    90% of well-defined features are within 1mm (at plot scale) of their true position, eg 1:500 equates to +/- 0.5 metre and 1:25,000 equates to +/- 25 metres. Relative spatial accuracy of these themes reflects that of the jurisdictional source data. The accuracy is +/- 2 metres in urban areas and +/- 10 metres in rural and remote areas. No "shift" of data as a means of "cartographic enhancement" to facilitate presentation has been employed for any real world feature.

Attribute accuracy:

All codes and labels for the 2016 Destination Zone are fully validated.

Logical consistency:

Regions are closed polygons. Attribute records without spatial objects have been included in the data for administrative purposes.

Completeness:

All geographic levels of the 2016 Destination Zones are represented.

Contact information

Contact Organisation: Australian Bureau of Statistics

Contact: For further information email client.services@abs.gov.au or contact the National Information and Referral Service (NIRS) on 1300 135 070.

Information about CSV files

The Census of Population and Housing Destination Zones (cat. no. 8000.0) contains allocation tables in comma-separated value (.csv) files. The files lists the codes, labels and hierarchy for the 2016 Destination Zones (DZN).

There is one .csv file listing the geographical hierarchies for Destination Zones from the Mesh Block (MB) level, and one .csv file listing the Destination Zone geographical hierarchies from the Destination Zone.

File contents:

MB_DZN_SA2_2016_AUST.csv contains all Mesh Blocks and includes the following fields:

  • MB_CODE_2016
  • DZN_CODE_2016
  • SA2_MAINCODE_2016
  • SA2_5DIGITCODE_2016
  • SA2_NAME_2016
  • STATE_CODE_2016
  • STATE_NAME_2016
  • AREA_ALBERS_SQKM (MB Area)
     

This lists the Mesh Blocks that make up the Destination Zones, Statistical Areas Level 2 (SA2) and State/Territory. It also gives the area in square kilometres of the Mesh Block, based on Albers Conic Equal Area projection.

DZN_SA2_2016_AUST.csv contains the following fields:

  • DZN_CODE_2016
  • DZN_5DIGITCODE_2016
  • SA2_MAINCODE_2016
  • SA2_5DIGITCODE_2016
  • SA2_NAME_2016
  • STATE_CODE_2016
  • STATE_NAME_2016
  • AREA_ALBERS_SQKM
     

This lists the Destination Zones that make up the Statistical Areas Level 2, State/Territory. It also gives the area in square kilometres of the Destination Zone, based on Albers Conic Equal Area projection.

Information about the 2011 to 2016 Destination Zone correspondence

The ABS has developed a geographical correspondence to help users identify change between the 2011 and 2016 Destination Zones. Correspondences are a mathematical method of reassigning data from one geographic region to another geographic region. The 2011 to 2016 Destination Zone correspondence utilises a 2011 Mesh Block (MB) population weighted grid.

In many cases a correspondence is the only option available when attempting to convert data from one geographic region to another and may be an appropriate approach. However, caution should always be used when applying correspondences as there may be instances where this approach would not appropriately reflect the actual characteristics of a region. Issues surrounding the use of correspondences are discussed in the ABS publication: Information Paper: Converting Data to the Australian Statistical Geography Standard, 2012 (cat. no. 1216.0.55.004).

This document details how the population weighted grid method produces correspondences, and provides a description of how the quality indicator is calculated. To assist users with making a determination of how well a correspondence may or may not convert data, the ABS has developed a quality indicator which is supplied with each correspondence.

The following Australian Statistical Geography Standard (ASGS) Main Structure example and method reflects the approach used for the production of the Destination Zones correspondence.

Population weighted grid correspondences

The population weighted grid method that the ABS has adopted generates a series of grid points that represent the underlying geographical distribution of a weighting unit, most often the Mesh Block population. For the population distribution, these points have been developed with input from various administrative sources including Geoscience Australia's Gazetteer and PSMA's Geocoded National Address File.

Each grid point is assigned a value based on this population weight. These are subsequently used as a basis for determining how much of the weighting unit is donated to a 'TO unit' based on how the weighting unit is intersected. This is demonstrated in the below example which develops a 2011 Mesh Block to 2016 Statistical Area Level 1 (SA1) correspondence.

Diagram 1: Example of developing a correspondence between 2011 MB and two 2016 SA1s which intersect a MB.

Diagram 1: Graphical description of distribution of weighting values used to calculate correspondences.

In the example the red boundary is a 2011 Mesh Block, which is the weighting unit in this correspondence. It is intersected by two 2016 SA1s, which are the TO units, or the geographical boundaries that are being corresponded to. The Mesh Block weighting unit above contains 40 persons. This population is then evenly distributed across the 10 grid points, meaning each grid point represents 4 persons.

The next step in the correspondence generation process is to determine the proportion that the Mesh Block, as the weighting unit, is donating to the respective SA1 TO units. As can be seen in the diagram above there are 7 grid points in SA1 A, and three in SA1 B. Given that each grid point represents 4 persons, 28 persons are located in SA1 A and 12 in SA1 B. In proportional terms the weighting unit is then donating to the respective SA1s as follows:

  • SA1 A: 28 / 40 which gives a ratio of 0.7 or 70 per cent.
  • SA1 B: 12 / 40 which gives a ratio of 0.3 or 30 per cent.


So the result is that the Mesh Block in question is donating 70 per cent of its data to SA1 A, and 30 per cent of its data to SA1 B.

The benefit of using this method is that any two sets of geographic regions can have a correspondence generated for them, and that any attribute value can be distributed across the grid to be used as the weighting unit.

Quality indicators

The ABS conducted an investigation to determine how accurately correspondences converted data. This found that while some correspondences converted data well, there were many cases where the converted data did not reflect the actual characteristics of some geographical regions. Based on these findings a quality indicator was developed to inform data users of instances where the converted data values are likely to be accurate, and where caution will be needed to be used when assessing the results.

The method that has been developed to generate the quality indicator involves a number of steps. Firstly it looks at the value that a FROM region donates to a TO region as a ratio of the whole FROM region. The next step is to examine the value that the FROM region donates to the TO region as a ratio of the whole TO region. These two values are then multiplied together to provide the component for that FROM region. This process is then repeated for each donating FROM region, with the component values then added to provide the overall score for the TO region. Based on the score returned, a textual description is then applied as to how well the ABS expects data to be converted to the TO region. This is highlighted in the example below.

Diagram 2: Illustration of 3 FROM regions to 1 TO region.

Diagram 2: Graphical description of Quality Indicator calculation


In this example there are three FROM regions A, B and C represented by the black boundaries. The TO region is represented by the red ellipse.

Region A calculation

STEP 1: Region A donates 20 persons to the TO region, while there are a further 60 people in FROM Region A that are not donated to the TO region. Therefore the ratio of FROM region A is 20 / 80, or 0.25.
STEP 2: The next step is to look at the value that is being donated from Region A compared to the total value of the TO region (ie 80 persons comprising 20 from Region A + 20 from Region B + 40 from Region C). Region A donates 20 persons, and the total population is 80. So in this case the ratio is 20 / 80, or 0.25.
STEP 3: Region A's component score is then calculated by multiplying the TO and FROM score (0.25 x 0.25) giving Region A a component score of 0.0625.

The same process is then applied to FROM Regions B and C.

Region B calculation

Region B donates 20 persons with a further 80 persons in the remainder of the FROM region. Therefore its ratio is 20 / 100 or 0.2. Region B donates 20 persons and the total population of the TO region is 80 so the ratio is 20 / 80 or 0.25. Region B's component score is therefore 0.2 x 0.25 or 0.05.

Region C calculation

Again Region C donates 40 persons with another 60 in the remainder of FROM Region C. The ratio is 40 / 100 or 0.4. The 40 persons donated are then compared against the total population of the TO region of 80, so the ratio is 40 / 80 or 0.5. This results in the component score for From Region C being 0.4 x 0.5 or 0.2.

Summing component scores

The final step is to add the three component scores. In this case:

  • Region A = 0.0625
  • Region B = 0.05
  • Region C = 0.2
     

Individual quality indicator

The final result is that the TO region in this example would have a quality indicator score of 0.3125, a score that the ABS would regard as being poor, meaning that caution would have to be used when using the results of data converted to the TO region.

The textual descriptions and the associated definitions that will be supplied for each TO region in a correspondence are as follows.

Good (Greater than 0.9) – The ABS expects that for this TO region the correspondence will convert data to a high degree of accuracy and users can expect the converted data will reflect the actual characteristics of the geographic regions involved.

Acceptable (0.75 to 0.9) – The ABS expects that for this TO region the correspondence will convert data to a reasonable degree of accuracy, though caution needs to be applied as the quality of the converted data will vary and may differ from the actual characteristics of the geographic regions involved.

Poor (Less than 0.75) – The ABS expects that for this TO region there is a high likelihood the correspondence will not convert data accurately and that the converted data should be used with caution as it may not reflect the actual characteristics of many of the geographic regions involved.

Overall quality measure

An overall quality measure is given to each correspondence. The aim of this is to provide users with a reasonable idea of how well the correspondence will convert data across the whole of the correspondence.

The overall quality measure is derived from multiplying the population of each TO region with that TO regions quality indicator score, based on the methodology described above. The values produced by this multiplication for each TO region are then added together. This aggregated value is then divided by the total population of the TO regions. This will return a result similar to the individual quality indicator scores. Similar textual descriptions are then applied.

Good – The ABS expects that the correspondence will convert data overall to a high degree of accuracy and users can expect the converted data will reflect the actual characteristics of the geographic regions involved.

Acceptable – The ABS expects that the correspondence will convert data overall to a reasonable degree of accuracy, though caution needs to be applied as the quality of the converted data will vary and may differ in parts from the actual characteristics of the geographic regions involved.

Poor – The ABS expects there is a high likelihood the correspondence will not convert data overall accurately and that the converted data should be used with caution as it may not reflect the actual characteristics of many of the geographic regions involved.

Metadata for correspondence file

Correspondences allow users to reallocate data between areas by providing a population weighted proportionate distribution and a goodness of fit indicator. These correspondences may then be extended to develop a one to one concordance based on the most significant contributors.

This publication contains a correspondence for the Destination Zones between the 2011 and 2016 editions.

File format

The correspondence is supplied in Microsoft Excel format (.xls). Within the Microsoft Excel file there may be several Worksheets along with a Contents page and Explanatory Notes.

The Worksheets are as follows:

QI_MEASURE

This Worksheet contains the overall quality measure in textual description, This Worksheet will always be supplied with correspondences.

QI_INDICATOR

This Worksheet contains the individual quality indicator in textual descriptions for every TO region. This Worksheet will always be supplied with correspondences.

CORRESPONDENCE

This Worksheet contains the main correspondence and the majority of the records. This Worksheet will always be supplied with correspondences.

NULL_TO_OR_FROM_FIELD

This Worksheet contains records where a FROM region does not have a corresponding TO region, or vice versa. An example of when this may occur is when one geography dataset contain islands which are not included in the other dataset. This Worksheet will only be supplied if records fall in to this category.

BELOW_MINIMUM_OUTPUT_SIZE

This Worksheet contains records that have a statistical weight below a pre-set minimum (typically below 0.01). These are records where the proportion of the FROM region that is being donated is very small and is deemed as being statistically insignificant. This Worksheet will only be supplied if there are records that fall in to this category.

MISSING_TO_UNITS

Contains records where the TO unit is not represented elsewhere in the correspondence. This is due to the TO unit being very small relative to the FROM unit and, as a result, a grid point is not associated with the TO unit. In cases where this occurs, documentation will be included with the affected correspondence as well as a list of the TO units that are not represented in the other Worksheets.

File naming convention for grid based correspondence

Correspondence file name

Grid based correspondences supplied by the ABS have a standard naming convention applied. The examples below relates to a correspondence where 2011 Statistical Areas Level 2 (SA2) are being corresponded to 2016 SA2s.

File name:

Statistical Area Level 2 2011 TO Statistical Area Level 2 2016

and

CG_SA2_2011_SA2_2016.xls

Table 1 - Character and meaning of the file name

CharacterMeaning
CCorrespondence
GGrid based correspondence
SA2Represents the name of the FROM region, in this case Statistical Area Level 2
2011The year that this version of the FROM region was released
SA2Represents the name of the TO region, in this case Statistical Area Level 2
2016The year that this version of the TO region was released
.xlsThe format that the file is being supplied, Microsoft Excel format

Correspondence workbook and field definitions

Below is an example of the content for each of the Worksheets in the correspondence Microsoft Excel Workbook files provided in this publication. Definition of the fields in the Worksheets is also provided with the examples.

The QI_MEASURE Worksheet

Table 2 - An example of the overall quality indicator of a grid based correspondence file

QI_MEASURE
Good


In the above example the field name and descriptions are:

QI_MEASURE

The overall quality indicator for the entire correspondence.

The same textual descriptions used for the overall quality measure are also applied to the individual quality indicators. The textual descriptions are Good, Acceptable and Poor.

The QI_INDICATOR Worksheet

Table 3 - An example of the quality indicator of a grid based correspondence file for each TO region

SA2_MAINCODE_2016SA2_NAME_2016QI_INDICATOR
801051123Black MountainPoor
801051126Parkes (ACT) - NorthPoor
801101137MolongloPoor
505031255Alkimos - EglintonPoor
801071132Tuggeranong - WestPoor
801101139WrightPoor
127011592Badgerys CreekPoor
209041437WollertPoor


In the above example the field names and descriptions are as follows:

SA2_CODE_2016

This is a unique code associated with each TO region, to which a textual description of quality is supplied. In this case it is the unique SA2 code.

SA2_NAME_2016

This is the name of the SA2 which in this example is the TO region to which a textual description of quality is supplied.

QI_INDICATOR

This is the textual description of quality that is supplied for each TO region of the correspondence.

The same textual descriptions used for the individual quality indicators are also applied to the overall quality measure. The textual descriptions are Good, Acceptable and Poor.

The CORRESPONDENCE Worksheet

Table 4 - An example of a grid based correspondence file

SA2_MAINCODE_2011SA2_NAME_2011SA2_MAINCODE_2016SA2_NAME_2016RATIOPERCENT
101011001Goulburn101051539Goulburn1.0100
101011002Goulburn Region101051540Goulburn Region1.0100
101011003Yass101061541Yass1.0100
101011004Yass Region101061542Yass Region1.0100
101011005Young101061543Young1.0100
101011006Young Region101061544Young Region1.0100
101021007Braidwood101021007Braidwood1.0100
101021008Karabar101021008Karabar1.0100


In the above example the field names and descriptions are as follows:

SA2_MAINCODE_2011

This is the unique numerical code representing the FROM region and in this case, the unique 2011 SA2 code.

SA2_NAME_2011

This is a textual label associated with the unique code of the FROM region, in this case it is the textual label for each 2011 SA2.

SA2_MAINCODE_2016

This is the unique numerical code representing the TO region, in this case it is the unique 2016 SA2 code.

SA2_NAME_2016

This is a textual label associated with the unique code of the TO region, in this case it is the textual label for each 2016 SA2.

RATIO

This field describes the Ratio of the FROM region that is being donated to the TO region. The Ratio is a figure between 0 and 1.

PERCENTAGE

This field describes the Percentage of the FROM region that is being donated to the TO region. The Percentage is the Ratio multiplied by 100.

The NULL_TO_OR_FROM_FIELD Worksheet

Table 5 - An example of a table identifying NULL areas in either the TO or FROM region in a grid based correspondence

SA2_MAINCODE_2011SA2_NAME_2011SA2_MAINCODE_2016SA2_NAME_2016RATIOPERCENT
  102011030Calga - Kulnura1.0100


In the above example the field names and descriptions are as follows:

SA2_MAINCODE_2011

This is the unique numerical code representing the FROM region, in this case it is the unique 2011 SA2 code. In the example above there is no 2011 SA2 listed which indicates that the 2016 SA2 does not correspond with any 2011 SA2.

SA2_NAME_2011

This is a textual label associated with the unique code of the FROM region, in this case it is the textual label for each 2011 SA2.

SA2_MAINCODE_2016

This is the unique numerical code representing the TO region, in this case it is the unique 2016 SA2 code.

SA2_NAME_2016

This is a textual label associated with the unique code of the TO region, in this case it is the textual label for each 2016 SA2.

RATIO

This field describes the Ratio of the FROM region that is being donated to the TO region. The Ratio is a figure between 0 and 1.

PERCENTAGE

This field describes the Percentage of the FROM region that is being donated to the TO region. The Percentage is the Ratio multiplied by 100.

The BELOW_MINIMUM_OUTPUT_SIZE Worksheet

Table 6 - An example of a table identifying ratios and percents of a TO region that is below minimum output size

SA2_MAINCODE_2011SA2_NAME_2011SA2_MAINCODE_2016SA2_NAME_2016RATIOPERCENT
107041144Balgownie - Fairy Meadow107041145Corrimal - Tarrawanna - Bellambi6.36e-050.0063571
109011172Albury - East109011175Albury Region5.91e-050.0059077
111021219Toronto - Awaba111021220Wangi Wangi - Rathmines7.54e-050.0075379


In the above example the field names and descriptions are as follows:

SA2_MAINCODE_2011

This is the unique numerical code representing the FROM region, in this case it is the unique 2011 SA2 code.

SA2_NAME_2011

This is a textual label associated with the unique code of the FROM region, in this case it is the textual label for each 2011 SA2.

SA2_MAINCODE_2016

This is the unique numerical code representing the TO region, in this case it is the unique 2016 SA2 code.

SA2_NAME_2016

This is a textual label associated with the unique code of the TO region, in this case it is the textual label for each 2016 SA2.

RATIO

This field describes the Ratio of the FROM region that is being donated to the TO region. The Ratio is a figure between 0 and 1. In many cases, as can be seen in the example above, the amount that a FROM region is donating to a TO region is very small and is expressed as an exponential value.

PERCENTAGE

This field describes the Percentage of the FROM region that is being donated to the TO region. The Percentage is the Ratio multiplied by 100. In many cases, as can be seen in the example above, the amount that a FROM region is donating to a TO region is very small.

The MISSING_TO_UNITS Worksheet

There may be cases where a TO unit is not represented in a correspondence file. This is due to the TO unit being very small relative to the FROM unit, and as a result a grid point is not associated with the TO unit. In cases where this occurs, an additional worksheet will be included with the affected correspondence file. It will consist of a list of the TO units that are not represented in any of the other Worksheets listed above, and will be in a similar format.

Further information

More information on the ASGS and ABS Statistical Geography can be found by visiting the ABS website: https://www.abs.gov.au/geography

 Any questions or comments can be emailed to client.services@abs.gov.au or contact the National Information and Referral Service (NIRS) on 1300 135 070.

Back to top of the page